. 2018 Jan 9;114(1):178-187.
doi: 10.1016/j.bpj.2017.11.004.

Essential Role of the ε Subunit for Reversible Chemo-Mechanical Coupling in F1-ATPase

Affiliations

Essential Role of the ε Subunit for Reversible Chemo-Mechanical Coupling in F1-ATPase

Rikiya Watanabe et al. Biophys J. .

Abstract

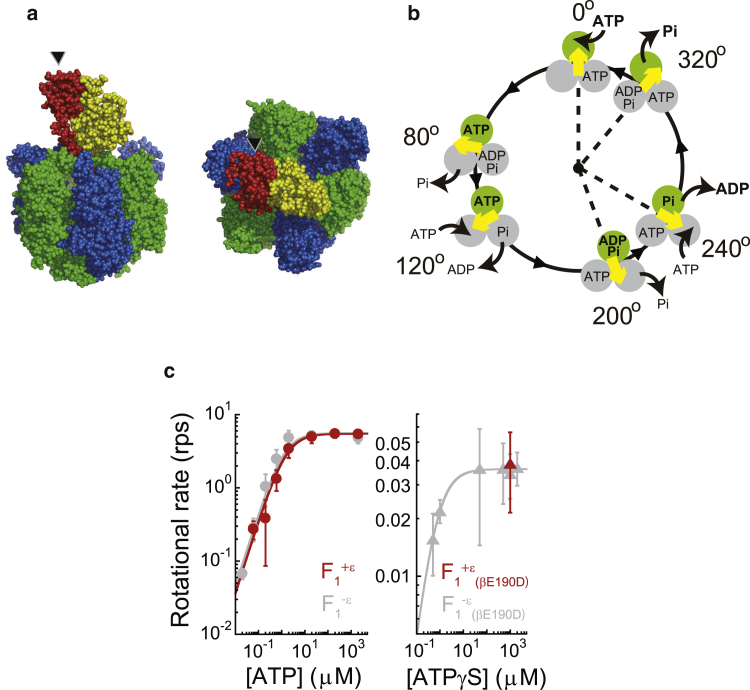
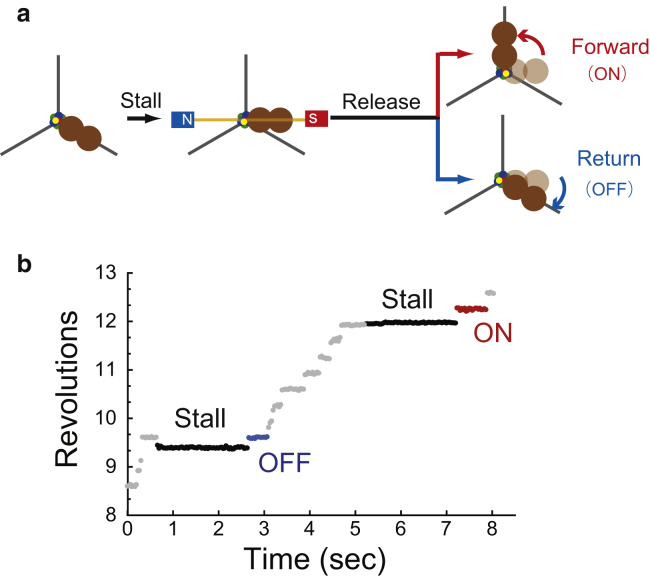
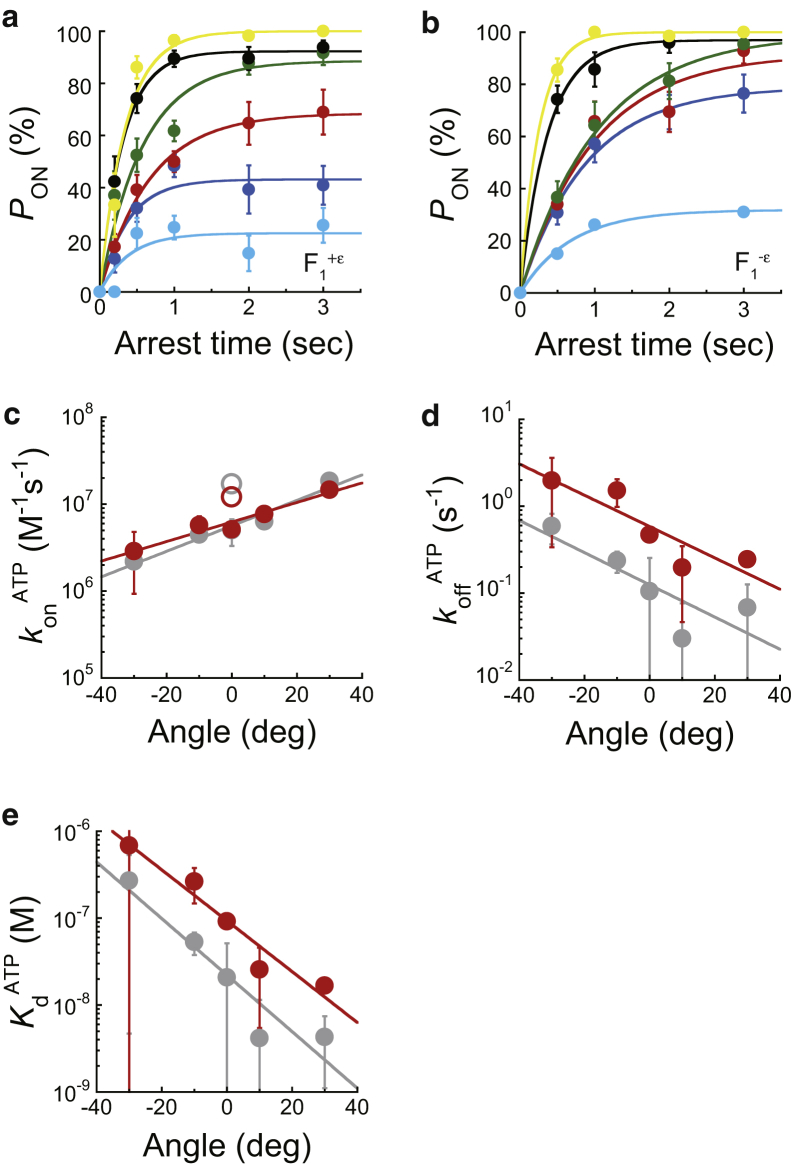
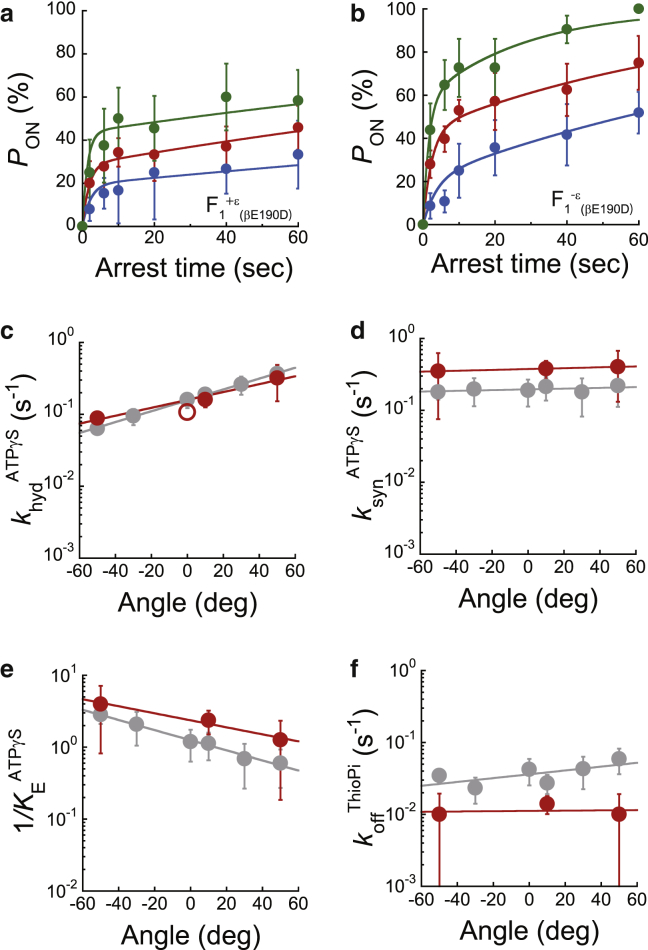
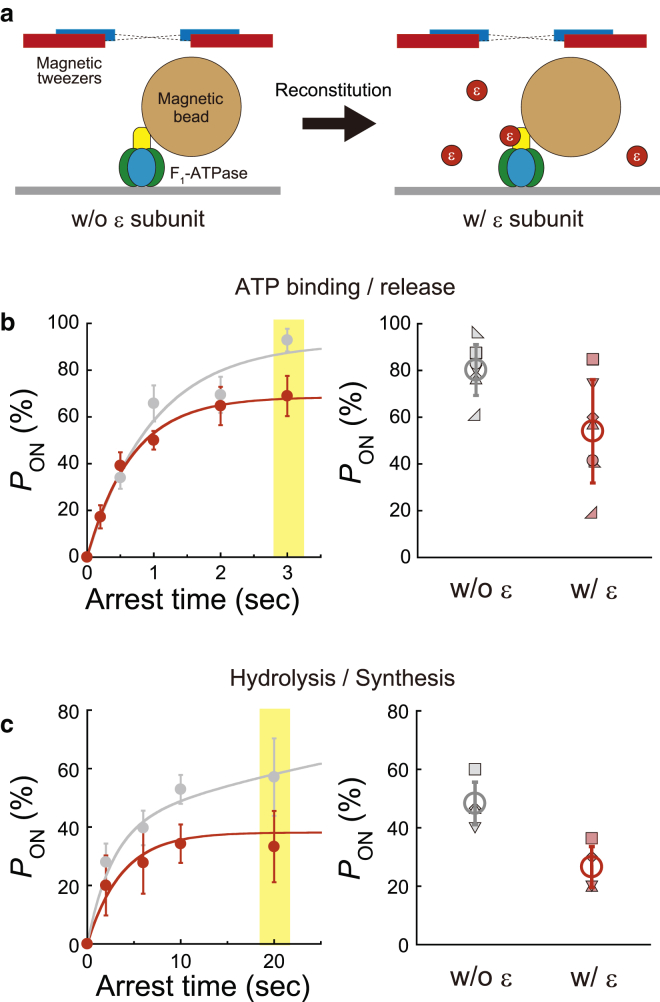
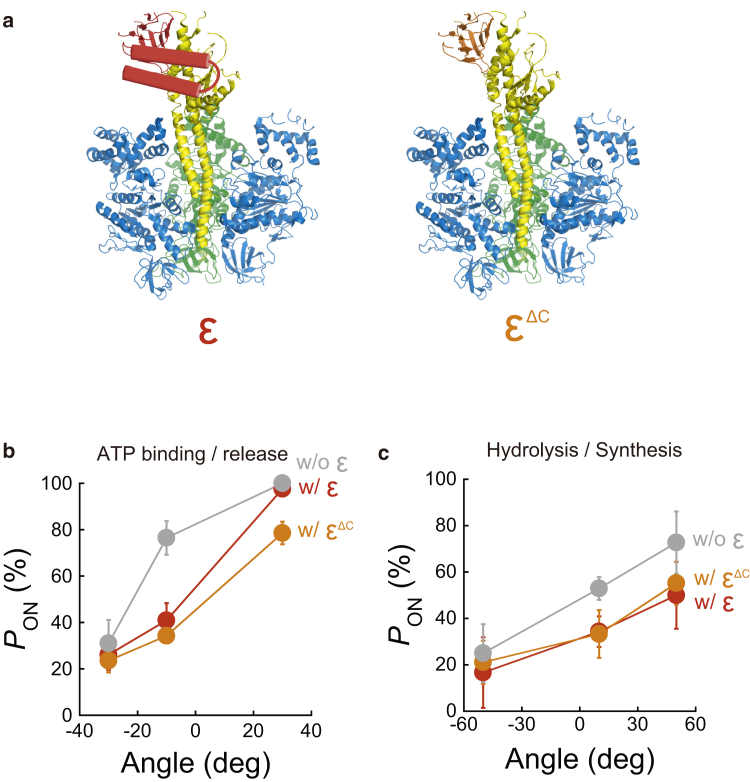
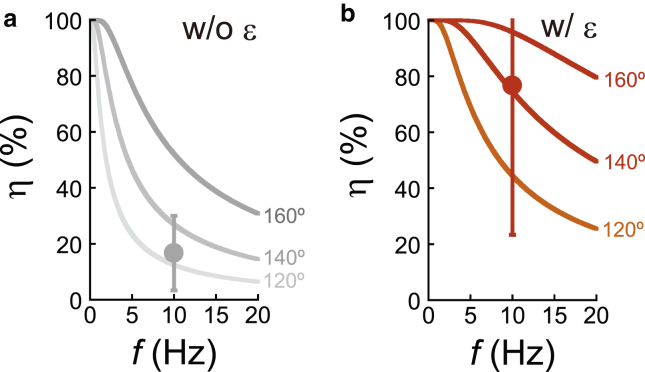
F1-ATPase is a rotary motor protein driven by ATP hydrolysis. Among molecular motors, F1 exhibits unique high reversibility in chemo-mechanical coupling, synthesizing ATP from ADP and inorganic phosphate upon forcible rotor reversal. The ε subunit enhances ATP synthesis coupling efficiency to > 70% upon rotation reversal. However, the detailed mechanism has remained elusive. In this study, we performed stall-and-release experiments to elucidate how the ε subunit modulates ATP association/dissociation and hydrolysis/synthesis process kinetics and thermodynamics, key reaction steps for efficient ATP synthesis. The ε subunit significantly accelerated the rates of ATP dissociation and synthesis by two- to fivefold, whereas those of ATP binding and hydrolysis were not enhanced. Numerical analysis based on the determined kinetic parameters quantitatively reproduced previous findings of two- to fivefold coupling efficiency improvement by the ε subunit at the condition exhibiting the maximum ATP synthesis activity, a physiological role of F1-ATPase. Furthermore, fundamentally similar results were obtained upon ε subunit C-terminal domain truncation, suggesting that the N-terminal domain is responsible for the rate enhancement.


Figures

Figure 1
Figure 1
Rotary catalysis of F1-ATPase. (a) Crystal structure of the α3β3γε complex, F1+ε, from thermophilic Bacillus PS3 (PDB: 4XD7). The α, β, γ, and ε subunits are colored in blue, green, yellow, and red, respectively. The black arrowheads indicate the ε subunit. (b) Chemo-mechanical coupling scheme of F1 at low ATP concentration. The circles and yellow arrows represent the catalytic state of the β subunits and the angular positions of the γ subunit. Each β subunit completes one turnover of ATP hydrolysis in a turn of the γ subunit, where the three β subunits vary in their catalytic phase by 120°. Regarding the catalytic state of the top β subunit (green), ATP binding, hydrolysis, ADP release, and inorganic phosphate (Pi) release occur at 0, 200, 240, and 320°, respectively. (c) The rotational velocity (V) of F1+ε (red, left panel), F1ε (gray, left panel), F1+ε(βE190D) (red, right panel), and F1ε(βE190D) (gray, right panel) obtained using magnetic beads at various ATP or ATPγS concentrations. The curves represent Michaelis–Menten fits with V = Vmax[ATP]/([ATP] + Km), where Vmax = 5.5 and 5.6 s−1, Km = 2.0 and 1.2 μM, and the corresponding ATP-binding rate, kon = 3 × Vmax/Km; 0.8 × 107 and 1.4 × 107 M−1·s−1 for F1+ε and F1ε, respectively. To see this figure in color, go online.
Figure 2
Figure 2
Single-molecule manipulation with magnetic tweezers. (a) Schematic of manipulation procedures. When F1 paused at the ATP-binding or hydrolysis dwell, the magnetic tweezers were turned on to stall F1 at the target angle then turned off to release the motor after the set time. Released F1 either steps forward (ON) or returns to the original pause angle (OFF). These behaviors indicate that the reaction under investigation has completed or not, respectively. (b) Examples of stall-and-release traces for ATP binding of F1+ε at 200 nM ATP. During a pause, F1+ε was stalled for 2 s and then released. After release, F1+ε stepped to the next binding angle without moving back (red), indicating that ATP had already bound to F1+ε before release. When stalled for 2 s, F1+ε rotated back to the original binding angle (blue), indicating that no ATP binding had occurred. To see this figure in color, go online.
Figure 3
Figure 3
Angle dependence of ATP binding and release. (a and b) Time courses of pON of F1+ε (a) and F1ε (b) at 200 nM ATP after stalling at −30° (cyan), −10° (blue), 0° (red), +10° (green), +30° (black), or +50° (yellow) from the original ATP-binding angle. konATP and koffATP were determined by fitting to a single exponential function: pON = (konATP·[ATP]/(konATP[ATP] + koffATP)) × (1 − exp(−(konATP[ATP] + koffATP) × t)), according to the reversible reaction scheme, F1 + ATP ⇄ F1∙ATP. Each data point was obtained from 29 to 80 trials using more than five molecules. The error in pON is given as pON(100pON)/N, where N is the number of trials for each stall measurement. (ce) Angle dependence of konATP, koffATP, and KdATP plotted against the arrest angle. Zero degrees corresponds to the ATP-binding angle in Fig. 1b. The open symbols represent the konATP determined from freely rotating F1. Red and gray symbols represent the values for F1+ε and F1ε, respectively. deg, degree. To see this figure in color, go online.
Figure 4
Figure 4
Angle dependence of ATPγS hydrolysis, synthesis, and Thio-Pi release. (a and b) Time courses of pON of F1+ε(βE190D) (a) and F1ε(βE190D) (b) at 1 mM ATPγS after stalling at −50° (blue), +10° (red) or +50° (green) from the original hydrolysis waiting angle (200° in Fig. 1b). khydATPγS, ksynATPγS, KEATPγS, and koffThio-Pi were determined by fitting to a consecutive reaction model. Each data point was obtained from 12 to 78 trials using more than five molecules. The error in pON is given as pON(100pON)/N, where N is the number of trials for each stall measurement. (cf) Angle dependence of khydATPγS, ksynATPγS, KEATPγS, and koffThio-Pi plotted against arrest angle. Zero degrees corresponds to the hydrolysis angle in Fig. 1b. Red and gray symbols represent the values for F1+ε(βE190D) and F1ε(βE190D), respectively. deg, degree. To see this figure in color, go online.
Figure 5
Figure 5
Buffer exchange experiments. (a) Schematic of buffer exchange experiments: pON measured for a target F1 molecule, exchanged with the buffer including 50 nM ε subunits for the reconstitution of F1+ε or F1+ε(βE190D) complex, and then pON measured again. (b) Left panel shows the time course of pON of F1+ε (red) and F1ε (gray) at 200 nM ATP determined from the ensemble average at ± 0°. pON at 3 s was highlighted using a yellow bar. Right panel shows pON determined by buffer exchange experiments, with a stall at ± 0° for 3 s for the same rotating molecules before (gray) and after reconstitution of the ε subunit (red). The pON for each molecule is displayed using different symbols. The open circles represent the averages of seven molecules. (c) Left panel shows the time course of pON of F1+ε(βE190D) (red) and F1ε(βE190D) (gray) at 1 mM ATPγS determined from the ensemble average at ± 0°. pON at 20 s was highlighted using a yellow bar. Right panel shows PON determined by buffer exchange experiments, with a stall at ± 0° for 20 s for the same rotating molecules before (gray) and after reconstitution of the ε subunit (red). The pON for each molecule is displayed using different symbols. The open circles represent the averages of four molecules. w/o, without; w/, with. To see this figure in color, go online.
Figure 6
Figure 6
C-terminal domain of the ε subunit. (a) Cross section view of F1+ε (left) and F1Δc (right) from thermophilic Bacillus PS3 (PDB: 4XD7). The C-terminal α-helices of the ε subunit are illustrated using cylindrical diagrams. The ε subunits with (ε) or without C-terminal α-helices (εΔc) are colored in red and orange, respectively. (b) pON at 200 nM ATP for F1ε (gray), F1+ε (red), and F1+εΔc (orange) were plotted against the arrest angle. (c) pON at 1 mM ATPγS for F1ε(βE190D) (gray), F1+ε(βE190D) (red), and F1+εΔc(βE190D) (orange) were plotted against the arrest angle. deg, degree; w/o, without; w/, with. To see this figure in color, go online.
Figure 7
Figure 7
Chemo-mechanical coupling efficiency during ATP synthesis. (a) The coupling efficiency of forcible rotation with ATP release in the absence of the ε subunit. The gray lines represent the results of numerical calculation based on koffATP(θ) = 0.12 × exp(−0.043·θ) determined for F1ε in Fig. 3d at θoff = 120° (light gray), 140° (gray), and 160° (thick gray). The gray circle represents the net coupling efficiency of F1ε during ATP synthesis, as experimentally determined in the previous study (31). (b) The coupling efficiency of forcible rotation with ATP release in the presence of the ε subunit. The colored lines represent the results of numerical calculation based on koffATP(θ) = 0.58 × exp(−0.042·θ) determined for F1+ε in Fig. 3 d at θoff = 120° (orange), 140° (pink), and 160° (red). The red circle represents the net coupling efficiency of F1+ε as determined in the previous study (31). w/o, without; w/, with. To see this figure in color, go online.

Similar articles

Cited by

References

    1. Yoshida M., Muneyuki E., Hisabori T. ATP synthase--a marvellous rotary engine of the cell. Nat. Rev. Mol. Cell Biol. 2001;2:669–677. - PubMed
    1. Junge W., Sielaff H., Engelbrecht S. Torque generation and elastic power transmission in the rotary F(O)F(1)-ATPase. Nature. 2009;459:364–370. - PubMed
    1. Weber J. Structural biology: toward the ATP synthase mechanism. Nat. Chem. Biol. 2010;6:794–795. - PubMed
    1. Noji H., Ueno H., McMillan D.G.G. Catalytic robustness and torque generation of the F1-ATPase. Biophys. Rev. 2017;9:103–118. - PMC - PubMed
    1. Mukherjee S., Warshel A. The FOF1 ATP synthase: from atomistic three-dimensional structure to the rotary-chemical function. Photosynth. Res. 2017;134:1–15. - PMC - PubMed

Publication types

MeSH terms

LinkOut - more resources