. 2018 Jan 9;27(1):180-194.e6.
doi: 10.1016/j.cmet.2017.12.005.

Repression of Adipose Tissue Fibrosis through a PRDM16-GTF2IRD1 Complex Improves Systemic Glucose Homeostasis

Affiliations

Repression of Adipose Tissue Fibrosis through a PRDM16-GTF2IRD1 Complex Improves Systemic Glucose Homeostasis

Yutaka Hasegawa et al. Cell Metab. .

Abstract

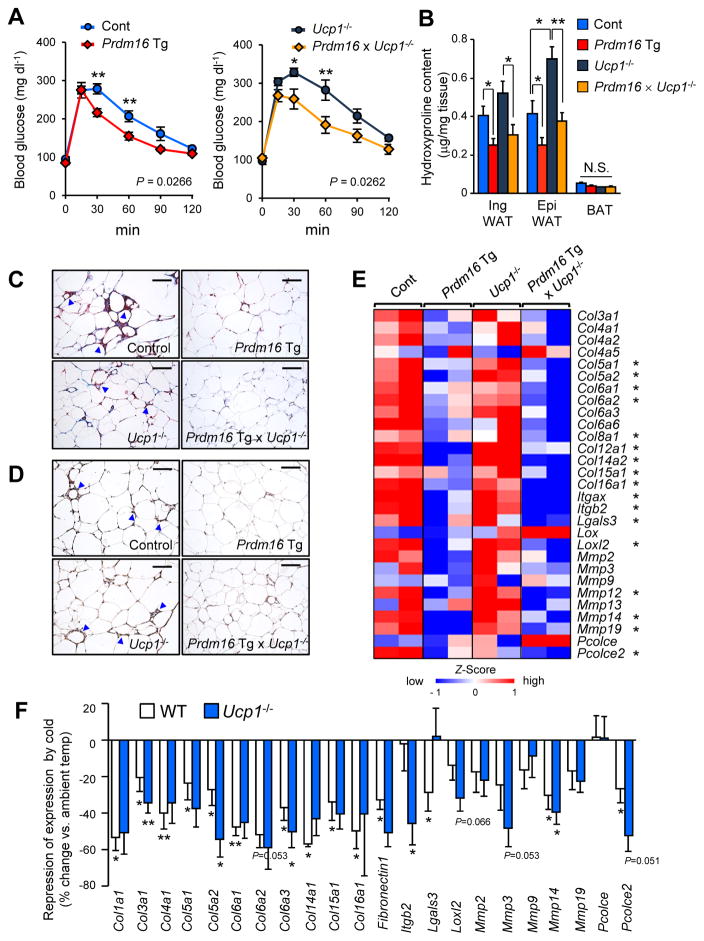
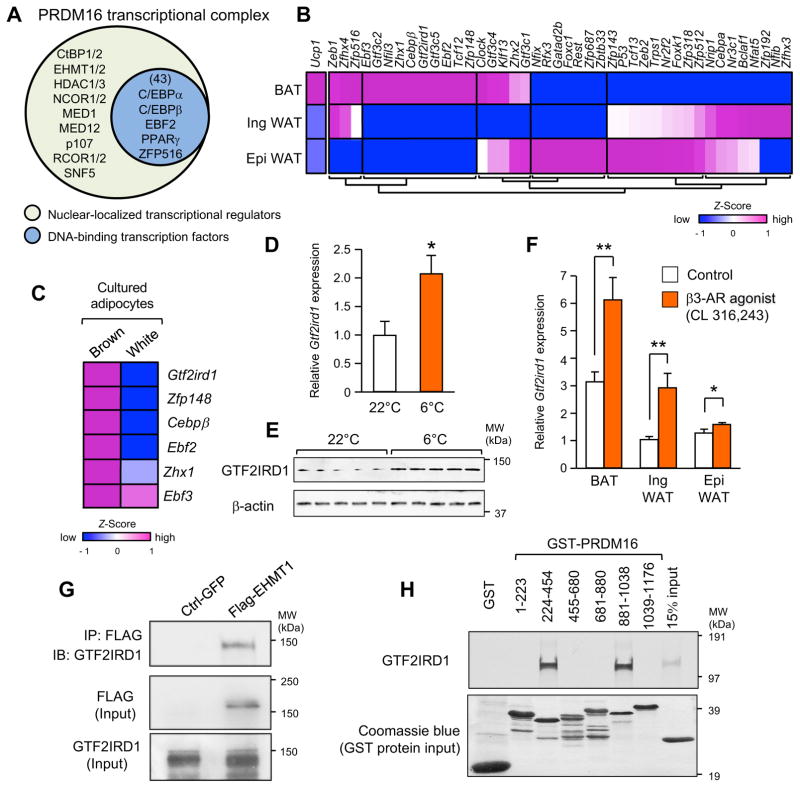
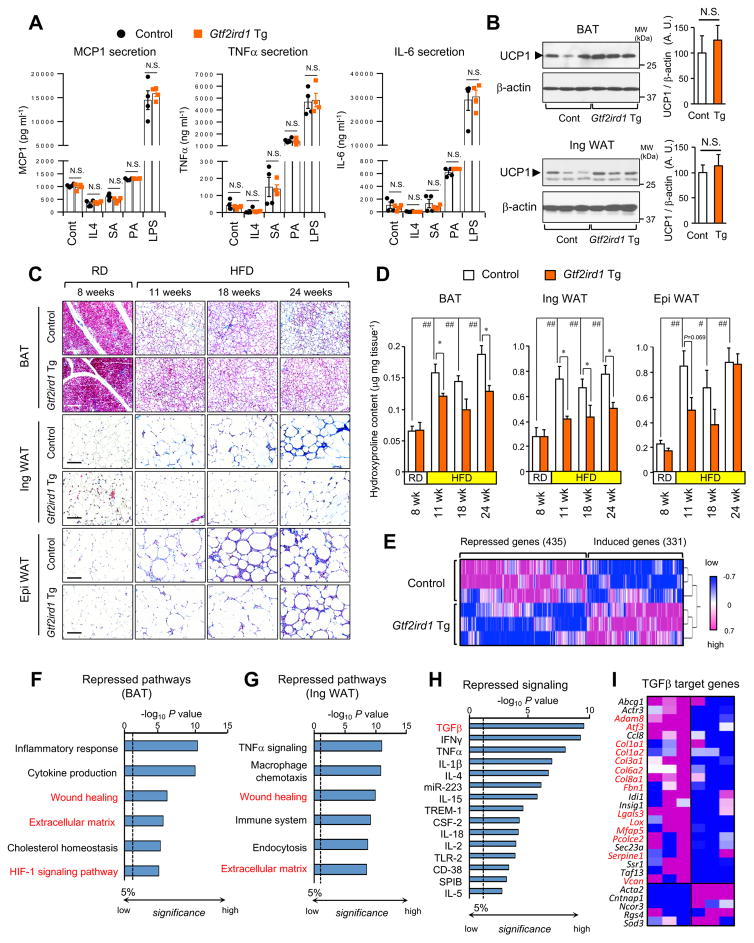
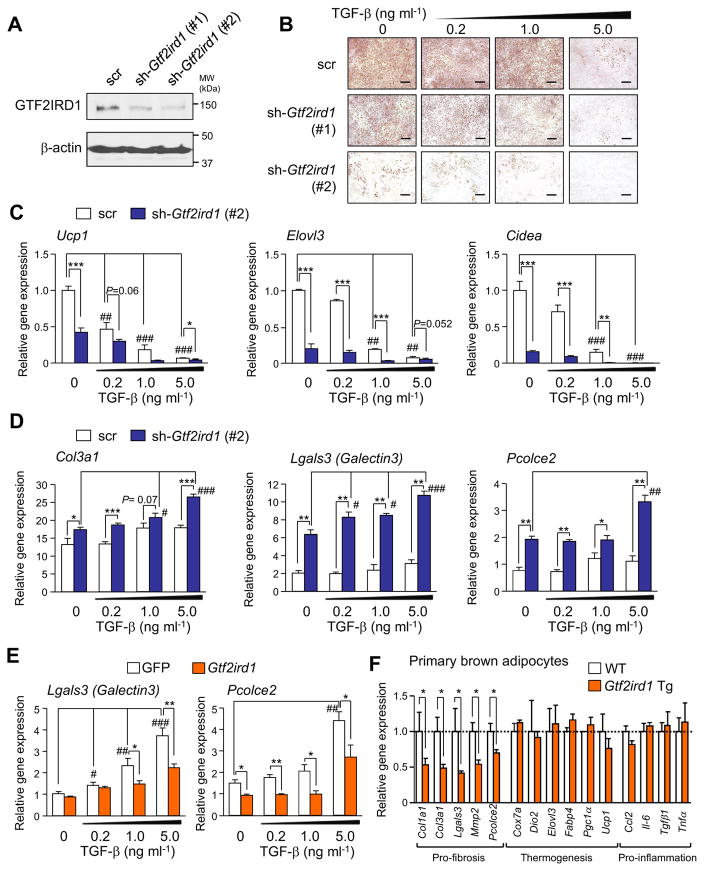
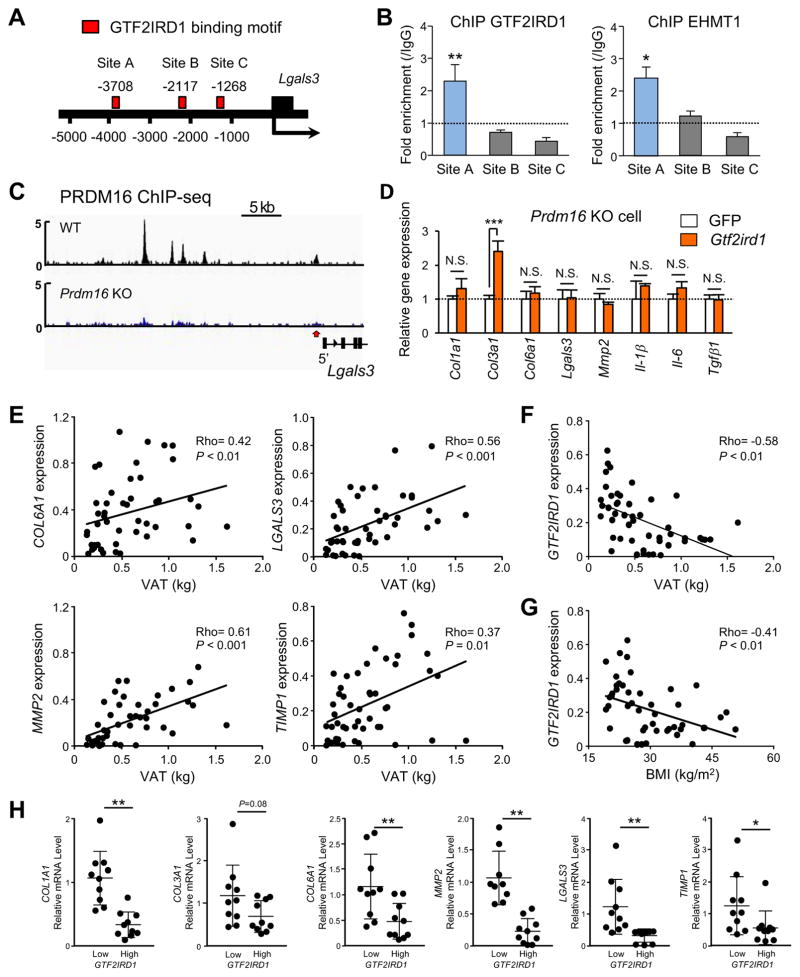
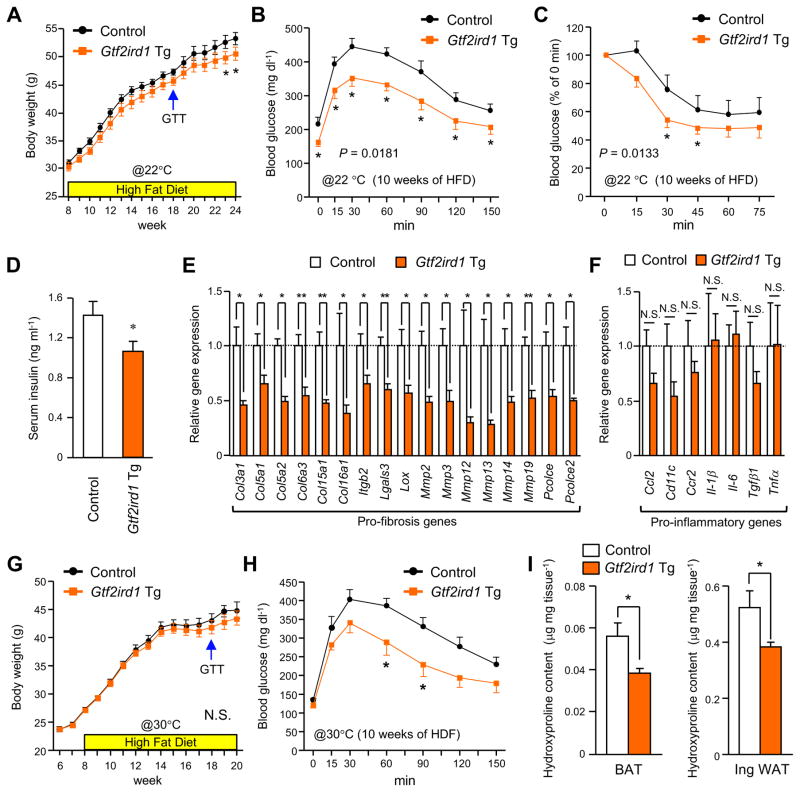
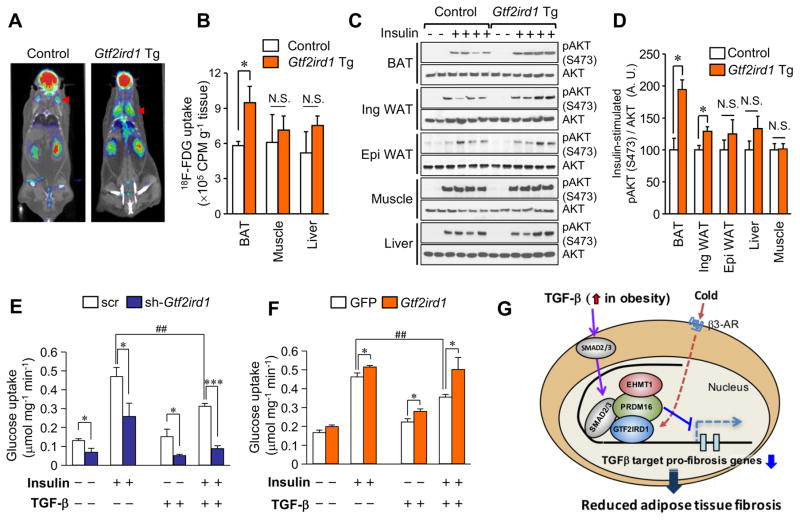
Adipose tissue fibrosis is a hallmark of malfunction that is linked to insulin resistance and type 2 diabetes; however, what regulates this process remains unclear. Here we show that the PRDM16 transcriptional complex, a dominant activator of brown/beige adipocyte development, potently represses adipose tissue fibrosis in an uncoupling protein 1 (UCP1)-independent manner. By purifying the PRDM16 complex, we identified GTF2IRD1, a member of the TFII-I family of DNA-binding proteins, as a cold-inducible transcription factor that mediates the repressive action of the PRDM16 complex on fibrosis. Adipocyte-selective expression of GTF2IRD1 represses adipose tissue fibrosis and improves systemic glucose homeostasis independent of body-weight loss, while deleting GTF2IRD1 promotes fibrosis in a cell-autonomous manner. GTF2IRD1 represses the transcription of transforming growth factor β-dependent pro-fibrosis genes by recruiting PRDM16 and EHMT1 onto their promoter/enhancer regions. These results suggest a mechanism by which repression of obesity-associated adipose tissue fibrosis through the PRDM16 complex leads to an improvement in systemic glucose homeostasis.

Keywords: EHMT1; GTF2IRD1; PRDM16; UCP1-independent; adipose tissue fibrosis; beige adipocyte; brown adipose tissue; diabetes; insulin resistance; obesity.


Figures

Figure 1
Figure 1. UCP1 independent regulation of adipose fibrosis by PRDM16
(A) Glucose tolerance test in Prdm16 Tg mice and the littermate controls (left) and in Ucp1−/−mice and Prdm16 Tg x Ucp1−/−mice (right) at 22°C. Mice were under HFD for 10 weeks. n= 7–8. * P<0.05, ** P<0.01. (B) Hydroxyproline content in the BAT, the inguinal WAT and the epididymal WAT of mice with indicated genotypes under HFD for 14 weeks. n=6–10. (C) Masson’s trichrome staining in the epididymal WAT of mice with indicated genotypes under HFD. Arrowheads indicate crown-like structures. Scale bars = 100 μm. (D) Immunohistochemical staining with anti-mouse endotrophin antibody in the epididymal WAT of mice in (C). Arrowheads indicate crown-like structures. Scale bars = 100 μm. (E) Expression profiles of pro-fibrotic genes (as indicated) in the inguinal WAT of mice with indicated genotypes under HFD for 14 weeks. The color scale shows z-scored FPKM representing the mRNA level of each gene in blue (low expression)-white-red (high expression) scheme. * P<0.05 by transgenic PRDM16 expression both in wild-type background and Ucp1−/− background. (F) Cold-induced changes in gene expression of pro-fibrosis genes (% change relative to ambient temperature) in the inguinal WAT from wild-type (white) and Ucp1−/− mice (blue). Mice under 14 weeks of HFD were kept under ambient temperature or mild cold temperature at 16°C for 10 days. n=4–6. Data in A, B, and F are represented as mean ± SEM.
Figure 2
Figure 2. GTF2IRD1 is a cold-inducible transcription factor that forms a complex with PRDM16 and EHMT1 in the BAT
(A) Identification of nuclear-localized components in a PRDM16 transcriptional complex purified from differentiated beige adipocytes. Nuclear localized proteins and canonical DNA-binding transcription factors were listed based on the annotation database in UniProt. (B) Gene expression profile of the identified transcriptional factors in interscapular BAT, inguinal WAT, and epididymal WAT. The color scale shows z-scored FPKM representing the mRNA level of each gene in blue (low expression)-white-red (high expression) scheme. (C) Gene expression profile of the BAT-enriched transcriptional factors in cultured primary brown adipocytes and white adipocytes. (D) Expression of Gtf2ird1 in BAT from mice housed at 22°C or 6°C for 3 days. n=5. (E) Immunoblotting for GTF2IRD1 protein from mice in (D). β-actin was used as loading control. (F) Expression of Gtf2ird1 mRNA in the indicated adipose tissues of mice treated with vehicle (saline) or CL316, 243 at a dose of 1 mg/kg for 7 days. n=5. * P<0.05, ** P<0.01, Data in D and F are represented as mean ± SEM. (G) A EHMT1 complex was immunopurified from differentiated brown adipocytes. Endogenous GTF2IRD1 was detected by immunoblotting. Inputs are shown in lower panels. (H) In vitro binding assay of 35S-labeled GTF2IRD1 and the indicated GST-fusion fragments of PRDM16. Coomassie brilliant blue for GST-proteins (bottom panel).
Figure 3
Figure 3. Adipose-selective expression of Gtf2ird1 represses adipose tissue fibrosis in vivo
(A) Concentration of MCP-1, TNF-a and IL-6 secreted from the macrophages from Gtf2ird1 Tg mice and the littermate control mice (control). The isolated macrophages were stimulated with IL4, stearic acid (SA), palmitic acid (PA), or lipopolysaccharide (LPS). n=4. (B) Immunoblotting for UCP1 in the BAT (upper panel) and the inguinal WAT (bottom panel) from Gtf2ird1 Tg mice and controls under ambient temperature. n=6–7. β-actin was used as loading control. Quantification of the UCP1 signal normalized by β-actin is shown on the right graphs. N.S., not significant. (C) Masson’s trichrome staining in the BAT, the WAT and the epididymal WAT from Gtf2ird1 Tg and controls under 8 weeks of RD or HDF for 11, 18, and 24 weeks. Scale bars = 100 μm. (D) Hydroxyproline content in the adipose tissues of mice in (C). * P<0.05 between Gtf2ird1 Tg mice and controls. # P<0.05, ## P<0.01 between RD and HFD. n= 5. Data in A, B, and D are represented as mean ± SEM. (E) Hierarchical clustering and heat-map of RNA-seq transcriptome in the BAT of control and Gtf2ird1 Tg mice. The color scale shows z-scored FPKM representing the mRNA level of each gene in blue (low expression)-white-red (high expression) scheme. (F) Repressed biological pathways in the BAT of Gtf2ird1 Tg mice and controls by Metascape. (G) Repressed biological pathways in the inguinal WAT of Gtf2ird1 Tg mice and controls by Metascape. (H) Ingenuity upstream analysis identified repressed signaling pathways in the BAT of Gtf2ird1 Tg mice. (I) Expression profiles of the TGF-β regulated genes in the BAT of control and Gtf2ird1 Tg mice. Genes with red letters represent pro-fibrosis genes.
Figure 4
Figure 4. GTF2IRD1 is required for the cell-autonomous capacity to regulate adipocyte fibrosis
(A) Immunoblotting of immortalized brown adipocytes expressing shRNAs for a scrambled control (scr) or GTF2IRD1 (sh-Gtf2ird1 #1 and #2). β-actin was used as loading control. (B) Oil-red-O staining of brown adipocytes expressing scr or sh-Gtf2ird1 cultured under an adipogenic condition medium containing TGF-β at 0.2, 1.0, or 5.0 ng ml−1. Scale bars, 200 μm. (C) Relative mRNA expression of the BAT-related genes by qRT-PCR. * P<0.05, ** P<0.01, *** P<0.001 between scrambled control and sh-Gtf2ird1. # P<0.05, ## P<0.01, ### P<0.001 between vehicle and TGF-β. n=4. (D) Relative mRNA expression of pro-fibrosis genes in (C). (E) Relative mRNA expression of pro-fibrosis genes in immortalized brown adipocytes expressing GFP control or GTF2IRD1. n=4. (F) Relative mRNA expression of pro-fibrosis genes, thermogenic genes, and pro-inflammatory genes in primary brown adipocytes derived from Gtf2ird1 Tg mice and control mice. Cells were treated with TGF-β to induce fibrosis. n=4. Data in D–F are represented as mean ± SEM.
Figure 5
Figure 5. Regulatory mechanisms of adipose fibrosis by GTF2IRD1
(A) Location of GTF2IRD1 binding motifs at the promoter/enhancer regions of Lgals3 (Site A–C). (B) ChIP assays in brown adipocytes using specific antibodies against GTF2IRD1 and EHMT1. Fold enrichment at each GTF2IRD1 binding motif site in (A) was assessed by qPCR compared to IgG control. n=3. * P<0.05, ** P<0.01. (C) Enrichment of PRDM16 on the Lgals3 gene in BAT of wild-type and Prdm16−/− (KO) mice. The dataset was obtained from the dataset in (Harms et al., 2015). (D) Relative mRNA expression of pro-fibrosis and pro-inflammatory genes in Prdm16 KO adipocytes expressing GFP or GTF2IRD1. Cells were treated with TGF-β to induce fibrosis. n=4. Data in B and D are represented as mean ± SEM. (E) Relative mRNA levels of pro-fibrotic genes in the abdominal subcutaneous WAT of adult human subjects (ages 25–65 years) drawn from the UCSF IDEO cohort. n=48. To ensure an ethnically mixed population of lean and obese people, the random sample included 22 Caucasian (12 obese and 10 lean) and 26 Chinese (15 obese and 11 lean) subjects. Visceral adipose tissue (VAT) mass was measured by DEXA. (F) Correlation between GTF2IRD1 mRNA levels in the subcutaneous WAT and VAT mass. n=48. (G) Correlation between GTF2IRD1 mRNA levels in the subcutaneous WAT and BMI. (H) Relative mRNA levels of indicated pro-fibrotic genes comparing the groups drawn from individuals with the lowest and highest expression of GTF2IRD1 in the subcutaneous WAT. n=10 per group. Data are presented as means ± SD.
Figure 6
Figure 6. GTF2IRD1-mediated repression of adipose fibrosis is associated with improved systemic glucose homeostasis independent of body-weight
(A) Body-weight gain of Gtf2ird1 Tg mice and the littermate controls (control) under HFD at 22°C. n=15. * P<0.05. (B) GTT in Gtf2ird1 Tg mice and controls after 10 weeks of HFD at 22°C. n=6–7. (C) ITT in Gtf2ird1 Tg mice and controls after 10 weeks of HFD at 22°C. n=6–7. (D) Serum concentrations of fasting insulin in Gtf2ird1 Tg mice and controls after 11 weeks of HFD. n=6–8. (E) Relative mRNA expression of pro-fibrosis genes in the inguinal WAT of Gtf2ird1 Tg mice and controls after 11 weeks of HFD. n=6. * P<0.05, ** P<0.01. (F) Relative mRNA expression of pro-inflammatory genes in the inguinal WAT of Gtf2ird1 Tg mice and controls after 11 weeks of HFD. n=6. (G) Body-weight gain of Gtf2ird1 Tg mice and controls under HFD under thermoneutrality (30°C). n=9–15. (H) GTT in Gtf2ird1 Tg mice and controls after 10 weeks of HFD under thermoneutrality. n=6–7. (I) Hydroxyproline content in the BAT (left) and the inguinal WAT (right) from Gtf2ird1 Tg mice and controls after 12 weeks of HFD under thermoneutrality. n=6–7. All the data are presented as means ± SEM.
Figure 7
Figure 7. Repression of adipose fibrosis by GTF2IRD1 improves BAT glucose uptake
(A) 18F-fluor-deoxyglucose (FDG) uptake was measured by 18FDG-PET/CT scan under ambient temperature. Representative images of control and Gtf2ird1 Tg mice at 13 weeks of HFD are shown. n=5. (B) Quantification of 18F-FDG uptake in the indicated organs in (A). * P<0.05. (C) Immunoblotting for phosphorylated (S473) and total AKT in the indicated tissues from Gtf2ird1 Tg mice and the littermate controls. Mice were treated with saline or insulin before tissue harvest. (D) Quantification of the insulin signaling assay in (C). n=4. (E) Glucose uptake in differentiated brown adipocytes expressing scrambled control (scr) or sh-Gtf2ird1 (#2). Cells were treated with insulin (100 nM) and/or TGF-β (5 ng ml−1). * P<0.05, *** P<0.001 between scrambled control and sh-Gtf2ird1. ##P<0.01 between vehicle and TGF-β. n=6. (F) Glucose uptake in differentiated brown adipocytes expressing GFP or GTF2IRD1. Cells were treated with insulin (100 nM) and/or TGF-β (5 ng ml−1). * P<0.05 between GFP and GTF2IRD1. ##P<0.01 between vehicle and TGF-β. n=6. Data are presented as means ± SEM. (G) A proposed mechanism by which GTF2IRD1 controls adipose tissue fibrosis. See text for detail.

Similar articles

Cited by

References

    1. Chimge NO, Makeyev AV, Ruddle FH, Bayarsaihan D. Identification of the TFII-I family target genes in the vertebrate genome. Proceedings of the National Academy of Sciences of the United States of America. 2008;105:9006–9010. - PMC - PubMed
    1. Chondronikola M, Volpi E, Borsheim E, Porter C, Annamalai P, Enerback S, Lidell ME, Saraf MK, Labbe SM, Hurren NM, et al. Brown adipose tissue improves whole-body glucose homeostasis and insulin sensitivity in humans. Diabetes. 2014;63:4089–4099. - PMC - PubMed
    1. Choy L, Derynck R. Transforming growth factor-beta inhibits adipocyte differentiation by Smad3 interacting with CCAAT/enhancer-binding protein (C/EBP) and repressing C/EBP transactivation function. The Journal of biological chemistry. 2003;278:9609–9619. - PubMed
    1. Cohen P, Levy JD, Zhang Y, Frontini A, Kolodin DP, Svensson KJ, Lo JC, Zeng X, Ye L, Khandekar MJ, et al. Ablation of PRDM16 and Beige Adipose Causes Metabolic Dysfunction and a Subcutaneous to Visceral Fat Switch. Cell. 2014;156:304–316. - PMC - PubMed
    1. Crewe C, An YA, Scherer PE. The ominous triad of adipose tissue dysfunction: inflammation, fibrosis, and impaired angiogenesis. The Journal of clinical investigation. 2017;127:74–82. - PMC - PubMed

Publication types

MeSH terms