. 2018 Jan 9;22(2):359-371.
doi: 10.1016/j.celrep.2017.12.041.

DNA Unwinding Is the Primary Determinant of CRISPR-Cas9 Activity

Affiliations

DNA Unwinding Is the Primary Determinant of CRISPR-Cas9 Activity

Shanzhong Gong et al. Cell Rep. .

Abstract

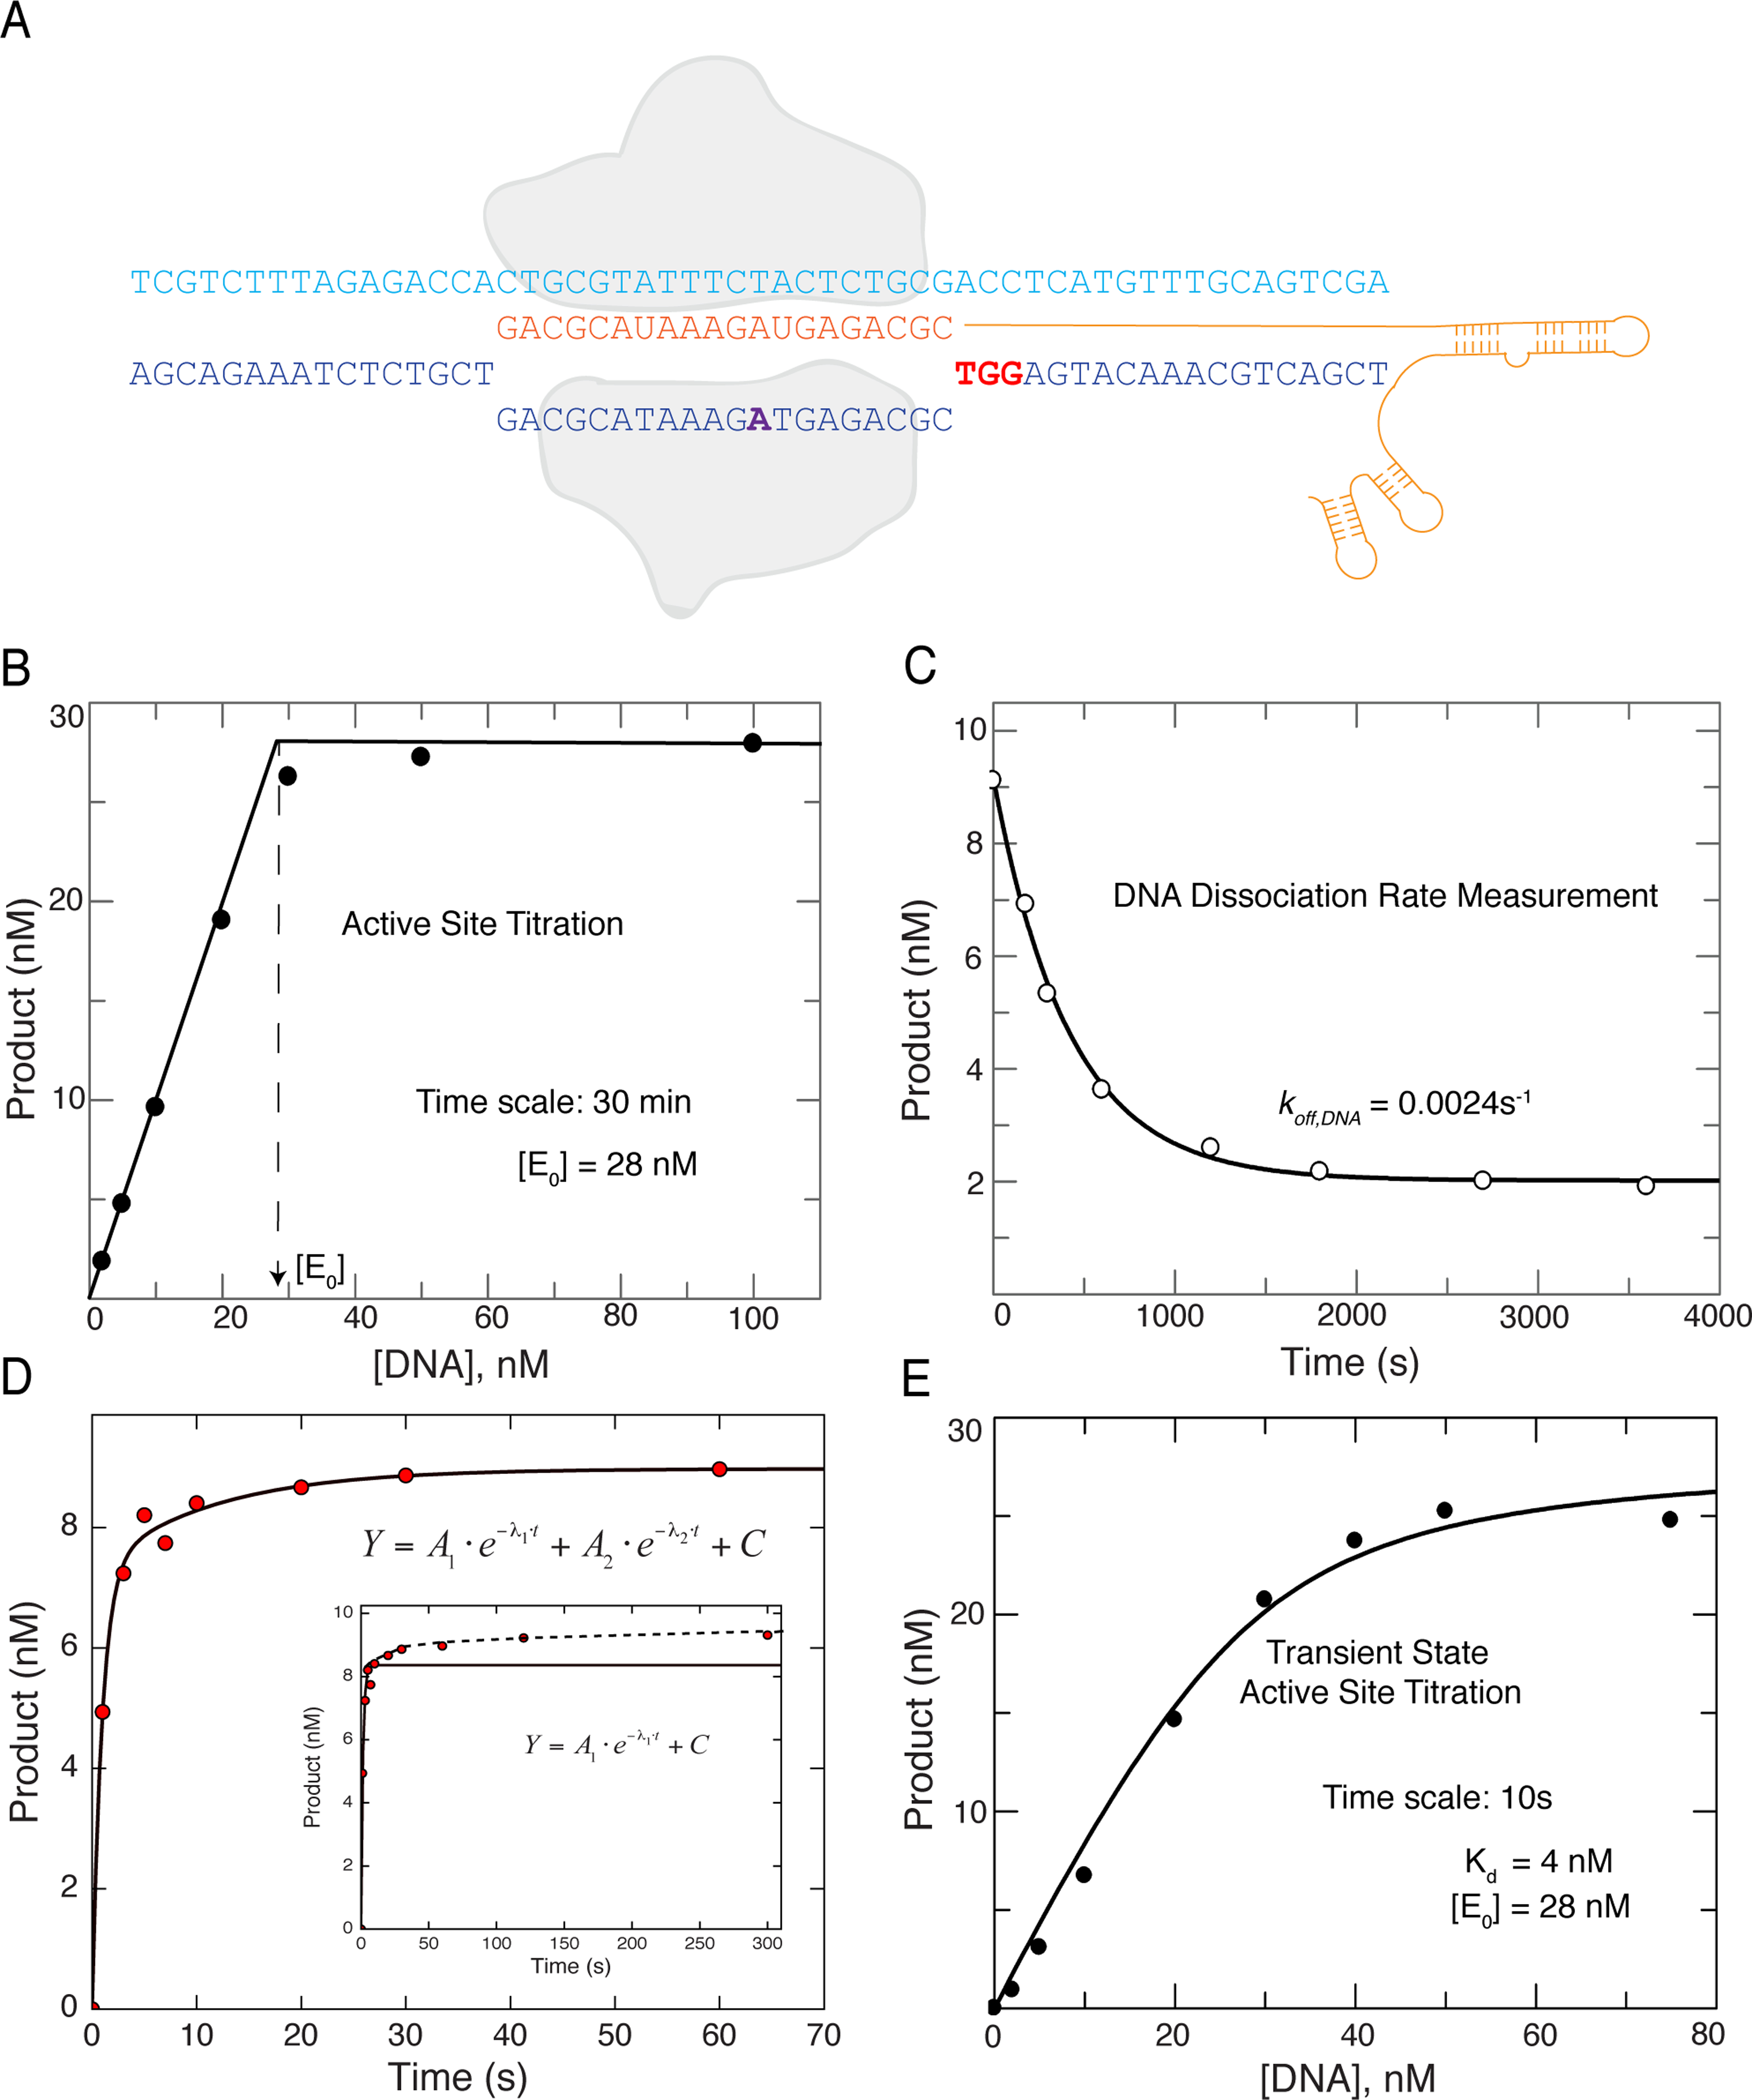
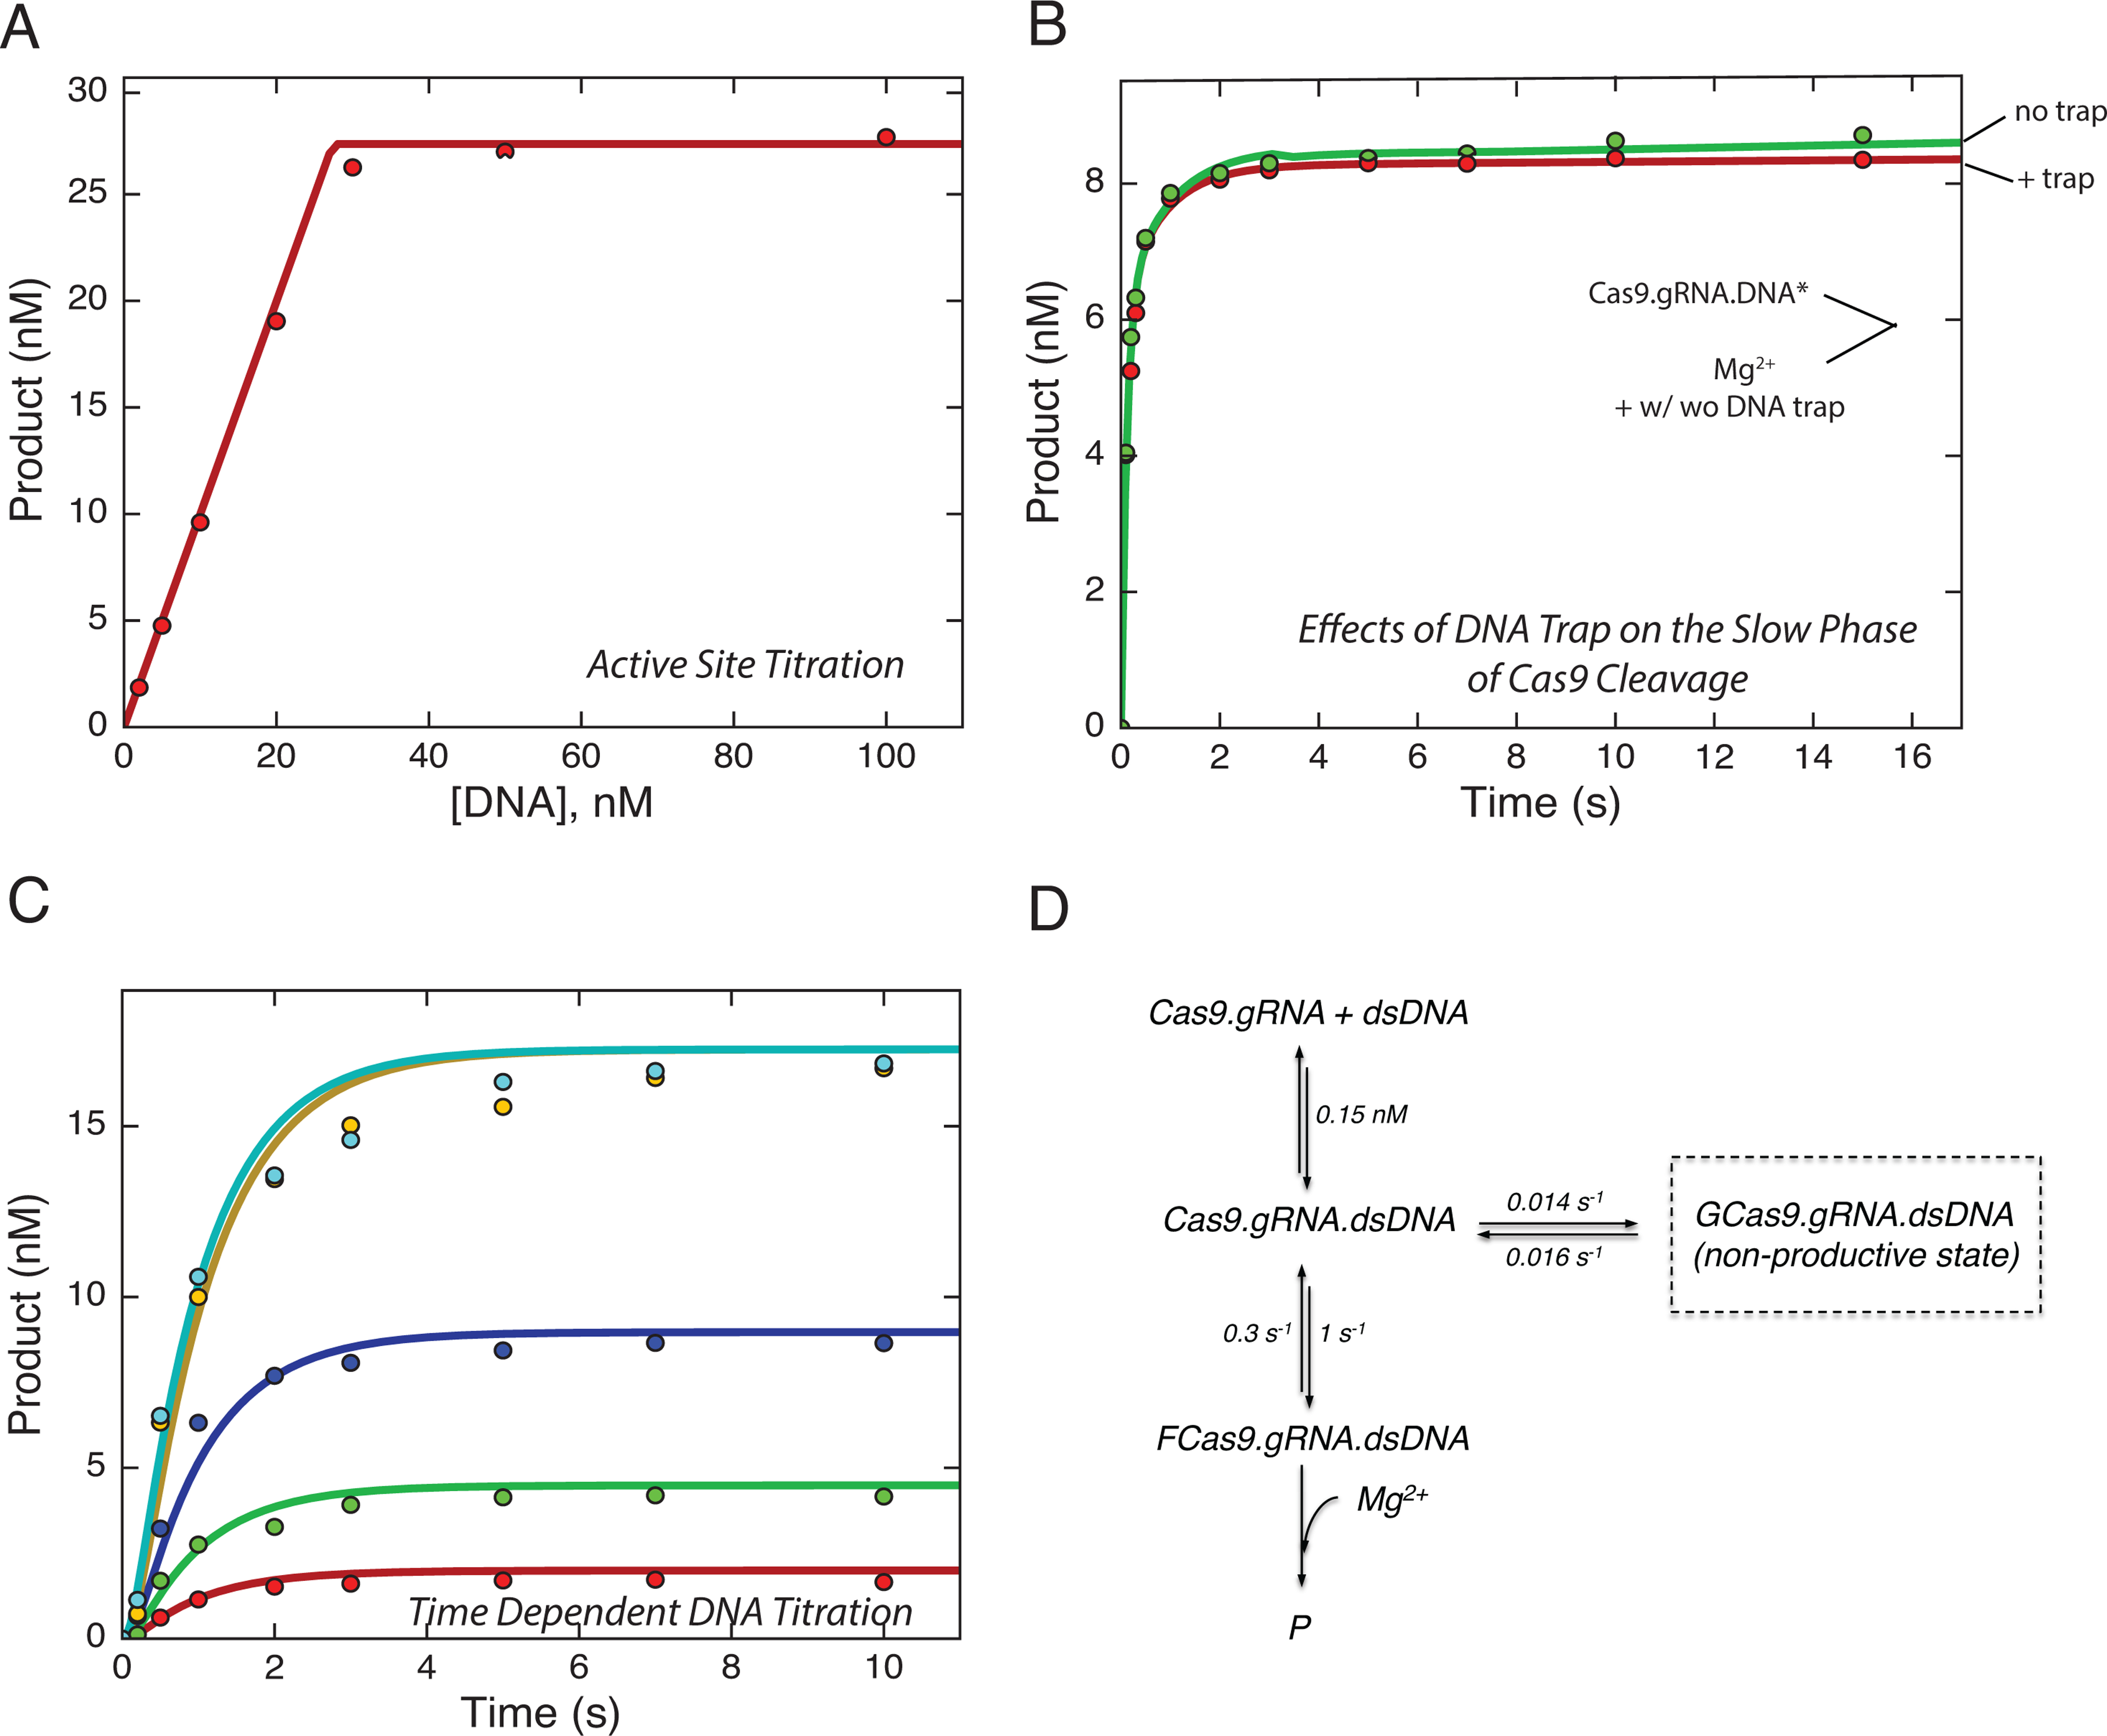
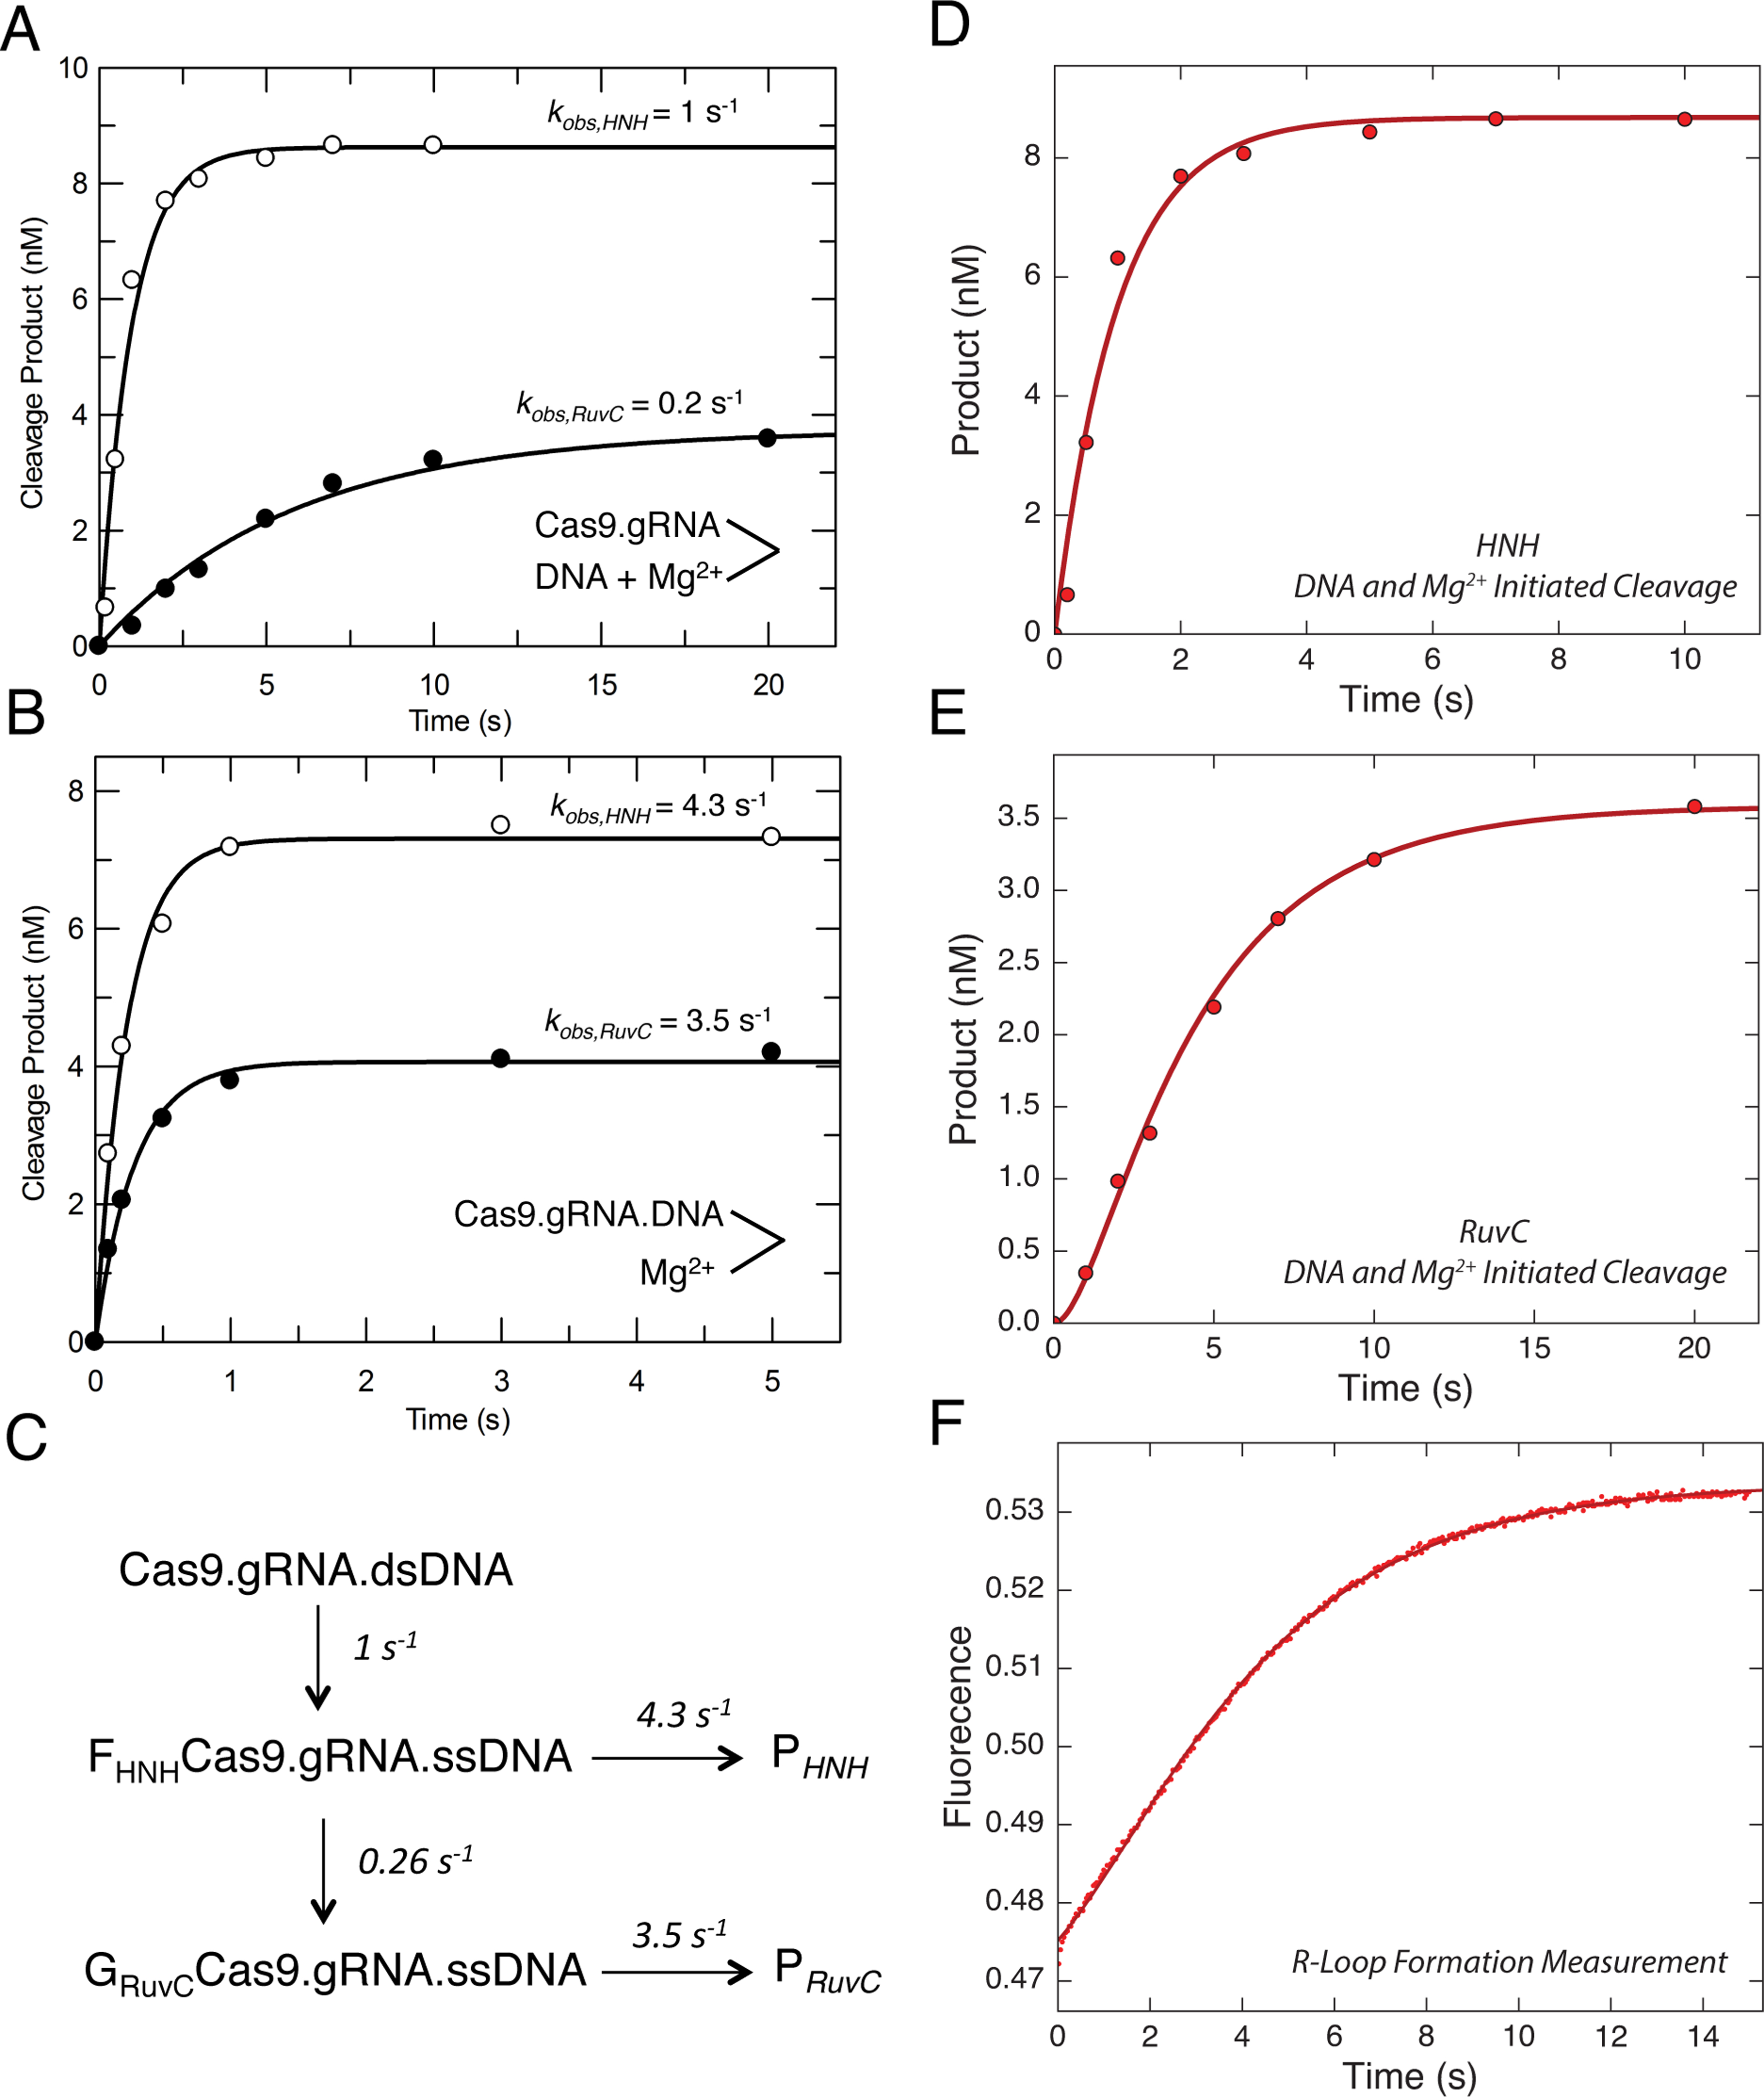
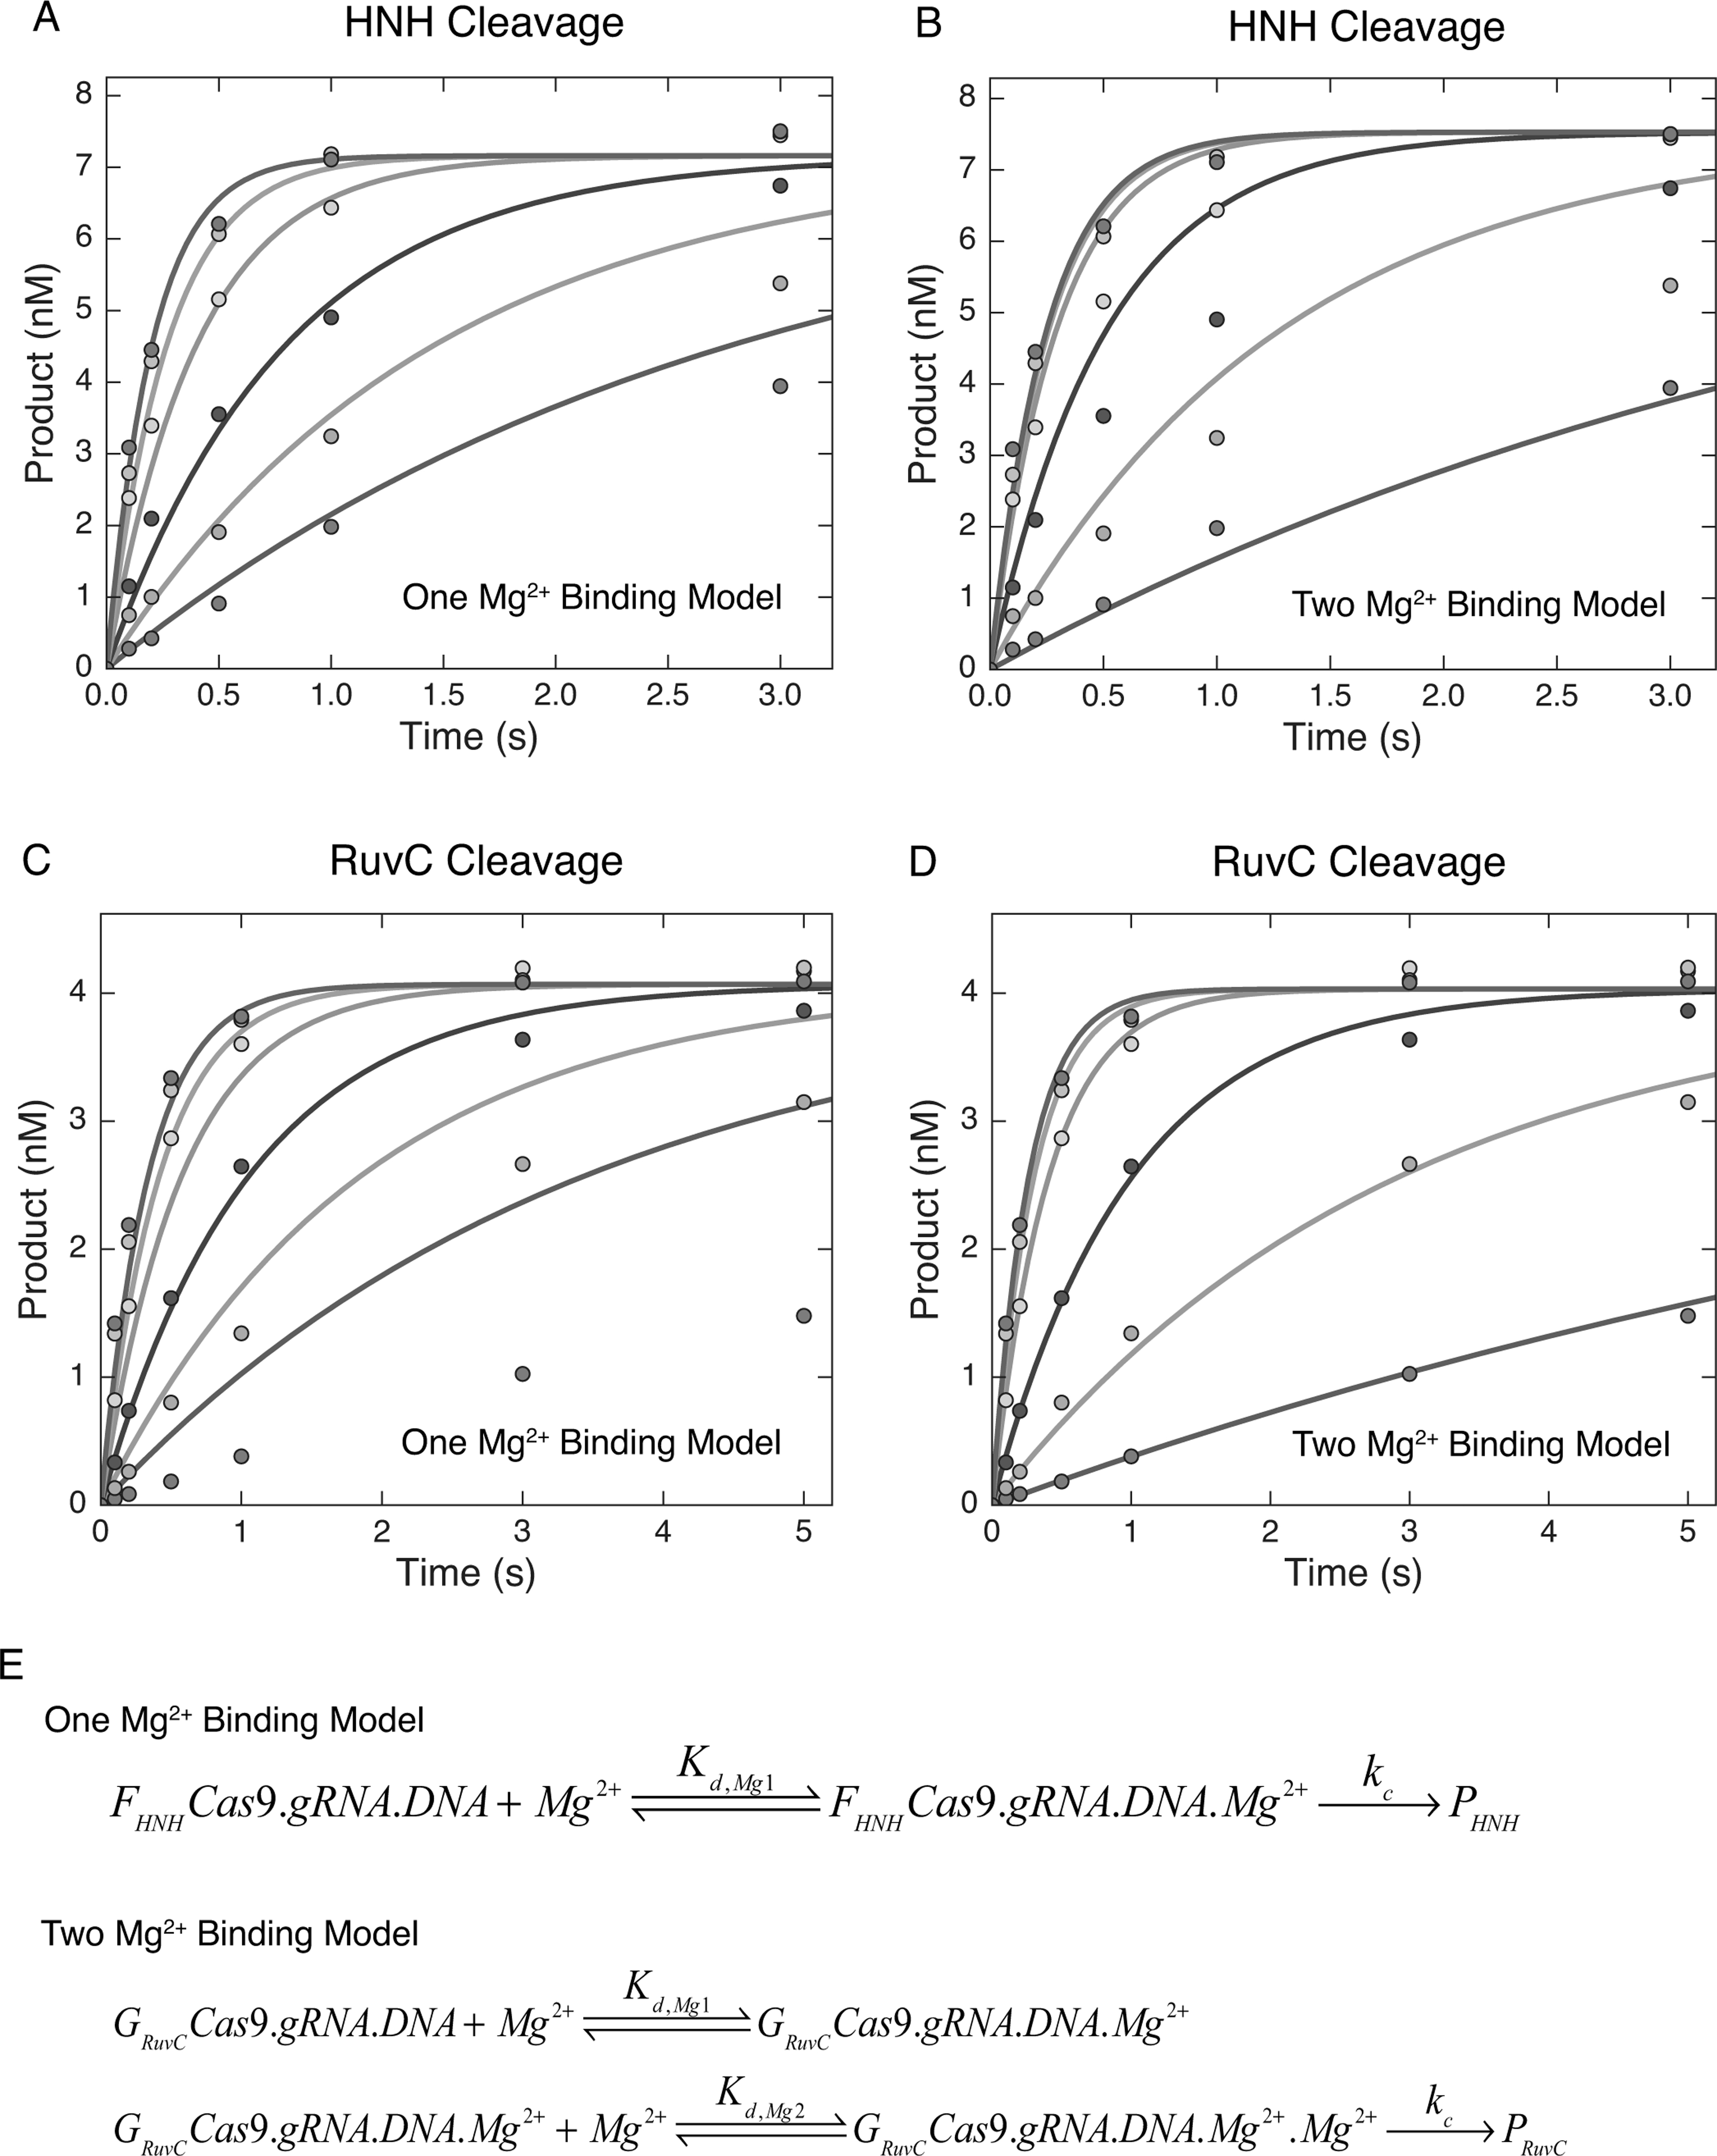
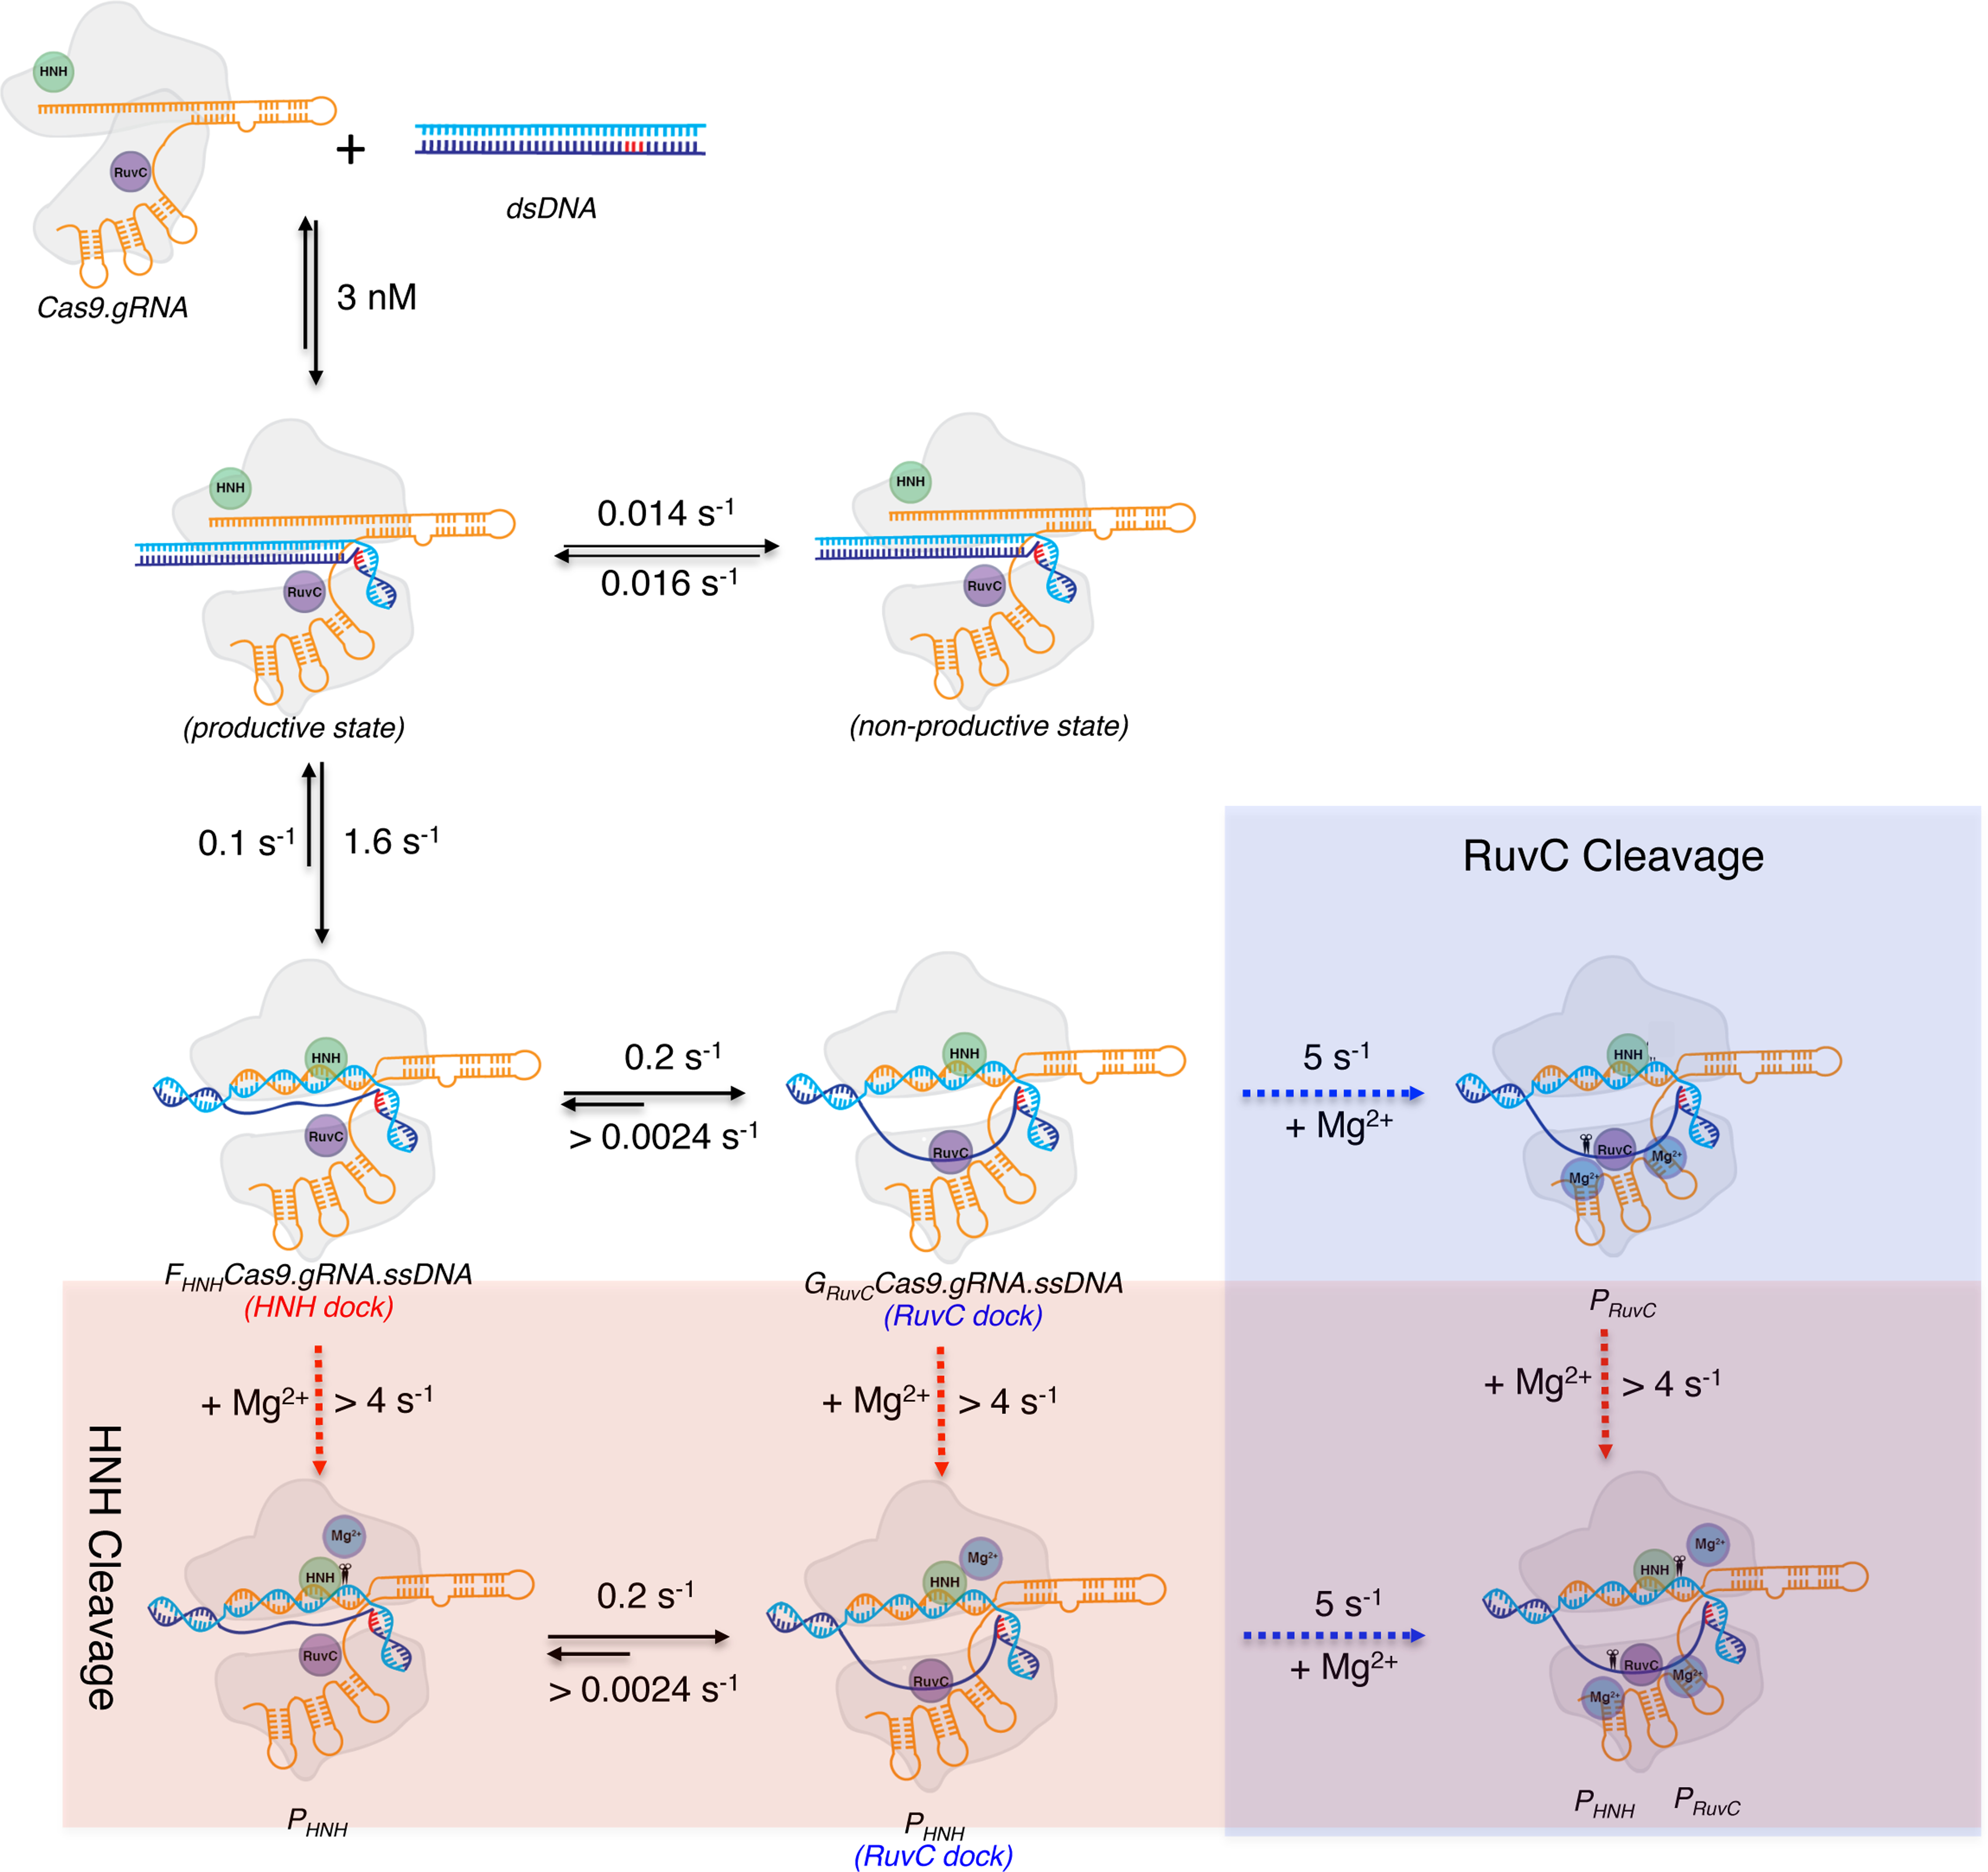
Bacterial adaptive immunity utilizes RNA-guided surveillance complexes comprising Cas proteins together with CRISPR RNAs (crRNAs) to target foreign nucleic acids for destruction. Cas9, a type II CRISPR-Cas effector complex, can be programed with a single-guide RNA that base pairs with the target strand of dsDNA, displacing the non-target strand to create an R-loop, where the HNH and the RuvC nuclease domains cleave opposing strands. While many structural and biochemical studies have shed light on the mechanism of Cas9 cleavage, a clear unifying model has yet to emerge. Our detailed kinetic characterization of the enzyme reveals that DNA binding is reversible, and R-loop formation is rate-limiting, occurring in two steps, one for each of the nuclease domains. The specificity constant for cleavage is determined through an induced-fit mechanism as the product of the equilibrium binding affinity for DNA and the rate of R-loop formation.

Keywords: CRISPR; Cas9; DNA cleavage; R-loop; kinetics; sgRNA.


Figures

Figure 1.
Figure 1.. Cas9 is a single turnover enzyme that binds cleaved DNA products tightly.
(A) Schematic of Cas9.gRNA and DNA target used in this study. The cartoon is color coded as follows: Cas9, outlined in light grey; sgRNA, orange; target strand, light blue; non-target strand, dark blue; PAM, red; and 2AP site, purple. (B) Active site titration experiment was performed by mixing a fixed concentration (100 nM) of Cas9.gRNA (1:1 ratio) with variable concentrations of a perfectly matched γ32P labeled DNA target. By allowing the reaction to reach completion (30 min), the results reveal the active site concentration of Cas9.gRNA. The two dotted lines indicate the nearly irreversible binding curve; and vertical dotted arrow indicates the active site concentration of Cas9.gRNA. (C) The DNA dissociation rate was measured by premixing γ32P labeled perfectly matched target DNA (10 nM) and Cas9.gRNA (28 nM active site concentration) for 10 min in the absence of Mg2+ followed by addition of a large excess of unlabeled DNA trap (200 nM) for various incubation times (0, 1, 5, 10, 20, 30, 45, 60, 90 and 120 min), after which the chemical reaction was initiated by addition of 10 mM free Mg2+, and then quenched after 30s by the addition of EDTA. The amount of product formed versus time was fit to a single exponential decay equation to obtain the dissociation rate of DNA (koff,DNA=0.0024s1). (D) Time course Cas9 cleavage assay performed by directly mixing γ32P labeled DNA (10 nM) and Cas9.gRNA (28 nM active site concentration) in the presence of 10 mM Mg2+. Samples were then collected at different time points by stopping the reaction by adding EDTA. The concentration of product formed was fit to double exponential to account for the lower amplitude slow phase. A single exponential fit is shown in the inset. (E) The experiment in (B) was repeated but the DNA and enzyme were allowed to come to equilibrium prior to addition of Mg2+. DNA concentration dependence of the amount of product formed after 10s provided an active site titration to define the Kdfor DNA binding (4 nM) as well as the active site enzyme concentration (28 nM). See also Figure S1.
Figure 2.
Figure 2.. Cas9.gRNA exists in both a productive and a minor nonproductive state for cleavage.
(A) Effects of DNA trap on the slow phase of Cas9 cleavage was tested by premixing γ32P labeled DNA (10 nM) and Cas9.gRNA (28 nM active site concentration) in the absence of Mg2+. The experiment was initiated by addition of 10 mM free Mg2+ in the presence and absence of DNA trap (200 nM unlabeled DNA substrate). (B) A time-dependence or reaction at various concentrations of DNA; the experiment was performed by mixing fixed a concentration of Cas9.gRNA (17.3 nM active site concentration) with variable concentrations of γ32P labeled DNA (2, 5, 10, 20, 40 nM). Then, the reaction was quenched at varying time points by the addition of 0.5 M EDTA and the amount of product (HNH cleavage) was quantified. (C) Active site titration experiment as shown in Figure 1A. (D) The smooth lines in each of the above figures were derived from globally fitting to this model. See also Figure S2 and S3.
Figure 3.
Figure 3.. R-Loop formation is the rate-limiting step.
(A) Cas9 cleavage rates were measured after the reaction was initiated by the simultaneous addition of DNA (10 nM) and Mg2+ (10 nM) to Cas9.gRNA (28 nM active site concentration). The reaction was quenched by the addition of EDTA at different time points, and then the results were fit to a single exponential equation. DNA was either labeled on the target strand or the nontarget strand to obtain the cleavage rates from HNH (open symbols) and RuvC (closed symbols) nuclease activities, respectively. (B) HNH and RuvC cleavage rates measured after initiating the reaction by the addition of Mg2+ (10 nm) to a mixture of Cas9.gRNA (28 nM) with DNA (10 nm) pre-incubated for 10 min. Aside from the order of mixing, the experiment was performed and analyzed as in A. (C) Model showing the kinetics of two isomerization steps preceding HNH and RuvC cleavage. This model was derived in fitting Figure D, E and F simultaneously. The global fitting of all three experiments provides an accurate estimation for the rate constants for R loop formation and subsequent cleavage reactions. (D) Time dependence of HNH cleavage measured as in A. (E) Time dependence of RuvC cleavage, measured as in A. (F) R-loop formation was measured by mixing Cas9.gRNA (500 nM) with DNA with a 2AP label at position −9 on the non-target strand (100 nM) using stopped flow fluorescence method (Auto SF 120x, KinTek Corporation, Austin, TX.). The fluorescence increase as a function of time was biphasic defining two steps in R loop formation. The experiments including cleavage initiated by the simultaneous addition of DNA and Mg2+ for both HNH and RuvC cleavage were globally fit with the R loop formation measurement using the model shown in C. See also Figure S4 and Table S1.
Figure 4.
Figure 4.. HNH and RuvC use one and two metal ion mechanisms, respectively.
(A) Mg2+-dependent HNH cleavage experiment performed by premixing Cas9.gRNA (27.6 nM active site) with γ32P labeled DNA (10 nM) in the absence of Mg2+ for 10 min. The reaction was initiated by addition of variable concentrations of free Mg2+ (0.5, 1, 2, 5, 10, 20 mM). The reaction was quenched by the addition of 0.5 M EDTA at different time points. The results were analyzed using a single Mg2+ ion binding model as shown in Figure 4E. (B) The same experiment performed in (A) analyzed using a two Mg2+ ion binding model as shown in Figure 4E. (C) Mg2+-dependent RuvC cleavage experiment performed as above analyzed using a one Mg2+ ion binding model. (D) The same experiment performed in (C) analyzed using a two Mg2+ ion binding model. (E) One Mg2+ binding model and two Mg2+ ion binding model. See also Figure S5.
Figure 5.
Figure 5.. A complete kinetic framework for CRISPR-Cas9 activity
Our model for the kinetic pathway of Cas9 cleavage depicted using cartoons. The rate constants for each individual step including DNA binding, R-loop formation, Mg2+ ion binding, and HNH and RuvC cleavage were obtained from our experiments. The cartoon is color coded as follows: Cas9, outlined in light grey; HNH domain, green circle; RuvC domain, purple circle; Mg2+ ions, blue circles; sgRNA, orange; target strand, light blue; non-target strand, dark blue; and PAM, red. Scissors indicate cleavage. The transparent blue region indicates RuvC cleavage and the transparent red region indicates HNH cleavage. See also Table S2.

References

    1. Amitai G. and Sorek R. (2016) ‘CRISPR-Cas adaptation: insights into the mechanism of action’, Nat Rev Microbiol, 14(2), pp. 67–76. - PubMed
    1. Anders C, Niewoehner O, Duerst A. and Jinek M. (2014) ‘Structural basis of PAM-dependent target DNA recognition by the Cas9 endonuclease’, Nature, 513(7519), pp. 569–73. - PMC - PubMed
    1. Ariyoshi M, Vassylyev DG, Iwasaki H, Nakamura H, Shinagawa H. and Morikawa K. (1994) ‘Atomic structure of the RuvC resolvase: a holliday junction-specific endonuclease from E. coli’, Cell, 78(6), pp. 1063–72. - PubMed
    1. Barrangou R, Fremaux C, Deveau H, Richards M, Boyaval P, Moineau S, Romero DA and Horvath P. (2007) ‘CRISPR provides acquired resistance against viruses in prokaryotes’, Science, 315(5819), pp. 1709–12. - PubMed
    1. Biertümpfel C, Yang W. and Suck D. (2007) ‘Crystal structure of T4 endonuclease VII resolving a Holliday junction’, Nature, 449(7162), pp. 616–20. - PubMed

Publication types