. 2018 Jan 9;22(2):441-455.
doi: 10.1016/j.celrep.2017.12.046.

Variation in Activity State, Axonal Projection, and Position Define the Transcriptional Identity of Individual Neocortical Projection Neurons

Affiliations

Variation in Activity State, Axonal Projection, and Position Define the Transcriptional Identity of Individual Neocortical Projection Neurons

Maxime Chevée et al. Cell Rep. .

Abstract

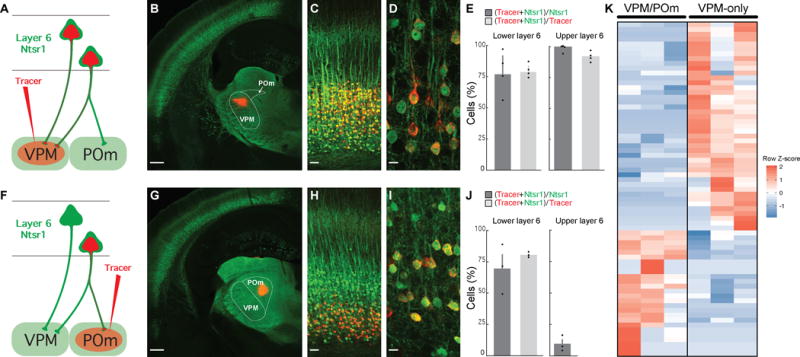
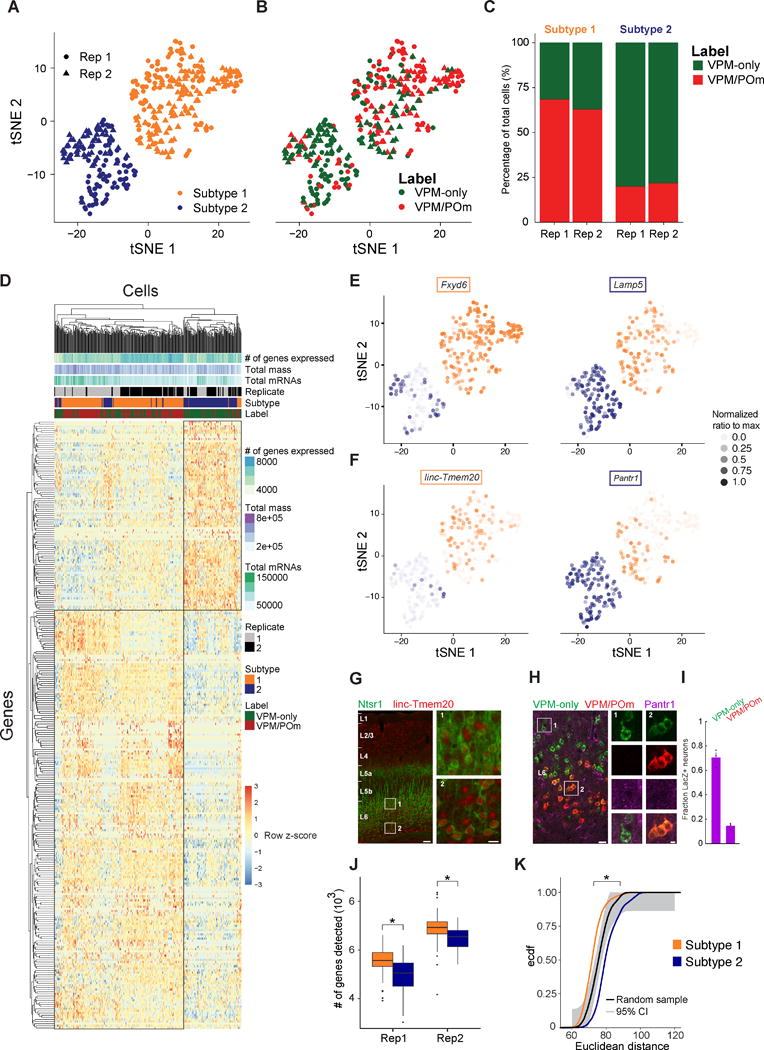
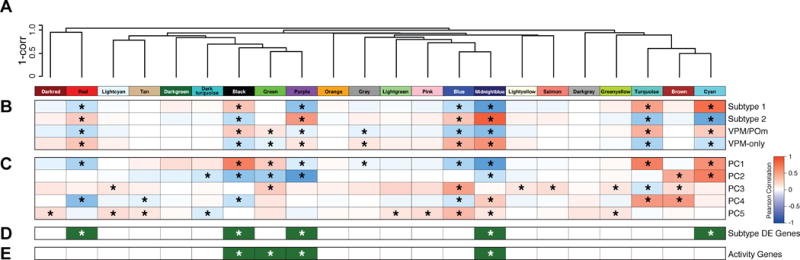
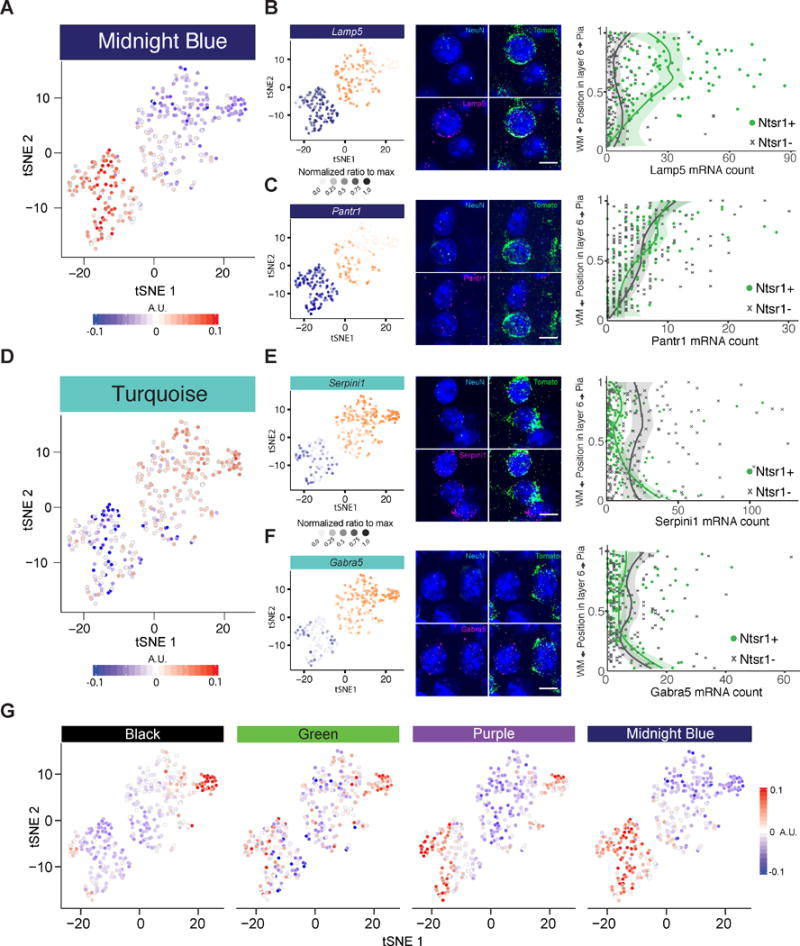
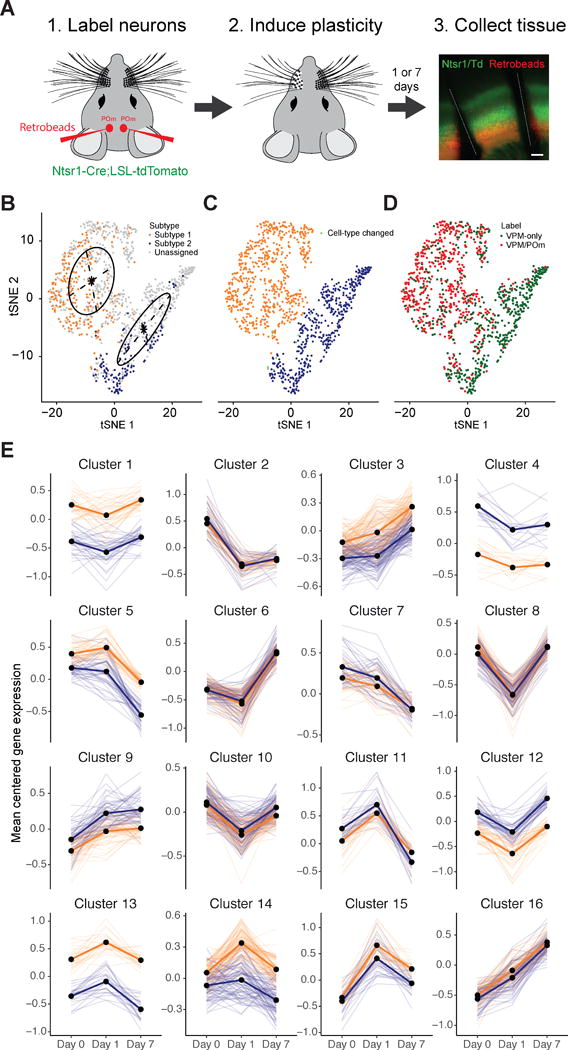
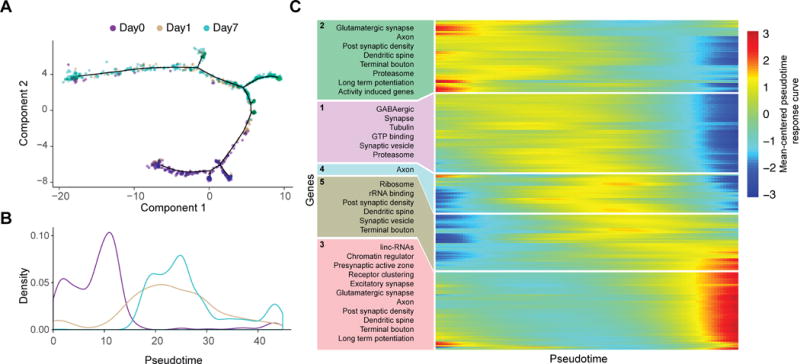
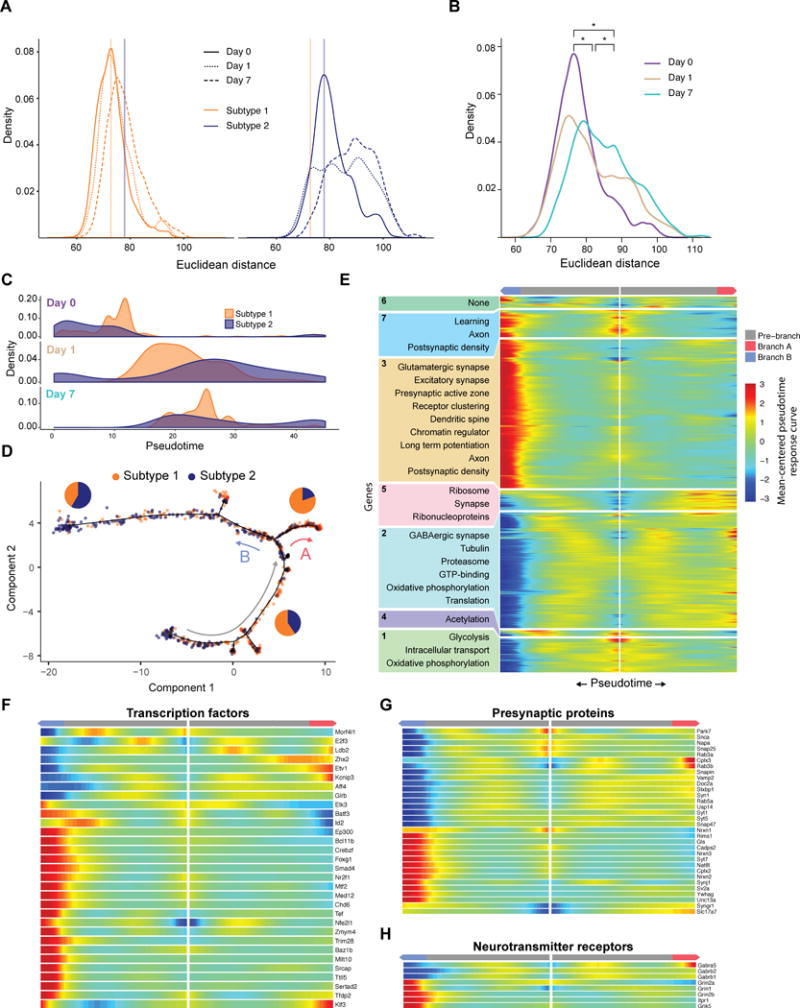
Single-cell RNA sequencing has generated catalogs of transcriptionally defined neuronal subtypes of the brain. However, the cellular processes that contribute to neuronal subtype specification and transcriptional heterogeneity remain unclear. By comparing the gene expression profiles of single layer 6 corticothalamic neurons in somatosensory cortex, we show that transcriptional subtypes primarily reflect axonal projection pattern, laminar position within the cortex, and neuronal activity state. Pseudotemporal ordering of 1,023 cellular responses to sensory manipulation demonstrates that changes in expression of activity-induced genes both reinforced cell-type identity and contributed to increased transcriptional heterogeneity within each cell type. This is due to cell-type biased choices of transcriptional states following manipulation of neuronal activity. These results reveal that axonal projection pattern, laminar position, and activity state define significant axes of variation that contribute both to the transcriptional identity of individual neurons and to the transcriptional heterogeneity within each neuronal subtype.

Keywords: activity-dependent plasticity; barrel cortex; corticothalamic neurons; neocortex; neuronal identity; single-cell RNA sequencing; somatosensory cortex; transcriptional variation.


Conflict of interest statement

DECLARATION OF INTERESTS

The authors declare no competing interests.

Figures

Figure 1
Figure 1. L6CThNs Distinguished by Their Axonal Projections Have Distinct Gene Expression Profiles
(A and F) Labeling schemes for L6CThNs projecting to the ventral posterior medial nucleus (VPM, A) and to VPM and the posterior medial nucleus (POm, F). (B) Retrograde tracer injection (red) into VPM in an Ntsr1-Cre;YFP mouse. (C and D) Colocalization of tracer and YFP in low-magnification (C) and high-magnification (D) images of layer 6 (L6) of barrel cortex (BC). (E) Quantification of the colocalization (n = 4 mice; error bars: SEM). (G) Injection of retrograde tracer (red) in POm of an Ntsr1-Cre;YFP mouse. (H and I) Colocalization of tracer in CThNs in lower L6 in low-magnification (H) and high-magnification (I) images of BC. (J) Quantification of the colocalization (n = 3 mice; error bars: SEM). (K) Matrix showing the 69 genes differentially expressed between pools of VPM/POm and VPM-only L6CThNs (three replicates). Scale bars, 500 μm (B and G), 50 μm (C and H), and 10 μm (D and I). See also Figure S1, Table S1, and Data S2.
Figure 2
Figure 2. Unbiased Clustering of Single L6CThN Transcriptomes Defines Two Subtypes with Strong Axonal Projection Bias
(A) t-SNE plot showing two subtypes of L6CThNs classified via unsupervised clustering. (B) t-SNE plot as in (A) with each L6CThN color-coded by axonal projection label. (C) Fraction of VPM-only (green) and VPM/POm (red) L6CThNs in each transcriptionally defined subtype for each replicate. (D) Hierarchical clustering of the 346 L6CThNs (x axis) and the 286 genes differentially expressed between the two subtypes (y axis) (0.1% FDR). (E and F) t-SNE plots showing the normalized expression levels of two differentially expressed protein-coding and long-noncoding RNAs enriched in subtype 1 (E, Fxyd6, left; F, linc-Tmem20, left) and subtype 2 (E, Lamp5, right; F, Pantr1, right). (G) Low-magnification image of linc-Tmem20 (red) in barrel cortex (BC) of an Ntsr1-Cre;tdTomato (green) mouse combining in situ hybridization (linc-Tmem20) and immunohistochemistry (tdTomato). Insets show higher expression of linc-Tmem20 in L6CThNs in lower layer 6 (L6; inset 2) relative to upper L6 (inset 1). (H) LacZ expression in BC of a heterozygous Pantr1-LacZ mouse following tracer injections in VPM (green) and in POm (red). Insets show LacZ puncta in VPM-only L6CThNs (column 1, green) and not in VPM/POm L6CThNs (column 2, red and green). (I) Fraction of VPM-only and VPM/POm L6CThNs expressing LacZ (n = 3 mice). (J) Median number of genes detected across all cells for each subtype by replicate pair (replicate 1: subtype 1 5,582 ± 526.3 [SD], subtype 2 5,080 ± 650.0 [SD], p < 2.169 × 10⁻¹⁰, Mann-Whitney test; replicate 2: subtype 1 6,950 ± 545.4 [SD], subtype 2 6,569 ± 478.7 [SD], p < 7.071 × 10⁻⁷, Mann-Whitney test). (K) Cumulative probability distribution of the pairwise Euclidean distances among cells in subtypes 1 (gold) and 2 (blue; p < 2.2 × 10⁻¹⁶, Welch’s two-sample t test). The black line represents the pairwise distances among a random sample of 100 cells drawn from the 346 cells. Ninety-five percent confidence interval is shown in light gray (Dvoretzky-Kiefer-Wolfowitz inequality). Scale bars, 100 and 20 μm (G) and 20 and 5 μm (H). See also Figures S1–S4, Tables S2 and S3, and Data S3.
Figure 3
Figure 3. Coordinately Regulated Gene Sets Contribute to the Transcriptional Identities of L6CThNs
(A) WGCNA on variance-stabilized gene expression estimates identifies modules of coordinately regulated genes grouped using hierarchical clustering of module eigengenes. (B) Pearson correlation of each module eigengene with both transcriptional subtype and label. Significance (asterisk) was determined using the Pearson’s product moment test (p < 0.01, Benjamini-Hochberg corrected). (C) Pearson correlation of each module eigengene with component rotations for PCs 1–5. (D and E) Enrichment of the 286 genes differentially expressed between L6CThN subtypes (D) and genes associated with neuronal activity (E) within each module (hypergeometric test, p < 0.01, Benjamini-Hochberg corrected). See also Figure S5 and Table S4.
Figure 4
Figure 4. Variation in the Transcriptional Profiles of L6CThNs Is Defined by Subtype-Specific Genes, Genes Reflecting Laminar Location, and Genes Induced by Neuronal Activity
(A and D) t-SNE plots showing the eigenvalue for each cell for the two WGCNA modules most correlated with PC1 (A, midnight blue; D, turquoise). (B, C, E, and F) t-SNE plots (left) showing the normalized gene expression in each cell for representative genes with significant weights on PC1. (B) and (C) belong to the midnight blue module and (E) and (F) to the turquoise module. Single-molecule fluorescence in situ hybridization (smFISH; middle) of mRNAs detected for each gene of interest (magenta), tdTomato (green), NeuN (cyan), and DAPI (blue) in L6 of Ntsr1-Cre;tdTomato mice. Quantitative gene expression analysis (right) showing the number of mRNAs expressed per neuron as a function of normalized vertical position in layer 6 (L6) and neuronal cell type (L6CThNs: Ntsr1;tdTomato-positive;NeuN-positive neurons in green; non-L6CThNs: Ntsr1;tdTomato-negative, NeuN-positive neurons in gray). Curves represent LOESS fits to individual data points, grouped by cell type; shaded areas correspond to 95% confidence intervals. Statistics: (B, Lamp5) “Subtype specific,” p < 7.3231 × 10⁻¹⁹; “CThN+ position specific,” p < 1.175 × 10⁻¹⁷; “CThN− position specific,” p < 0.0035; (C, Pantr1) “Subtype specific,” p < 0.9931; “CThN+ position specific,” p < 9.243 × 10⁻¹¹; “CThN− position specific,” p < 1.021 × 10⁻¹⁴; (E, Serpini1) “Subtype specific,” p < 1.606 × 10⁻⁶; “CThN+ position specific,” p < 1.045 × 10⁻⁶; ”CThN− position specific,” p < 0.3342; (F, Gabra5) ”Subtype specific,” p < 0.1020; “CThN+ position specific,” p < 1.994 × 10⁻³; “CThN− position specific,” p < 0.09873. Scale bars, 10 μm. (G) Module eigengenes for the four modules with significant enrichment for genes associated with neuronal activity. See also Figure S6.
Figure 5
Figure 5. Sustained Modulation of Gene Expression after Sensory Manipulation in L6CThNs
(A) Experimental design. Scale bar, 200 μm. (B) t-SNE plot of all 1,023 neurons obtained from baseline (day 0), 1, and 7 days following sensory manipulation using the 286 differentially expressed genes identified between L6CThN subtypes at day 0. Day 0 neurons are colored by transcriptional subtype; day 1 and day 7 neurons are colored light gray. t-SNE positions were fit to a Gaussian mixture model (black lines) to classify day 1 and 7 neurons as subtype 1 or 2. (C) t-SNE plot colored by transcriptional subtype as assigned in (B). Ten of 340 day 0 neurons (2.9%; green) were assigned to a different subtype than in Figure 2A. (D) t-SNE plot colored by projection label. (E) k-Means clustering analysis of mean-centered gene expression, aggregated by day and transcriptional subtype (subtype 1, gold; subtype 2, blue) for genes with significant differential expression after sensory manipulation. Semi-transparent lines represent individual genes; bold lines represent cluster centroids. See also Figure S7, Table S5, and Data S3 and S4.
Figure 6
Figure 6. Pseudotemporal Reconstruction of Transcriptional Responses to Sensory Manipulation in L6CThNs
(A) Discriminative dimensionality reduction projection of 1,023 L6CThNs using genes identified as significantly differentially expressed after sensory manipulation. Neurons are colored by day following manipulation. (B) Density distribution of L6CThNs across pseudotime, grouped by day following manipulation. (C) Heatmap of normalized response curves for the 1,507 genes with significant differential expression across pseudotime and significantly enriched gene sets identified for each cluster (p < 1.0 × 10⁻², hypergeometric test). See also Figure S7 and Table S6.
Figure 7
Figure 7. Sensory Manipulation Induces Distinct Cellular Responses in L6CThNs Biased with Respect to Transcriptional Subtype
(A) Distribution of the pairwise Euclidean distances within each subtype (subtype 1: left, gold; subtype 2: right, blue), using variance-stabilized expression estimates for all expressed genes. (B) Distribution of pairwise inter-subtype Euclidean distances between transcriptionally defined L6CThN subtypes across all expressed genes plotted for each day following sensory manipulation. The significant divergence between subtypes across time points is indicated by a positive shift in the distances after manipulation. (C) Density distributions of L6CThNs at each day plotted across pseudotime for the two L6CThN subtypes. (D) Discriminative dimensionality reduction projection of 1,023 L6CThNs shown in Figure 6A, colored by transcriptional subtype. Red and blue arrows indicate the major cellular response branchpoint following sensory manipulation. Gray arrow indicates the direction of response progression in the root state. Pie charts depict the proportion of each subtype for each branch. (E) BEAM analyses of gene sets with significant differential expression dependent on either major branchpoint. (F–H) BEAM heatmap for branch-dependent transcription factors not detected in the aggregate pseudotime response (F), presynaptic proteins (G), and ligand-gated neurotransmitter receptors (H). See also Figure S7 and Table S7.

References

    1. Bortone DS, Olsen SR, Scanziani M. Translaminar inhibitory cells recruited by layer 6 corticothalamic neurons suppress visual cortex. Neuron. 2014;82:474–485. - PMC - PubMed
    1. Bourassa J, Deschênes M. Corticothalamic projections from the primary visual cortex in rats: a single fiber study using biocytin as an anterograde tracer. Neuroscience. 1995;66:253–263. - PubMed
    1. Bourassa J, Pinault D, Deschênes M. Corticothalamic projections from the cortical barrel field to the somatosensory thalamus in rats: a single-fibre study using biocytin as an anterograde tracer. Eur J Neurosci. 1995;7:19–30. - PubMed
    1. Brennecke P, Anders S, Kim JK, Ko1odziejczyk AA, Zhang X, Proserpio V, Baying B, Benes V, Teichmann SA, Marioni JC, Heisler MG. Accounting for technical noise in single-cell RNA-seq experiments. Nat Methods. 2013;10:1093–1095. - PubMed
    1. Briggs F, Kiley CW, Callaway EM, Usrey WM. Morphological substrates for parallel streams of corticogeniculate feedback originating in both V1 and V2 of the macaque monkey. Neuron. 2016;90:388–399. - PMC - PubMed

Publication types