. 2018 Jan 9;22(2):456-470.
doi: 10.1016/j.celrep.2017.12.044.

PlexinA2 Forward Signaling through Rap1 GTPases Regulates Dentate Gyrus Development and Schizophrenia-like Behaviors

Affiliations

PlexinA2 Forward Signaling through Rap1 GTPases Regulates Dentate Gyrus Development and Schizophrenia-like Behaviors

Xiao-Feng Zhao et al. Cell Rep. .

Abstract

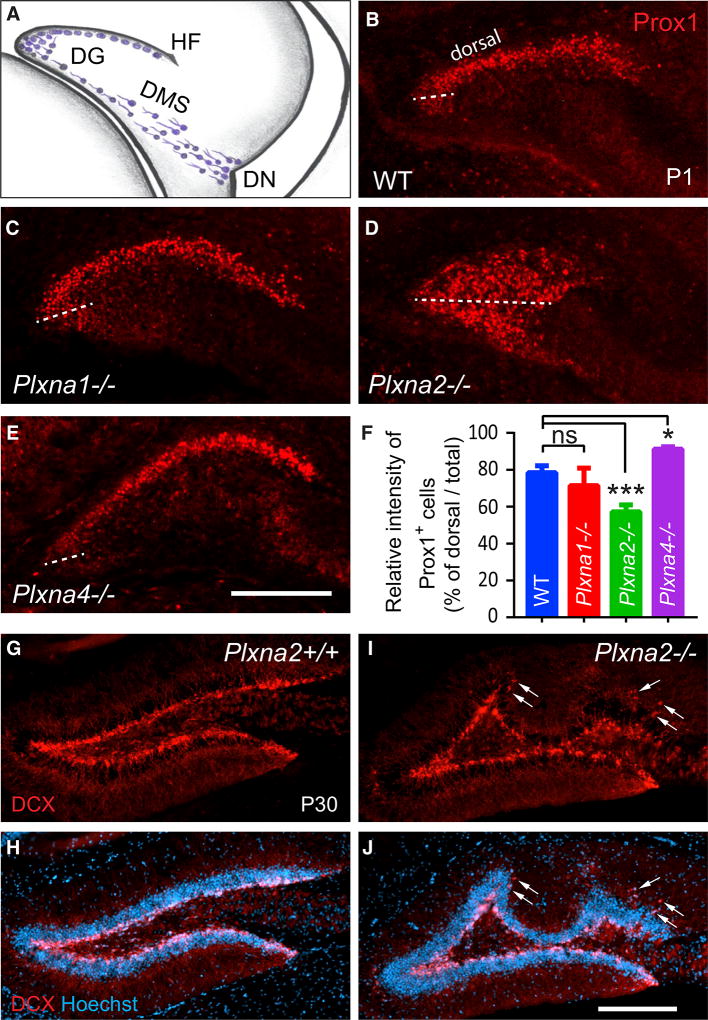
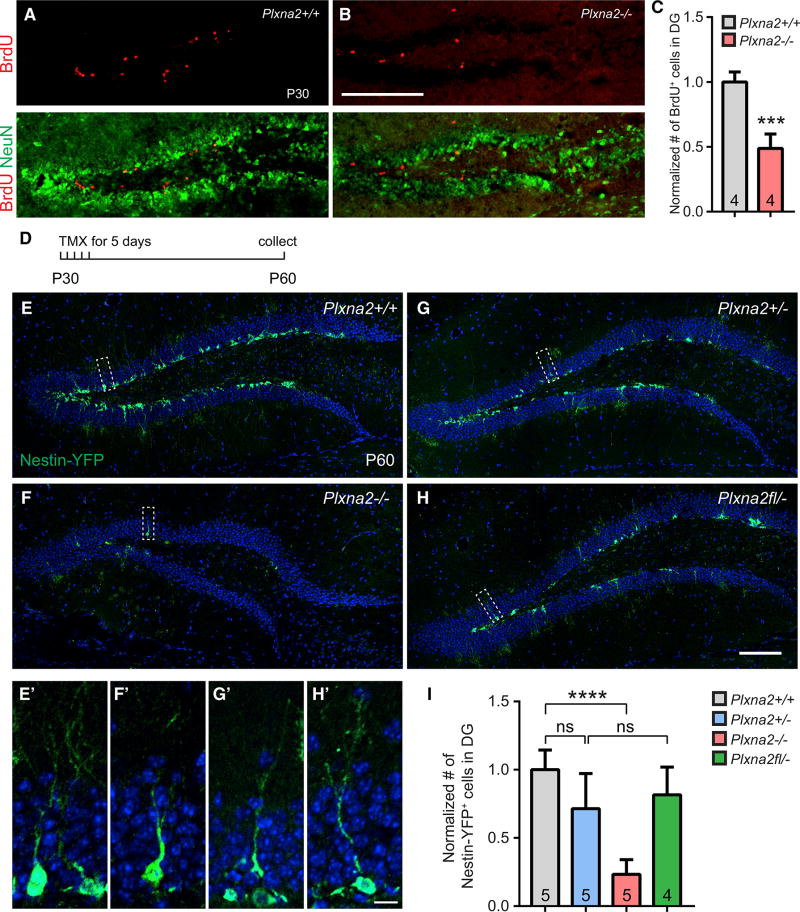
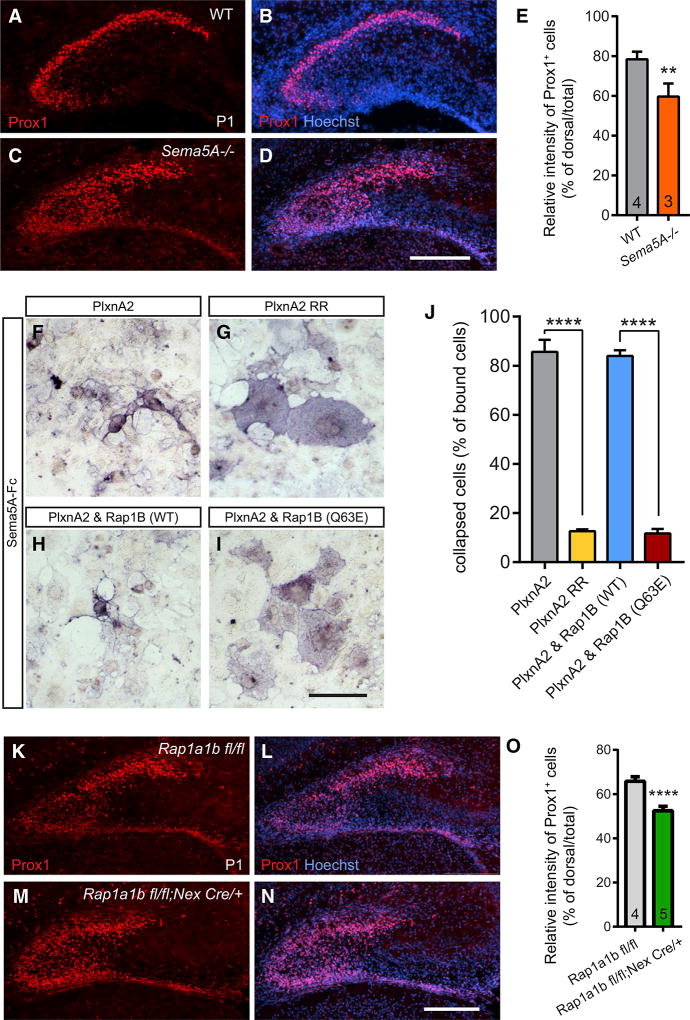
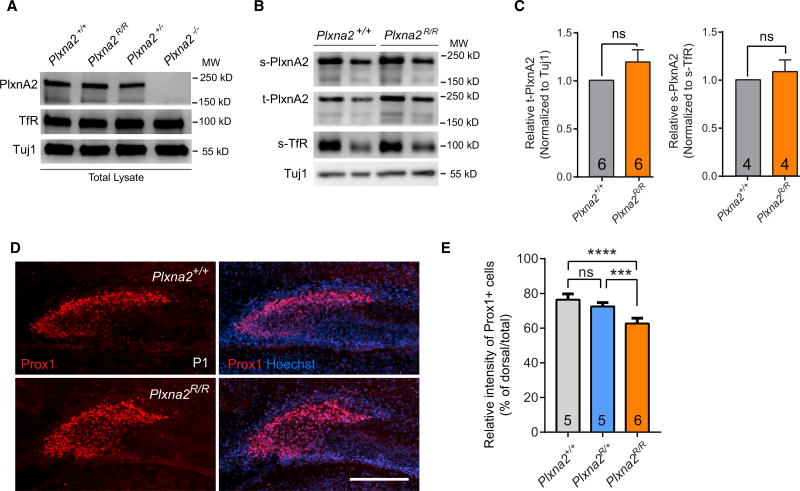
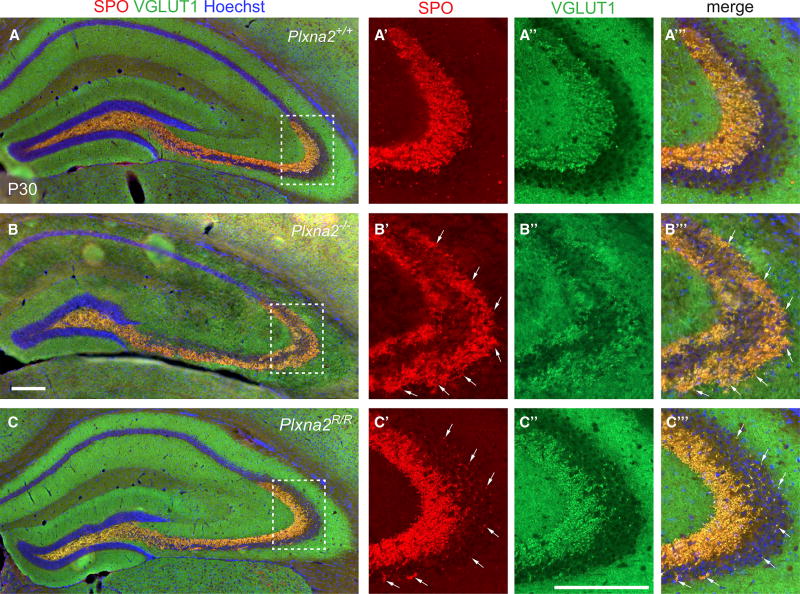
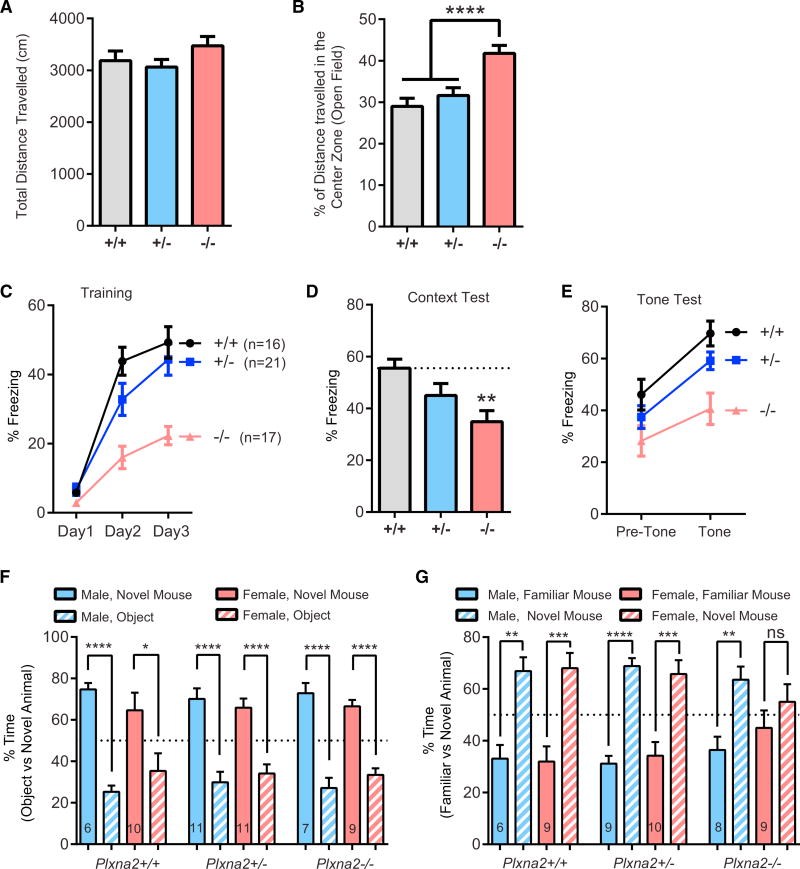
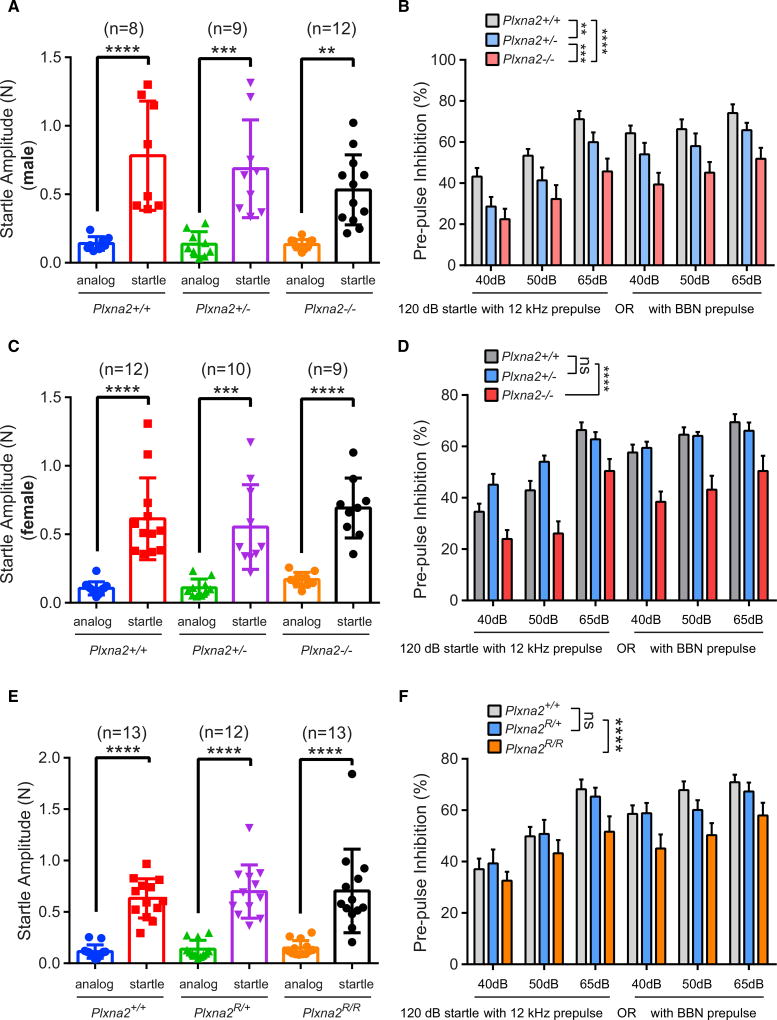
Dentate gyrus (DG) development requires specification of granule cell (GC) progenitors in the hippocampal neuroepithelium, as well as their proliferation and migration into the primordial DG. We identify the Plexin family members Plxna2 and Plxna4 as important regulators of DG development. Distribution of immature GCs is regulated by Sema5A signaling through PlxnA2 and requires a functional PlxnA2 GTPase-activating protein (GAP) domain and Rap1 small GTPases. In adult Plxna2-/- but not Plxna2-GAP-deficient mice, the dentate GC layer is severely malformed, neurogenesis is compromised, and mossy fibers form aberrant synaptic boutons within CA3. Behavioral studies with Plxna2-/- mice revealed deficits in associative learning, sociability, and sensorimotor gating-traits commonly observed in neuropsychiatric disorder. Remarkably, while morphological defects are minimal in Plxna2-GAP-deficient brains, defects in fear memory and sensorimotor gating persist. Since allelic variants of human PLXNA2 and RAP1 associate with schizophrenia, our studies identify a biochemical pathway important for brain development and mental health.

Keywords: GAP; PlexinA2; Rap1; adult neurogenesis; dentate gyrus; fear memory; mossy fiber; schizophrenia; semaphoring; sensorimotor gating.


Figures

Figure 1
Figure 1. Plxna2 and Plxna4 Regulate GC Distribution in the Developing DG
(A) In the developing mouse DG, immature GCs (blue cells) migrate from the dentate notch (DN) of the telencephalic neuroepithelium, along the dentate migratory stream (DMS) toward the hippocampal fissure (HF). (B–E) Anti-Prox1 staining of coronal brain sections through the rostral pole of the P1 hippocampus of (B) WT (n = 4), (C) Plxna1−/− (n = 3), (D) Plxna2−/− (n = 5), and (E) Plxna4−/− (n = 3) pups. The border between the dorsal and ventral GCL is marked by a dotted line through the medial pole of the DG. (F) Quantification of Prox1+ cells in the dorsal blade of the GCL compared to total Prox1 (GCL + hilus) labeling. Results are shown as mean value ± SD. *p < 0.05; ***p < 0.001, by one-way ANOVA, with Dunn post hoc t test. ns, not significant. (G–J) Coronal sections through the dorsal hippocampus of P30 (G and H) Plxna2+/+ (n = 3) and littermate (I and J) Plxna2−/− mice (n = 3) stained with anti-DCX (G and I) and with anti-DCX + Hoechst dye 33342 (H and J). Arrows point to ectopically positioned DCX+ cells in the dentate molecular layer. Scale bar, 200 µm.
Figure 2
Figure 2. Plxna2 Regulates Cell Proliferation and Formation of the Stem Cell Niche in the SGZ
(A and B) Coronal brain sections through the dorsal DG of P30 (A) Plxna2+/+ (n = 4) and (B) Plxna2−/− (n = 4) mice, stained with anti-BrdU and anti-NeuN. (C) Quantification of BrdU+ cells. Results are shown as mean value ± SD. ***p < 0.001, by unpaired two-tailed Student’s t test. (D–I) Fate mapping of nestin+ cells in the DG of Nestin-Cre-ERT2/R26R:YFP mice. (D) Timeline of tamoxifen (TMX) administration and tissue collection. (E–H) Coronal brain sections through the dorsal DG of P60 (E) Plxna2+/+ (n = 5), (F) Plxna2−/− (n = 5), (G) Plxna2+/− (n = 5), and (H) Plxna2fl/ conditional knockout (n = 4) mice on a Nestin-Cre-ERT2/R26R:YFP background. Progeny of nestin+ cells were visualized by anti-GFP immunofluorescence, and sections were counterstained with the Hoechst dye 33342. (E’–H’) Higher magnifications of boxed areas shown in (E)–(H). (I) Quantification of GFP+ cells normalized to cell counts (100%) in Plxna2+/+ mice. Results are shown as mean value ± SD. ****p < 0.0001, one-way ANOVA, with Bonferroni post hoc t test. ns, not significant. Scale bars, 200 µm in (B), 100 µm in (H), and 10 µm in (H’).
Figure 3
Figure 3. Sema5A and the Small GTPase Rap1 Are Required for Proper GC Migration
(A–D) Anti-Prox1 staining of coronal brain sections through the dorsal hippocampus of P1 (A and B) WT (n = 4) and (C and D) Sema5A−/− (n = 3) mouse pups. (E) Quantification of GC distribution defects. Results are shown as mean value ± SD. **p < 0.01, unpaired two-tailed Student’s t test. (F–I) Binding of Sema5A-Fc fusion protein to COS7 cells expressing recombinant (F) WT PlxnA2, (G) PlxnA2 RR, (H) WT PlxnA2 and WT Rap1B, and (I) PlxnA2 and constitutively active Rap1B(Q63E). (J) Quantification of the percentile of collapsed cells of total number of Sema5A-Fc binding cells (n = 3 independent experiments). (K–N) Anti-Prox1 staining of coronal brain sections through the dorsal hippocampus of P1 (K and L) Rap1aflox/flox/Rap1bflox/flox (n = 4) and (M and N) Rap1aflox/flox/Rap1bflox/flox;Nex-Cre (n = 5) mouse pups. (O) Quantification of GC distribution. Results are shown as mean value ± SD. ****p < 0.0001, unpaired two-tailed Student’s t test. Scale bars, 200 µm in (D) and (N) and 100 µm in (I).
Figure 4
Figure 4. PlxnA2 GAP Forward Signaling Is Required for Proper Distribution of GCs in the Developing DG
(A and B) Western blot analysis of mouse forebrain cell-culture lysates. (A) Blots of total cell lysates of Plxna2+/+, Plxna2R/R, Plxna2+/−, and Plxna2−/− DIV10 (10 days in vitro) cultures and (B) biotinylated cell-surface proteins isolated from Plxna2+/+ and Plxna2R/R cultures probed with anti-PlxnA2, anti-TfR, TuJ1, t-PlxnA2 (total PlxnA2), or s-PlxnA2 (surface PlxnA2). (C) Quantification of t-PlxnA2 in Plxna2+/+ and Plxna2R/R lysates normalized to TuJ1 (left; n = 6) and s-PlxnA2 normalized to s-TfR (right; n = 4). Data are shown as mean ± SEM, unpaired two-tailed Student’s t test. (D) Anti-Prox1 staining of coronal brain sections through the dorsal hippocampus of P1 (A) Plxna2+/+ (n = 5) and Plxna2R/R (n = 6) mouse pups. Scale bar is 200 µm. (E) Quantification of GC distribution in the Plxna2+/+ (n = 5), Plxna2R/+ (n = 5), and Plxna2R/R (n = 6) DG. Results are shown as mean value ± SD. ***p < 0.001; ****p < 0.0001, one-way ANOVA with Tukey post hoc t test. ns, not significant.
Figure 5
Figure 5. PlxnA2 GAP Activity Is Not Required for Mossy Fiber-CA3 Targeting and Mossy Fiber Bouton Formation
(A–C’”) Representative examples of coronal brain sections through the dorsal DG of P30 (A) Plxna2+/+ (n = 4), (B) Plxna2−/− (n = 4), and (C) Plxna2R/R (n = 4) mice, stained for the presynaptic markers SPO and anti-VGLUT1 to visualize MFBs. (A’–C’”) High magnification of the dotted regions shown in (A)–(C). Arrows in (B’)–(B’”) and (C’)–(C’’) point to ectopic MFBs in the stratum pyramidale in Plxna2−/− and Plxna2R/R mice. Scale bars, 200 µm.
Figure 6
Figure 6. Loss of Plxna2 Impairs Contextual Fear Memory and Sociability
(A) Quantification of total distance traveled in the OFT for Plxna2+/+ (n = 16), Plxna2+/− (n = 22), and Plxna2−/− (n = 16) mice; F(2, 52) = 1.591, p = 0.9739. (B) Percentage of total distance traveled in the center zone of the OFT chamber; F(2, 52) = 11.28, p < 0.0001. Data represent mean ± SEM. ****p < 0.0001, one-way ANOVA with Tukey’s correction for multiple comparisons. (C) Prior to training, Plxna2+/+ (n = 16), Plxna2+/− (n = 19), and Plxna2−/− (n = 16) mice all exhibited similar levels of freezing on day 1 (one-way ANOVA: F(2, 48) = 2.448, p = 0.100). All groups exhibited increased freezing levels across 3 days of cued fear conditioning, F(2, 96) = 102.362, p < 0.0001; however, a repeated-measures ANOVA reveals that Plxna2−/− mice exhibit reduced freezing levels compared to their Plxna2+/+ and Plxna2+/− littermates (effect of genotype: F(2, 48) = 15.996, p < 0.0001; Genotype × Training interaction: F(4, 96) = 5.715, p = 0.0004). (D) When returned to the original training context after 24 hr, Plxna2−/− mice exhibit reduced freezing levels during a 5-min context exposure, compared to their Plxna2+/+ littermates (F(2, 51) = 5.399, p = 0.0075, one-way ANOVA with Tukey’s correction for multiple comparisons). (E) Freezing in response to tone was assessed 48 hr after training. When analyzed using a two-factor repeated-measures ANOVA, all groups exhibited an increase in freezing in response to a tone (effect of training: F(1, 47) = 76.352, p < 0.0001). While there was a main effect of genotype (F(2, 47) = 5.715, p = 0.0053), the Genotype × Training interaction did not reach statistical significance (F(1, 47) = 2.415, p = 0.1004). (F and G) Three-chambered social interaction test: (F) both male and female Plxna2+/+, Plxna2+/−, and Plxna2−/− mice spent significantly more time engaged in nose-to-nose interaction with an unfamiliar mouse than with an inanimate object (unpaired t test). (G) All mice spent significantly more time engaged in nose-to-nose interaction with a novel mouse than with a familiar mouse, except for female Plxna2−/− mice, which showed no preference (unpaired t test). Number of mice tested is shown in bar graphs. Data represent mean ± SEM. *p < 0.05; **p < 0.01; ***p < 0.001; ****p < 0.0001. ns, not significant.
Figure 7
Figure 7. Defective Sensorimotor Gating in Plxna2−/− and Plxna2R/R Mice
(A) Testing of the startle amplitude of male Plxna2+/+ (n = 8), Plxna2+/− (n = 9), and Plxna2−/− (n = 12) mice to a 120-dB sound. (B) Percentile of PPI of the same cohort of mice with a prepulse delivered at 12 kHz or as broadband noise (BBN) at 40, 50, and 65 dB prior to the 120-dB startle sound. (C) Testing of the startle amplitude of female Plxna2+/+ (n = 12), Plxna2+/− (n = 10), and Plxna2−/− (n = 9) mice to a 120-dB sound. (D) Percentile of PPI of the same cohort of mice with a prepulse delivered at 12 kHz or as BBN at 40, 50, and 65 dB prior to the 120-dB startle sound. (E) Testing of the startle amplitude of Plxna2+/+ (n = 13), Plxna2R/+ (n = 12), and Plxna2R/R (n = 13) mice to a 120-dB sound. (F) Percentile of PPI of the same cohort of mice with a prepulse delivered at 12 kHz or as BBN at 40, 50, and 65 dB prior to the 120-dB startle sound. Data are presented as mean ± SD in (A), (C), and (E); **p < 0.01, ***p < 0.001, and ****p < 0.0001, by one-way ANOVA, with Tukey post hoc t test. Error bars indicate SEM in (B), (D), and (F); **p < 0.01, ***p < 0.001, and ****p < 0.0001, by two-way ANOVA, with Fisher’s least significant difference (LSD). ns, not significant.

Similar articles

Cited by

References

    1. Alexander GM, Farris S, Pirone JR, Zheng C, Colgin LL, Dudek SM. Social and novel contexts modify hippocampal CA2 representations of space. Nat. Commun. 2016;7:10300. - PMC - PubMed
    1. Altman J, Bayer SA. Migration and distribution of two populations of hippocampal granule cell precursors during the perinatal and postnatal periods. J. Comp. Neurol. 1990;301:365–381. - PubMed
    1. Bagri A, Gurney T, He X, Zou YR, Littman DR, Tessier-Lavigne M, Pleasure SJ. The chemokine SDF1 regulates migration of dentate granule cells. Development. 2002;129:4249–4260. - PubMed
    1. Battistini C, Tamagnone L. Transmembrane semaphorins, forward and reverse signaling: have a look both ways. Cell. Mol. Life Sci. 2016;73:1609–1622. - PMC - PubMed
    1. Beery AK, Kaufer D. Stress, social behavior, and resilience: insights from rodents. Neurobiol. Stress. 2015;1:116–127. - PMC - PubMed

Publication types