Healthy apple program to support child care centers to alter nutrition and physical activity practices and improve child weight: a cluster randomized trial
- PMID: 29320996
- PMCID: PMC6389251
- DOI: 10.1186/s12889-017-4951-y
Healthy apple program to support child care centers to alter nutrition and physical activity practices and improve child weight: a cluster randomized trial
Abstract
Background: North Carolina Nutrition and Physical Activity Self-Assessment for Child Care (NAP SACC) resources improve child body mass index (BMI) when the resources are introduced by nurses to child care providers, and offered with workshops and incentives. In San Francisco, public health and child care agencies partnered to adapt NAP SACC resources into an annual "Healthy Apple" quality improvement program (HAP).
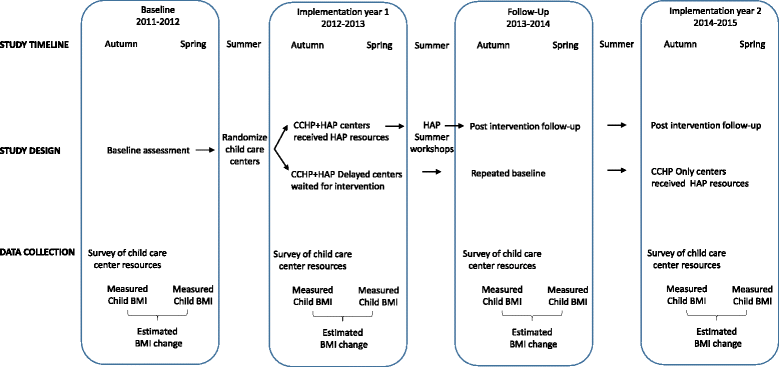
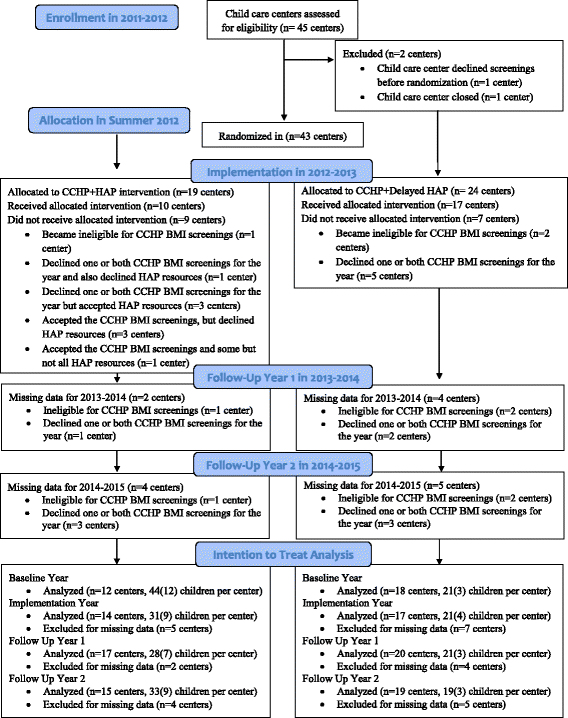
Methods: This cluster randomized controlled trial pilot-tested integration of the HAP with bi-annual public health screenings by nurses. All child care centers that participated in Child Care Health Program (CCHP) screenings in San Francisco in 2011-2012 were offered routine services plus HAP in 2012-2013 (CCHP + HAP, n = 19) or routine services with delayed HAP in 2014-2015 (CCHP + HAP Delayed, n = 24). Intention-to-treat analyses (robust SE or mixed models) used 4 years of screening data from 12 to 17 CCHP + HAP and 17 to 20 CCHP + HAP Delayed centers, regarding 791 to 945 children ages 2 to 5y, annually. Year-specific, child level models tested if children in CCHP + HAP centers had greater relative odds of exposure to 3 index best practices and smaller Autumn-to-Spring changes in BMI percentile and z-score than children in CCHP + HAP Delayed centers, controlling for age, sex, and Autumn status. Multi-year, child care center level models tested if HAP support modified year-to-year changes (2013-2014 and 2014-2015 vs 2011-2012) in child care center annual mean Autumn-to-Spring BMI changes.
Results: In 2011-2012, the CCHP + HAP and CCHP + HAP Delayed centers had similar index practices (<15% of children were exposed to a physical activity curriculum, staff joining in active play, and drinking water pitchers) and annual BMI changes. In 2013-2014: 60% of children in CCHP + HAP centers were exposed to the 3 index practices vs 19% in CCHP + HAP Delayed centers; Mean (SE) child BMI percentile (-2.6 (0.9), p = 0.003) and z-score (-0.08 (0.03), p = 0.007) decreased more in CCHP + HAP vs CCHP + HAP Delayed centers. In 2014-2015, after all centers were offered HAP, the index practices and BMI changes were improved for all centers vs 2011-2012.
Conclusions: Integration of the HAP with existing public health nursing services was associated with significantly more children exposed to best practices and improvement in child BMI change. The results warrant continued integration of HAP into local public health infrastructure.
Trial registration: ISRCTN18857356 (24/04/2015) Retrospectively registered.
Keywords: Child care center; Child obesity; Weight change.
Conflict of interest statement
Ethics approval and consent to participate
The HAP pilot evaluation was conducted according to the guidelines laid down in the Declaration of Helsinki. All procedures involving human subjects were approved by the University of California, San Francisco, Human Research Protection Program Institutional Review Board (IRB Number: 15–16,534). Families consented to CCHP services, including use of data for public health program planning and evaluation, and could opt out of screenings at any time.
Consent for publication
Not applicable.
Competing interests
The authors declare that they have no competing interests.
Publisher’s Note
Springer Nature remains neutral with regard to jurisdictional claims in published maps and institutional affiliations.
Figures


References
-
- National Prevention Council . National Prevention Strategy. Washington DC: US Department of Health and Human Services, Office of the Surgeon General; 2011.
-
- American Academy of Pediatrics, American Public Health Association, National Resource Center for Health and Safety in Child Care and Early Education . Caring for our children: National Health and safety performance standards; guidelines for early care and education programs. 3. Elk Grove Village: American Academy of Pediatrics, American Public Health Association; 2011.
-
- Let’s Move Child Care. America’s move to raise a healthier generation. https://healthykidshealthyfuture.org/. Accessed 5 Jul 2016.
-
- Harvard T.H. Chan School of Public Health. Early Child Care Obesity Prevention Recommendations: Complete List. https://www.hsph.harvard.edu/obesity-prevention-source/obesity-preventio.... Accessed 17 May 2016.
Publication types
MeSH terms
Grants and funding
LinkOut - more resources
Full Text Sources
Other Literature Sources
Medical
Research Materials

