. 2018 Feb 14;38(7):1648-1661.
doi: 10.1523/JNEUROSCI.2715-17.2018. Epub 2018 Jan 10.

Sensorimotor Functional and Structural Networks after Intracerebral Stem Cell Grafts in the Ischemic Mouse Brain

Affiliations

Sensorimotor Functional and Structural Networks after Intracerebral Stem Cell Grafts in the Ischemic Mouse Brain

Claudia Green et al. J Neurosci. .

Abstract

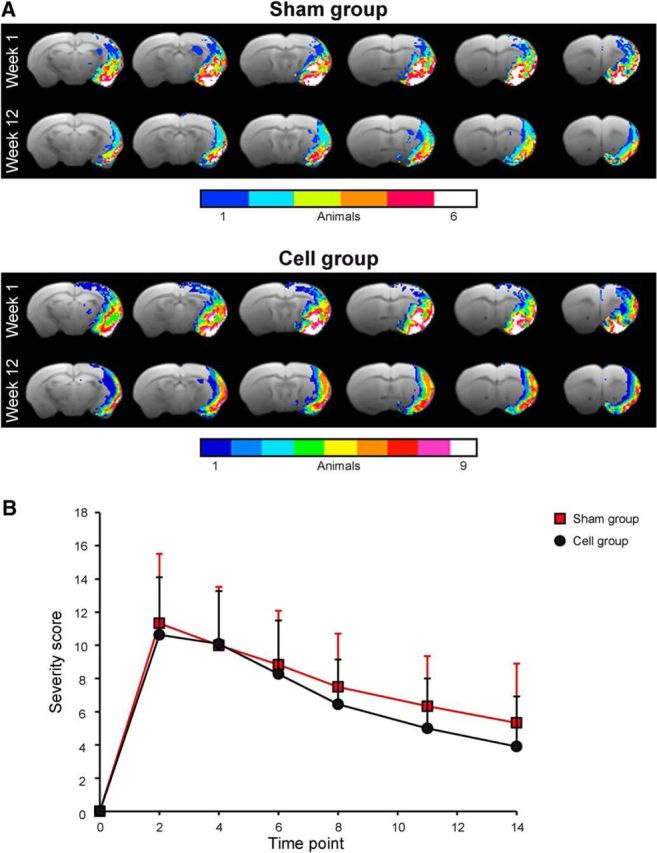
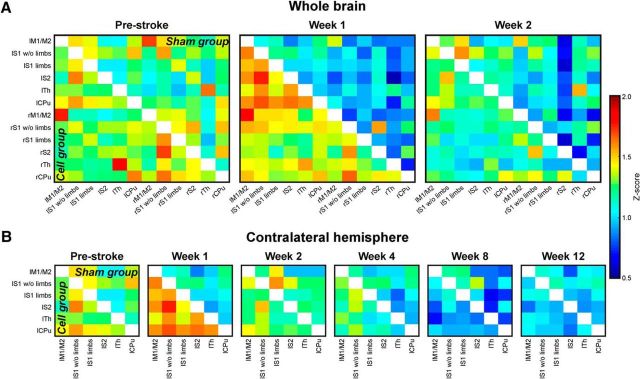
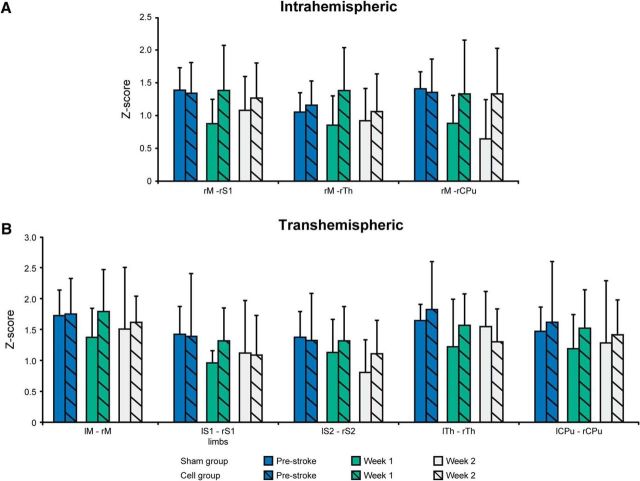
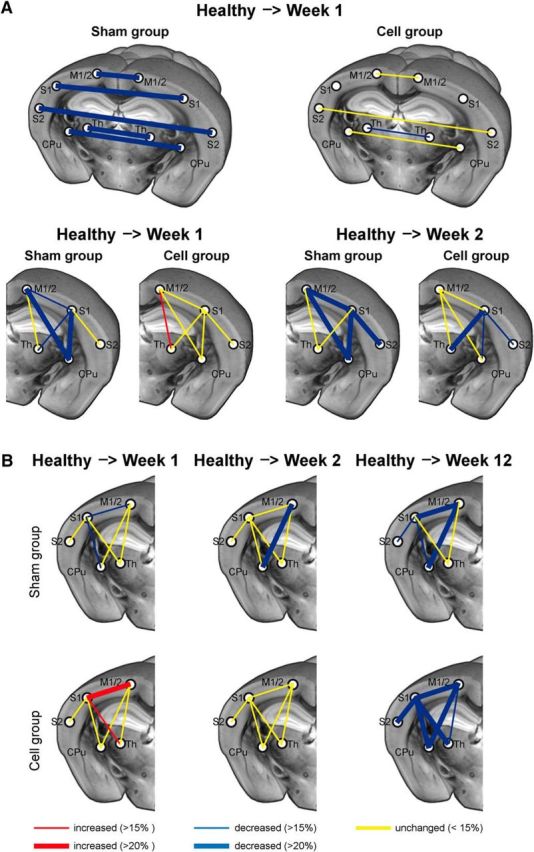
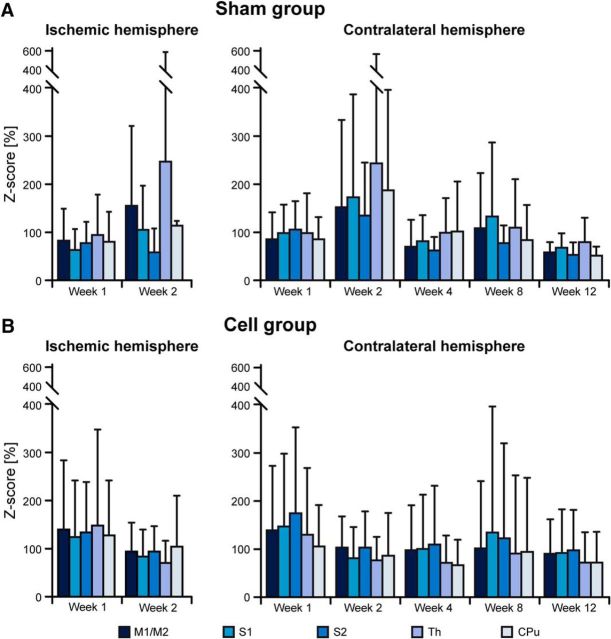
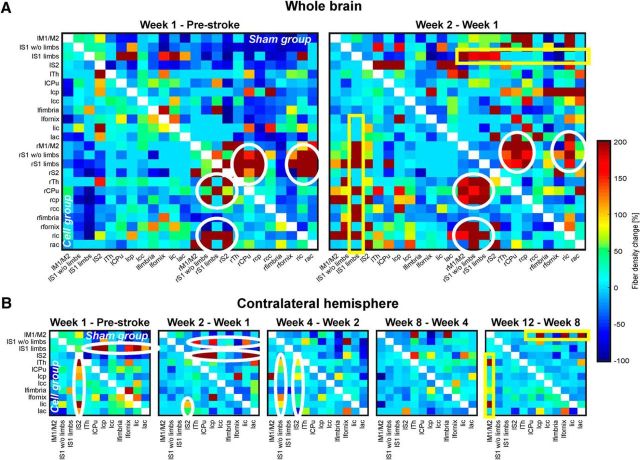
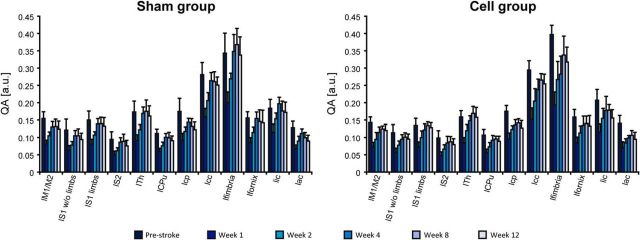
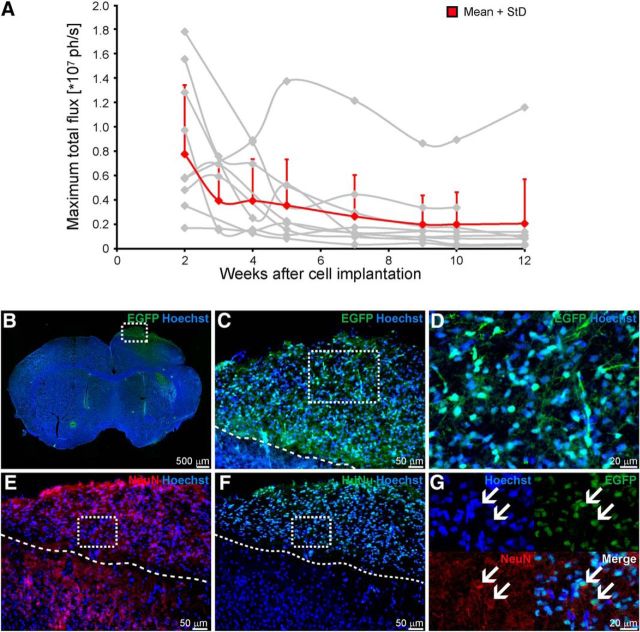
Past investigations on stem cell-mediated recovery after stroke have limited their focus on the extent and morphological development of the ischemic lesion itself over time or on the integration capacity of the stem cell graft ex vivo However, an assessment of the long-term functional and structural improvement in vivo is essential to reliably quantify the regenerative capacity of cell implantation after stroke. We induced ischemic stroke in nude mice and implanted human neural stem cells (H9 derived) into the ipsilateral cortex in the acute phase. Functional and structural connectivity changes of the sensorimotor network were noninvasively monitored using magnetic resonance imaging for 3 months after stem cell implantation. A sharp decrease of the functional sensorimotor network extended even to the contralateral hemisphere, persisting for the whole 12 weeks of observation. In mice with stem cell implantation, functional networks were stabilized early on, pointing to a paracrine effect as an early supportive mechanism of the graft. This stabilization required the persistent vitality of the stem cells, monitored by bioluminescence imaging. Thus, we also observed deterioration of the early network stabilization upon vitality loss of the graft after a few weeks. Structural connectivity analysis showed fiber-density increases between the cortex and white matter regions occurring predominantly on the ischemic hemisphere. These fiber-density changes were nearly the same for both study groups. This motivated us to hypothesize that the stem cells can influence, via early paracrine effect, the functional networks, while observed structural changes are mainly stimulated by the ischemic event.SIGNIFICANCE STATEMENT In recent years, research on strokes has made a shift away from a focus on immediate ischemic effects and towards an emphasis on the long-range effects of the lesion on the whole brain. Outcome improvements in stem cell therapies also require the understanding of their influence on the whole-brain networks. Here, we have longitudinally and noninvasively monitored the structural and functional network alterations in the mouse model of focal cerebral ischemia. Structural changes of fiber-density increases are stimulated in the endogenous tissue without further modulation by the stem cells, while functional networks are stabilized by the stem cells via a paracrine effect. These results will help decipher the underlying networks of brain plasticity in response to cerebral lesions and offer clues to unravelling the mystery of how stem cells mediate regeneration.

Keywords: functional networks; mouse; stem cell implantation; stroke; structural networks.


Figures

Figure 1.
Figure 1.
Characterization of the ischemic territory extent and lesion severity in both animal groups. A, The lesion territory is presented by the QA values of the Q-ball diffusion MRI data, indicating the pathological change of diffusion anisotropy and thereby reflecting the ischemic lesion territory. From the individual maps of the animals, incidence maps were calculated to determine the homogeneity of the lesion expansion within each group. B, The neurological deficit score was monitored during the first 2 weeks after stroke induction to ascertain whether the lesion severity is equal in both animal groups.
Figure 2.
Figure 2.
Cross-correlation z-score matrices of sensorimotor functional connectivity. A, Z-score matrices of the whole mouse brain sensorimotor networks before (prestroke) stroke induction and 1 and 2 weeks after stroke induction. Directly after stroke induction, the correlation strengths are decreased in the sham group (upper matrix triangle). The effect is strongest for the ipsilateral (right) hemisphere. In animals with stroke and stem cell implantation into the cortex adjacent to the ischemic lesion (cell group; lower matrix triangle), no reduction in the functional network is observed, but it is stabilized with slight increases above prestroke in Week 1 after stroke. B, Z-score matrices of the sensorimotor networks on the contralateral hemisphere during the whole 12 weeks of observation. Here, similar to the ischemic hemisphere, but less pronounced, the sham group shows a connectivity decrease continuously more severe during the 12 weeks of observation. The lowest point is reached at Week 8. In the stem cell-implantation group the implantation stabilizes the connectivity strength still at Week 2. Then, the functional connectivity continually decreases, approximating the lower value matrices of the sham-implantation group between Weeks 8 and 12. “l” prefix, left hemisphere; “r” prefix, right hemisphere; M1/M2, primary/secondary motor cortex; S1 w/o limbs, S1 somatosensory cortex without limb representation area; S1 limbs, limb representation area of the S1 somatosensory cortex; S2: secondary somatosensory cortex; Th, thalamus; CPu, caudate–putamen.
Figure 3.
Figure 3.
Z-score values of various connectivities between both hemispheres before and during the first 2 weeks following stroke induction. A, Connectivities within the ischemic hemisphere. B, Interhemispheric connectivities between homotopic nodes of both hemispheres before and during the first 2 weeks following stroke. Error bars indicate SD. None of the temporal comparisons was found to be statistically significant.
Figure 4.
Figure 4.
Schematic of the interhemispheric and intrahemispheric functional connectivity changes of the sensorimotor networks. A, Interhemispheric connectivity changes are very pronounced in the sham-implantation group, while in the cell-implantation group, all interhemispheric connectivities remain unchanged, except for a small decrease of the interthalamic connections. The ipsilesional intrahemispheric functional networks are severely affected in the sham-implantation group but show very few and only small changes in the stem cell-implantation group. B, The contralesional intrahemispheric functional connectivity changes show a continuously increasing weakening effect for the sham-implantation group over the 12 weeks of observation. In the stem cell-implantation group, the situation is stable during the first 2 weeks with few changes, followed by a delayed decrease toward the end of the observation period at 12 weeks after stroke. Thicker connecting lines reflect increasing intensity of change with z-score values differing ≫15%. For abbreviations see Figure 2.
Figure 5.
Figure 5.
Intranode connectivity strength of the nodes of the sensorimotor network. Values of all individual sensorimotor nodes were normalized to their corresponding prestroke values. A, Values of the sham group show a strong decrease to ≤60% on the ischemic hemisphere during the first week. On the contralateral hemisphere, there is only a marginal further decrease after the first week of stroke. B, At 80%, the z-score reduction of the stem cell group is much less during the first week on the ischemic hemisphere. On the contralateral hemisphere, the stem cell group values start with ∼90% to almost 100% of prestroke values during the first week after stroke, followed by slow further decrease to ∼60% at Week 12, which is still slightly higher than the sham group at that time point. Error bars indicate SD. None of the temporal comparisons was found to be statistically significant. For abbreviations see Figure 2.
Figure 6.
Figure 6.
Fiber-tract density changes in the ischemic mouse brain after cortical stem cell grafting. Matrices represent the voxel size-normalized percentage difference for two consecutive time points of fiber counts passing through or ending in two nodes. A, Whole-brain analysis with the difference between the baseline measurement and the first week after stroke (left column), and between the second week and the first week (right column). The dominant increases in fiber densities between the two respective time points are between the somatosensory cortex and white matter regions forming the corticospinal tract (white circles). The marked regions are the same for both groups (upper matrix triangle, sham group; lower matrix triangle, stem cell group) but the highest fiber-density increase occurs earlier in the sham-implantation group (Week 1) than in the stem cell-implantation group (Week 2). Additionally, both groups show a fiber-density increase between the contralesional motor cortex and several white matter regions (yellow box). B, Analysis of the contralesional hemisphere during the whole 12 week period. Represented are the differences in fiber density between two sequential measurement time points after stroke as indicated. Again, as for the bihemispheric analysis of the first 2 weeks, most pronounced fiber-density increases are noted in the somatosensory cortex areas with various white matter regions (white ellipses). Delayed between Weeks 8 and 12, the motor cortex shows a fiber increase to white matter regions (yellow box). No structural difference, but temporal delay in occurrence of the ellipses is noted between the two groups. “l” prefix, left hemisphere; “r” prefix, right hemisphere; M1/M2, primary/secondary motor cortex; S1 w/o limbs, S1 somatosensory cortex without limb representation area; S1 limbs, limb representation area of the S1 somatosensory cortex; S2: secondary somatosensory cortex; Th, thalamus; CPu, caudate–putamen; cp, cerebral peduncle; cc, corpus callosum; ic, internal capsule; ac, anterior commissure.
Figure 7.
Figure 7.
QA values of nodes from the sensorimotor networks on the contralateral hemisphere during the full 12 week observation period. The QA values were determined from the Q-ball diffusion MRI data. Error bars indicate SD. Statistical significance was found for all ROIs from before stroke induction to Week 1 after stroke (p < 0.001). For later consecutive time points, white matter ROIs showed a statistical significance with p < 0.016 or less.
Figure 8.
Figure 8.
Characterization of the stem cell graft. A, Vitality of the graft over time was determined from in vivo bioluminescence imaging. Total photon flux shows an intensity decrease over time for all individual animals (gray lines). Values were only included in the analysis from Week 2 on, as earlier values were considered unreliable due to incompletely recovered scalp after grafting. After Week 4, the loss of viable stem cells of the total graft becomes severe as best recognized in the group average curve (red line). After Week 4, viability of the graft is reduced to ∼30% of the original graft and remains at this lower level for the further 8 weeks. B–G, Immunohistochemical staining of the engrafted NSCs shows spontaneous differentiation into neuronal cells. Transgenic NSCs positive for eGFP were located within cortical regions and show nuclear as well as cytoplasmic eGFP expression, including neuronal-like processes (B–D). To prove neuronal differentiation of the engrafted human NSCs, sections were stained for the neuronal marker NeuN (E) and the human cell marker HuNu (F). Several NSCs double-positive for both markers were detected within the graft side, indicating a neuronal differentiation of the engrafted NSCs (G, arrows). Broken lines represent the border between cell graft and host tissue. Scale bars are indicated for each microscopic image.

References

    1. Adamczak JM, Schneider G, Nelles M, Que I, Suidgeest E, van der Weerd L, Löwik C, Hoehn M (2014) In vivo bioluminescence imaging of vascular remodeling after stroke. Front Cell Neurosci 8:274. 10.3389/fncel.2014.00274 - DOI - PMC - PubMed
    1. Adamczak J, Aswendt M, Kreutzer C, Rotheneichner P, Riou A, Selt M, Beyrau A, Uhlenküken U, Diedenhofen M, Nelles M, Aigner L, Couillard-Despres S, Hoehn M (2017) Neurogenesis upregulation on the healthy hemisphere after stroke enhances compensation for age-dependent decrease of basal neurogenesis. Neurobiol Dis 99:47–57. 10.1016/j.nbd.2016.12.015 - DOI - PubMed
    1. Aswendt M, Adamczak J, Couillard-Despres S, Hoehn M (2013) Boosting bioluminescence neuroimaging: an optimized protocol for brain studies. PloS One 8:e55662. 10.1371/journal.pone.0055662 - DOI - PMC - PubMed
    1. Bacigaluppi M, Pluchino S, Peruzzotti-Jametti L, Jametti LP, Kilic E, Kilic U, Salani G, Brambilla E, West MJ, Comi G, Martino G, Hermann DM (2009) Delayed postischemic neuroprotection following systemic neural stem cell transplantation involves multiple mechanisms. Brain 132:2239–2251. 10.1093/brain/awp174 - DOI - PubMed
    1. Bacigaluppi M, Russo GL, Peruzzotti-Jametti L, Rossi S, Sandrone S, Butti E, De Ceglia R, Bergamaschi A, Motta C, Gallizioli M, Studer V, Colombo E, Farina C, Comi G, Politi LS, Muzio L, Villani C, Invernizzi RW, Hermann DM, Centonze D, et al. (2016) Neural stem cell transplantation induces stroke recovery by upregulating glutamate transporter GLT-1 in astrocytes. J Neurosci 36:10529–10544. 10.1523/JNEUROSCI.1643-16.2016 - DOI - PMC - PubMed

Publication types

MeSH terms

LinkOut - more resources