

Improving adherence to healthy dietary patterns, genetic risk, and long term weight gain: gene-diet interaction analysis in two prospective cohort studies
- PMID: 29321156
- PMCID: PMC5759092
- DOI: 10.1136/bmj.j5644
Improving adherence to healthy dietary patterns, genetic risk, and long term weight gain: gene-diet interaction analysis in two prospective cohort studies
Erratum in
-
Improving adherence to healthy dietary patterns, genetic risk, and long term weight gain: gene-diet interaction analysis in two prospective cohort studies.BMJ. 2018 Feb 12;360:k693. doi: 10.1136/bmj.k693. BMJ. 2018. PMID: 29439997 Free PMC article. No abstract available.
Abstract
Objective: To investigate whether improving adherence to healthy dietary patterns interacts with the genetic predisposition to obesity in relation to long term changes in body mass index and body weight.
Design: Prospective cohort study.
Setting: Health professionals in the United States.
Participants: 8828 women from the Nurses' Health Study and 5218 men from the Health Professionals Follow-up Study.
Exposure: Genetic predisposition score was calculated on the basis of 77 variants associated with body mass index. Dietary patterns were assessed by the Alternate Healthy Eating Index 2010 (AHEI-2010), Dietary Approach to Stop Hypertension (DASH), and Alternate Mediterranean Diet (AMED).
Main outcome measures: Five repeated measurements of four year changes in body mass index and body weight over follow-up (1986 to 2006).
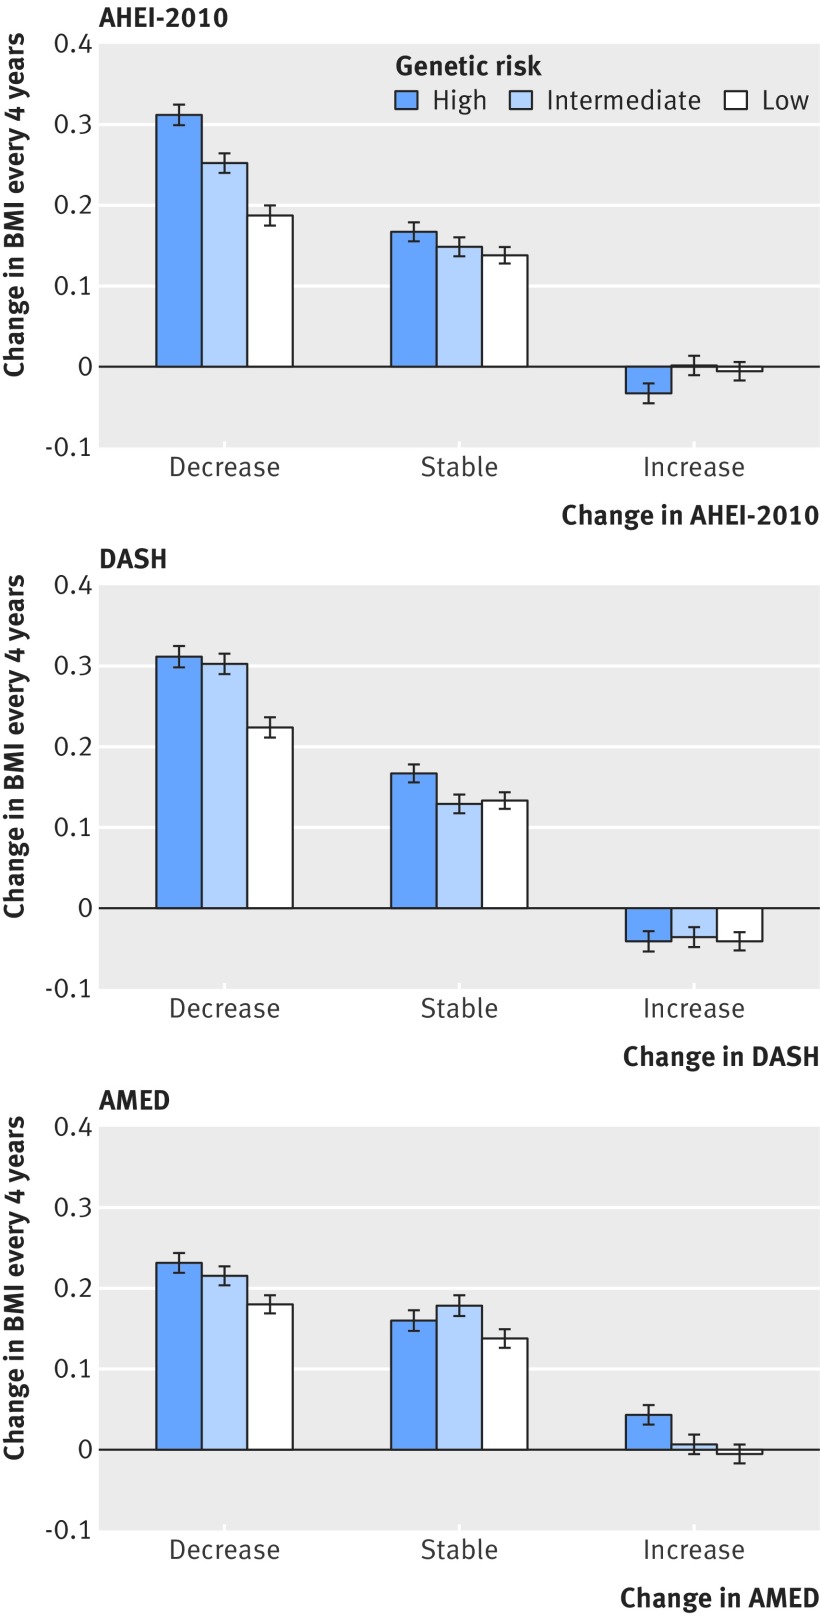
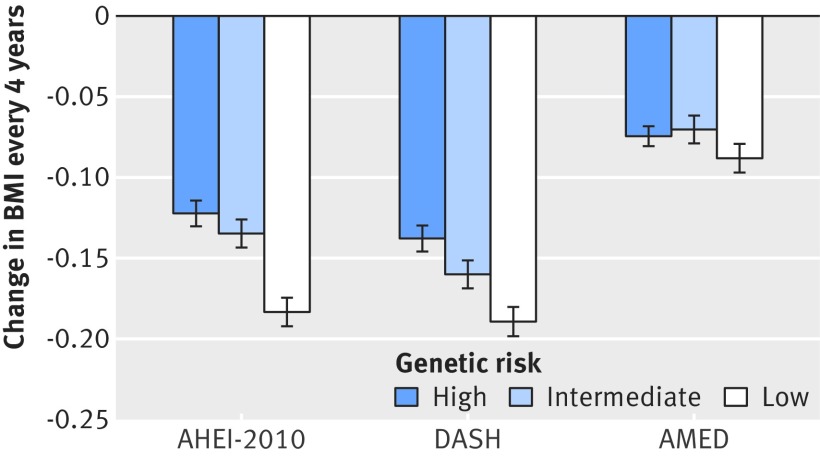
Results: During a 20 year follow-up, genetic association with change in body mass index was significantly attenuated with increasing adherence to the AHEI-2010 in the Nurses' Health Study (P=0.001 for interaction) and Health Professionals Follow-up Study (P=0.005 for interaction). In the combined cohorts, four year changes in body mass index per 10 risk allele increment were 0.07 (SE 0.02) among participants with decreased AHEI-2010 score and -0.01 (0.02) among those with increased AHEI-2010 score, corresponding to 0.16 (0.05) kg versus -0.02 (0.05) kg weight change every four years (P<0.001 for interaction). Viewed differently, changes in body mass index per 1 SD increment of AHEI-2010 score were -0.12 (0.01), -0.14 (0.01), and -0.18 (0.01) (weight change: -0.35 (0.03), -0.36 (0.04), and -0.50 (0.04) kg) among participants with low, intermediate, and high genetic risk, respectively. Similar interaction was also found for DASH but not for AMED.
Conclusions: These data indicate that improving adherence to healthy dietary patterns could attenuate the genetic association with weight gain. Moreover, the beneficial effect of improved diet quality on weight management was particularly pronounced in people at high genetic risk for obesity.
Published by the BMJ Publishing Group Limited. For permission to use (where not already granted under a licence) please go to http://group.bmj.com/group/rights-licensing/permissions.
Conflict of interest statement
Competing interests: All authors have completed the ICMJE uniform disclosure form at www.icmje.org/coi_disclosure.pdf and declare: no support from any organization for the submitted work other than that described above; no financial relationships with any organizations that might have an interest in the submitted work in the previous three years; no other relationships or activities that could appear to have influenced the submitted work.
Figures
Comment in
-
Diet, genes, and obesity.BMJ. 2018 Jan 10;360:k7. doi: 10.1136/bmj.k7. BMJ. 2018. PMID: 29321151 No abstract available.
References
-
- Swinburn BA, Caterson I, Seidell JC, James WP. Diet, nutrition and the prevention of excess weight gain and obesity. Public Health Nutr 2004;7(1A):123-46. - PubMed
Publication types
MeSH terms
Grants and funding
LinkOut - more resources
Full Text Sources
Other Literature Sources
Medical