. 2018 Jan;30(1):101-116.
doi: 10.1105/tpc.17.00771. Epub 2018 Jan 9.

Far-Red Light Detection in the Shoot Regulates Lateral Root Development through the HY5 Transcription Factor

Affiliations

Far-Red Light Detection in the Shoot Regulates Lateral Root Development through the HY5 Transcription Factor

Kasper van Gelderen et al. Plant Cell. 2018 Jan.

Abstract

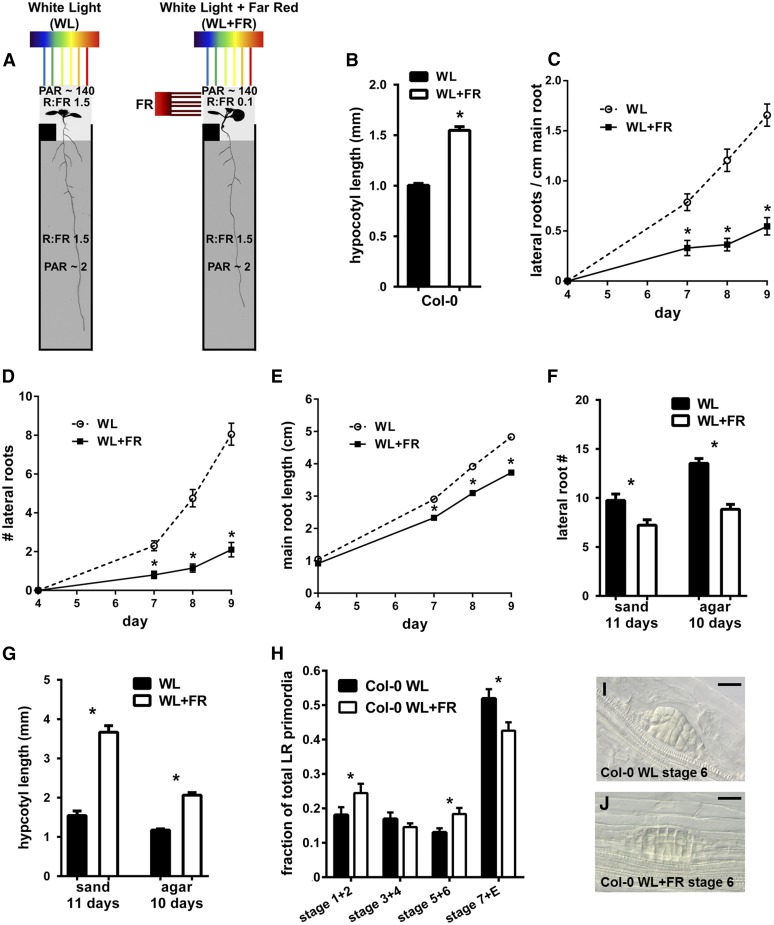
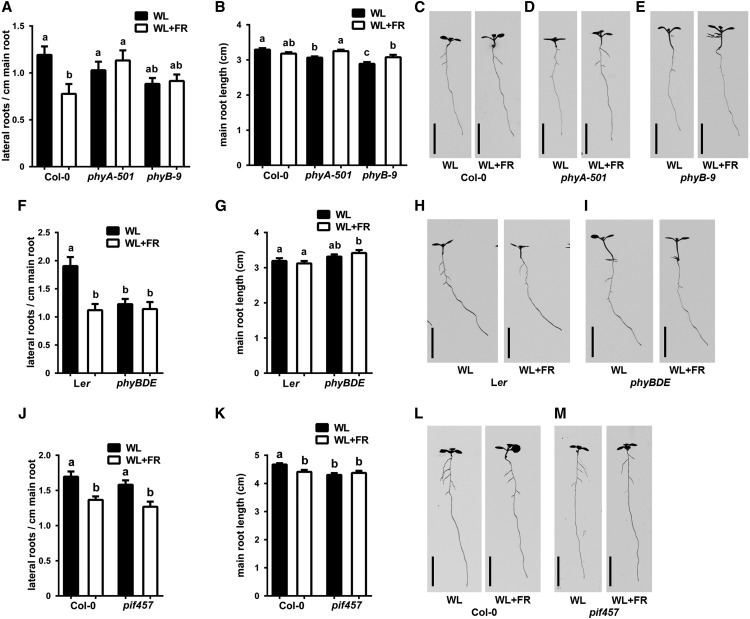
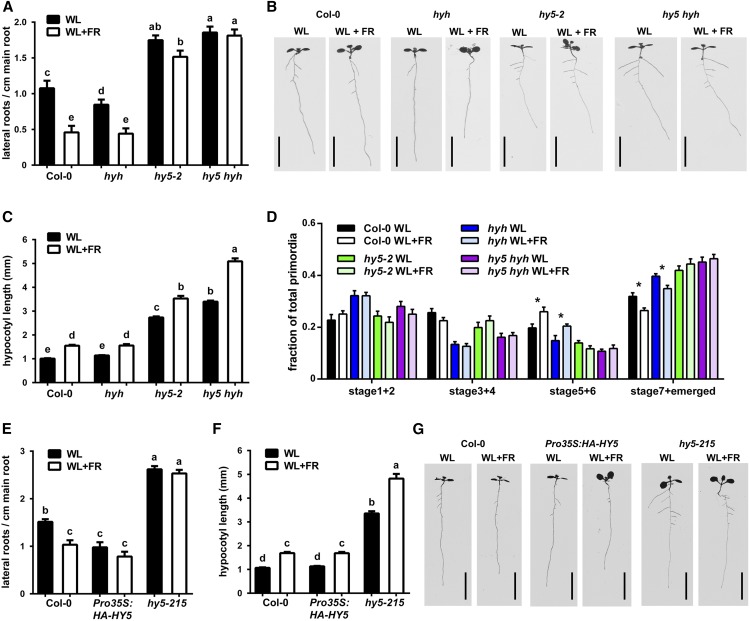
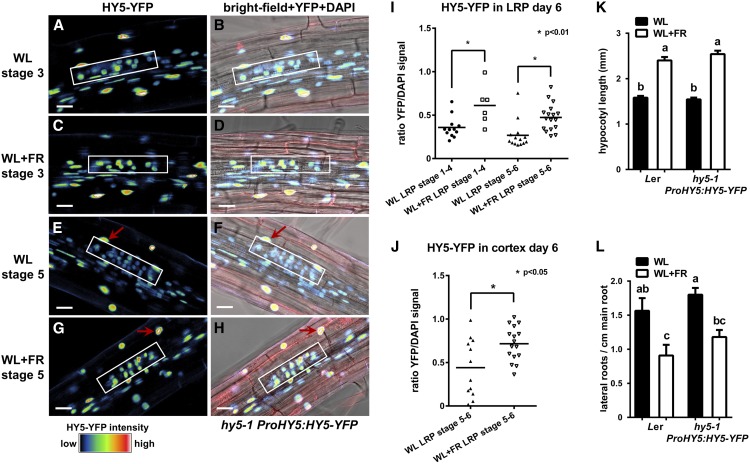
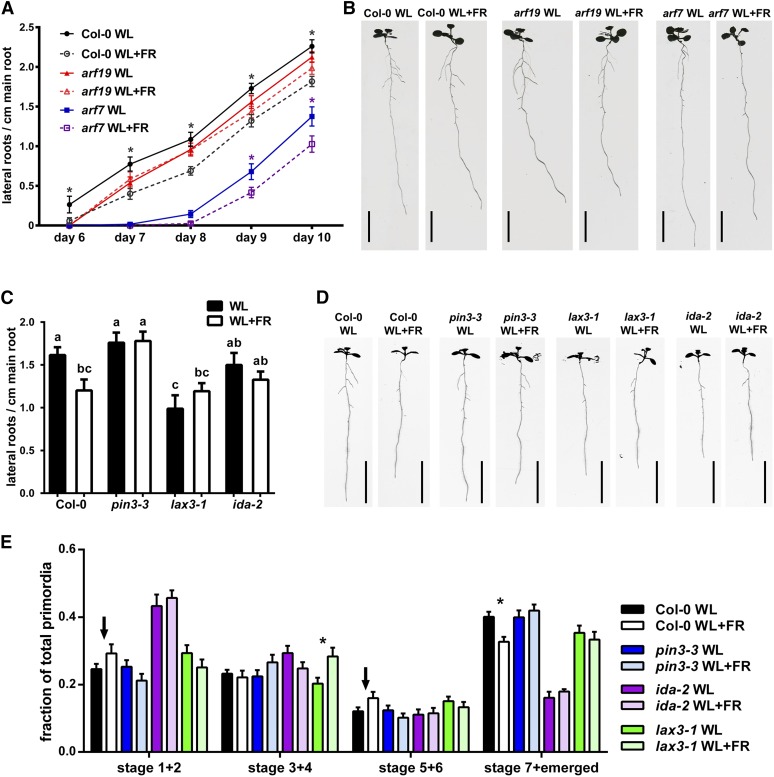
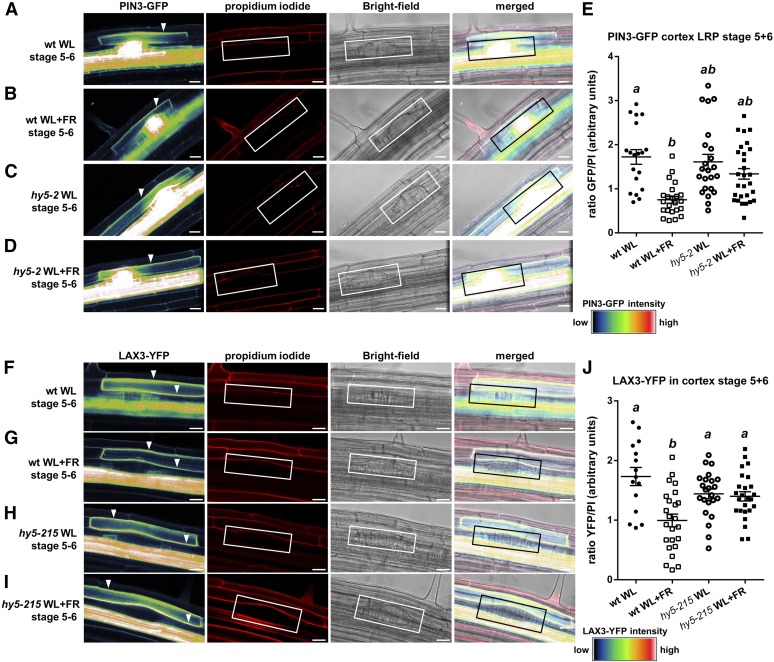
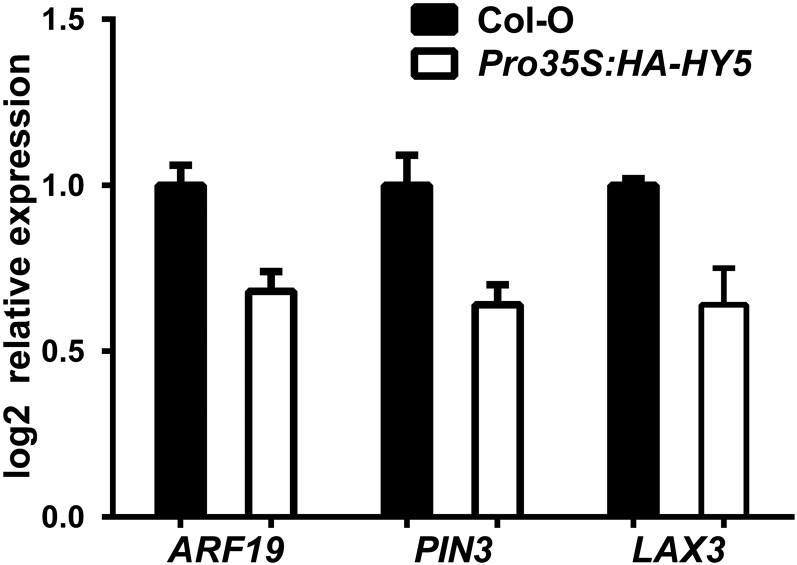
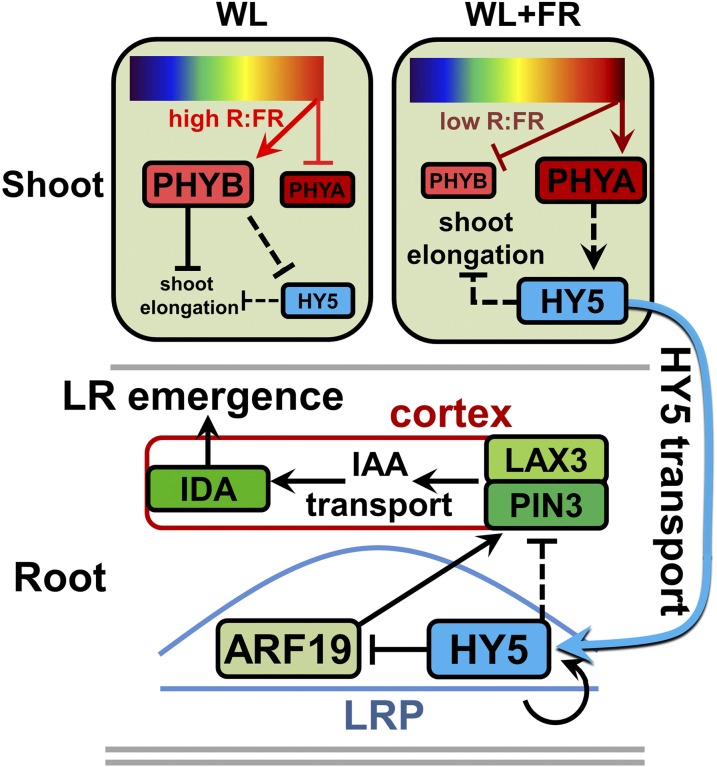
Plants in dense vegetation compete for resources and detect competitors through reflection of far-red (FR) light from surrounding plants. This reflection causes a reduced red (R):FR ratio, which is sensed through phytochromes. Low R:FR induces shade avoidance responses of the shoot and also changes the root system architecture, although this has received little attention so far. Here, we investigate the molecular mechanisms through which light detection in the shoot regulates root development in Arabidopsis thaliana We do so using a combination of microscopy, gene expression, and mutant study approaches in a setup that allows root imaging without exposing the roots to light treatment. We show that low R:FR perception in the shoot decreases the lateral root (LR) density by inhibiting LR emergence. This decrease in LR emergence upon shoot FR enrichment is regulated by phytochrome-dependent accumulation of the transcription factor ELONGATED HYPOCOTYL5 (HY5) in the LR primordia. HY5 regulates LR emergence by decreasing the plasma membrane abundance of PIN-FORMED3 and LIKE-AUX1 3 auxin transporters. Accordingly, FR enrichment reduces the auxin signal in the overlaying cortex cells, and this reduces LR outgrowth. This shoot-to-root communication can help plants coordinate resource partitioning under competition for light in high density fields.


Figures

Figure 1.
Figure 1.
Supplemental FR Experienced by the Shoot Leads to Reduced Lateral and Primary Root Growth. (A) Setup used to illuminate shoot with FR light. The root is shielded by a black cover around the plate and an insert at the shoot-root boundary (black box just below shoot). R:FR ratios of each compartment are indicated, along with the amount of PAR. (B) Hypocotyl length of 8-d-old seedlings in WL and WL+FR. (C) LR density (all emerged laterals divided by the total main root length) of Col-0 in WL and WL+FR during 9 d of growth. (D) Col-0 average LR number. (E) Col-0 average main root length. (F) Average number of lateral roots in Col-0 plants grown in sand or on the D-root agar plate system (A), treated with WL or WL+FR. (G) Hypocotyl length of plants shown in (F). (H) Distribution of LRP stages (as a fraction of total primordia) of Col-0 seedlings grown for 8 d in WL or WL+FR. Stages were grouped into 1+2, 3+4, 5+6, and 7+ emerged. (I) and (J) Examples of stage 6 LRP in WL and WL+FR. Bars = 20 µm. Error bars show se; all experiments n = 15 to 20 seedlings per treatment. Asterisk indicates that difference between means is significant P < 0.05, t test.
Figure 2.
Figure 2.
Phytochrome Mutants Do Not Show a Decreased LR Density during WL+FR Experienced by the Shoot, and the Root and Shoot Phenotypes Can Be Uncoupled. (A) to (E) Col-0, phyA-501, and phyB-9 were grown for 8 d in WL or WL+FR. LR density (A), main root length (B), representative examples at 8 d ([C] to [E]). (F) to (I) Ler and phyBDE were grown for 8 d in WL or WL+FR. LR density (F), main root length (G), and representative examples ([H] and [I]). (J) to (M) Col-0 and pif457 were grown for 8 d in WL or WL+FR. LR density (J), main root length (K), and representative examples ([L] and [M]). Error bars show se; n = 15 to 20 seedlings per treatment. Bars = 1 cm. Letters denote significant difference, P < 0.05, one-way ANOVA.
Figure 3.
Figure 3.
HY5 Is Involved in Supplemental FR-Induced LR Reduction. (A) LR density of 8-d-old Col-0, hyh, hy5-2, and hy5-2 hyh seedlings in WL and WL+FR. (B) Representative scans of 8-d-old seedlings. (C) Hypocotyl lengths of experiment shown in (A) and (B). (D) LRP analysis of seedlings from (A) to (C). (E) and (F) LR density and hypocotyl length of 8-d-old seedlings, Col-0, hy5-215, and Pro35S:HA-HY5 lines in WL and WL+FR. (G) Representative scans of 8-d-old seedlings from (E) and (F). Bars = 1 cm. Letters show statistically significant classes, P < 0.05, one-way ANOVA. Asterisk indicates significant statistical difference, P < 0.05, two-way-ANOVA. Error bars show se; n = 15 to 20 seedlings per treatment.
Figure 4.
Figure 4.
HY5-YFP Is Increased in the LRP and Cortex above LRP during WL+FR. (A) to (H) Representative confocal microscopy images of LRPs (white box) from 6-d-old hy5-1 ProHY5:HY5-YFP seedlings grown in either WL or WL+FR. Images are of stage 3 ([A] to [D]) and stage 5 ([E] to [H]) LRPs, YFP signal ([A], [C], [E], and [G]), and bright-field plus YFP and 4′,6-diamidino-2-phenylindole (DAPI) ([B], [D], [F], and [H]). Bars = 20 µm. (I) Quantification of LRP stages 1+2+3+4 and 5+6 of experiment shown in (A) and (H) of the nuclear YFP signal normalized against DAPI staining in the cortex and epidermis. (J) Quantification of the YFP signal from the nucleus of the cortex cell above the LRP (red arrow in [E] to [H]). Asterisk indicates statistically significant difference, P < 0.01, one-way-ANOVA. Error bars show se; for microscopy, n = 8 seedlings per treatment; for phenotyping, n = 20 seedlings per treatment.
Figure 5.
Figure 5.
In WL+FR, Auxin Is Decreased in the Cortex Overlaying Stage 4-6 LRPs. (A) to (F) Representative confocal microscopy images of 6-d-old seedlings expressing Pro35S:NLS-DII-vYFP and stained with DAPI. Bars = 20 µm. (A) and (D) DII-YFP signal of WL-grown (A) or WL+FR-grown (D) seedlings; arrow points to the nucleus of the cortex cell above the LRP. (B) and (E) DAPI staining image of (A) and (D); arrow denotes measured nucleus. (C) and (F) Bright-field image merged with YFP and DAPI signal; arrow denotes measured nucleus. (G) Quantification of DII-YFP signal of cortex nuclei situated above stage 4-6 LRPs, normalized against the DAPI signal. Letters depict significant difference (P < 0.05, Student’s t test). Error bars show se; n = 10 seedlings.
Figure 6.
Figure 6.
LR Formation Mutants Show No WL+FR-Induced LR Density Decrease. (A) Time-course analysis of LR density of Col-0 (dark circles), arf19-1 (red triangles), and arf7-1 (blue squares) in WL or WL+FR. The x axis displays days after germination. (B) Representative scans of 10-d-old seedlings from (A). Bars = 1 cm. (C) LR density 8 d after germination of Col-0, pin3-3, lax3-1, and ida-2 grown in either WL or WL+FR with representative scans shown in (D). Bars = 1 cm. (E) LRP analysis from experiment shown in (C) and (D); the arrows highlight the trend of increasing stage 1+2 and 5+6 in WL+FR Col-0 seedlings. Asterisk indicates statistical significance between WL and WL+FR, P > 0.05, one-way ANOVA. Error bars show se; n = 15 to 20 seedlings per treatment.
Figure 7.
Figure 7.
PIN3-YFP and LAX3-GFP Plasma Membrane Abundance in the Cortex Cell Overlaying the LRP Is Decreased in WL+FR Conditions and Is Regulated through HY5. (A) to (D) Representative confocal microscopy images of stage 5+6 LRPs from pin3-4 ProPIN3:PIN3-GFP seedlings in Col-0 ([A] and [B]) or hy5-2 ([C] and [D]) background grown for 6 d in WL ([A] and [C]) or WL+FR ([B] and [D]). Left panel: GFP signal (white arrowhead shows plasma membrane signal used for quantification). Middle left panel: Propidium iodide (PI) staining (white box demarcates the LRP). Middle right panel: Bright-field image. Right panel: Merge of previous three panels. (E) Quantification of the plasma membrane signal of PIN3-GFP from stage 5+6 LRPs as shown in (A) to (D) normalized against the PI staining (wt = pin3-4 ProPIN3:PIN3-GFP and hy5-2 = hy5-2 pin3-4 ProPIN3:PIN3-GFP). (F) to (I) Representative confocal microscopy images of stage 5+6 LRPs from lax3-1 ProLAX3:LAX3-YFP seedlings in Col-0 ([F] and [G]) or hy5-215 ([H] and [I]) set up and presented similarly as in (A) to (D). (J) Quantification of the plasma membrane signal of LAX3-YFP from stage 5+6 LRPs as shown in (G) to (I) normalized against the PI staining (wt = lax3-1 ProLAX3:LAX3-YFP and hy5-215 = hy5-215 lax3-1 ProLAX3:LAX3-YFP). Letters depict different statistically significant classes, P < 0.05 one-way ANOVA. Error bars show se; n = 10 to 12 seedlings per treatment. Bars = 20 µm.
Figure 8.
Figure 8.
HY5 Overexpression Leads to Lower ARF19, PIN3, and LAX3 Expression Levels. qPCR experiment using root material of 6-d-old Col-0 and Pro35S:HA-HY5 seedlings. Three biological replicates were performed with 15 seedlings per sample. Relative expression was calculated using the ΔΔCt method. Error bars show the se.
Figure 9.
Figure 9.
Enhanced Availability of HY5 under FR Enrichment Inhibits Lateral Root Emergence. Model depicting our hypothesis for the stabilization of HY5 in WL+FR (supplemental FR light, low R:FR ratio) and its subsequent action in the LRP leading to decreased LR emergence. Top part illustrates the shoot. In WL+FR, phyB is converted to the inactive form (Pr) by FR light (dark T-bar), which releases repression of PIFs, leading to shoot elongation. In WL, phyB indirectly promotes HY5 degradation (dashed T-bar), which is relieved in WL+FR, where phyA indirectly promotes HY5 stabilization (dashed arrow). HY5 indirectly represses shoot elongation in both WL and WL+FR (dashed T-bar). The size of the boxes reflects the protein amounts. Bottom part illustrates the root. HY5 is small enough to be transported to the root through the phloem and in the root HY5 can induce its own transcription (circular arrow). HY5 has a negative effect on PIN3 and LAX3 levels in the cortex overlaying the LRP, although it is not clear if this is a direct effect (dashed T-bar). One way of achieving this is to reduce the expression of ARF19 (dark T-bar and arrow). Lower PIN3 and LAX3 abundance leads to reduced auxin concentrations in the overlaying cortex cell (red box, black arrows), which is necessary for IDA induction and cell separation. Ultimately this leads to a reduced LR emergence. Red boxes are the PHYs, green boxes are auxin signaling and transport components, and HY5 is blue.

References

    1. Abbas N., Maurya J.P., Senapati D., Gangappa S.N., Chattopadhyay S. (2014). Arabidopsis CAM7 and HY5 physically interact and directly bind to the HY5 promoter to regulate its expression and thereby promote photomorphogenesis. Plant Cell 26: 1036–1052. - PMC - PubMed
    1. Alabadí D., Gallego-Bartolomé J., Orlando L., García-Cárcel L., Rubio V., Martínez C., Frigerio M., Iglesias-Pedraz J.M., Espinosa A., Deng X.W., Blázquez M.A. (2008). Gibberellins modulate light signaling pathways to prevent Arabidopsis seedling de-etiolation in darkness. Plant J. 53: 324–335. - PubMed
    1. Ballaré C.L., Pierik R. (2017). The shade-avoidance syndrome: multiple signals and ecological consequences. Plant Cell Environ. 40: 2530–2543. - PubMed
    1. Baster P., Robert S., Kleine-Vehn J., Vanneste S., Kania U., Grunewald W., De Rybel B., Beeckman T., Friml J. (2013). SCF(TIR1/AFB)-auxin signalling regulates PIN vacuolar trafficking and auxin fluxes during root gravitropism. EMBO J. 32: 260–274. - PMC - PubMed
    1. Bhalerao R.P., Eklöf J., Ljung K., Marchant A., Bennett M., Sandberg G. (2002). Shoot-derived auxin is essential for early lateral root emergence in Arabidopsis seedlings. Plant J. 29: 325–332. - PubMed

Publication types

MeSH terms

LinkOut - more resources