. 2018 Jan;8(1):170184.
doi: 10.1098/rsob.170184.

Comparative genomic analysis of the 'pseudofungus' Hyphochytrium catenoides

Affiliations

Comparative genomic analysis of the 'pseudofungus' Hyphochytrium catenoides

Guy Leonard et al. Open Biol. 2018 Jan.

Abstract

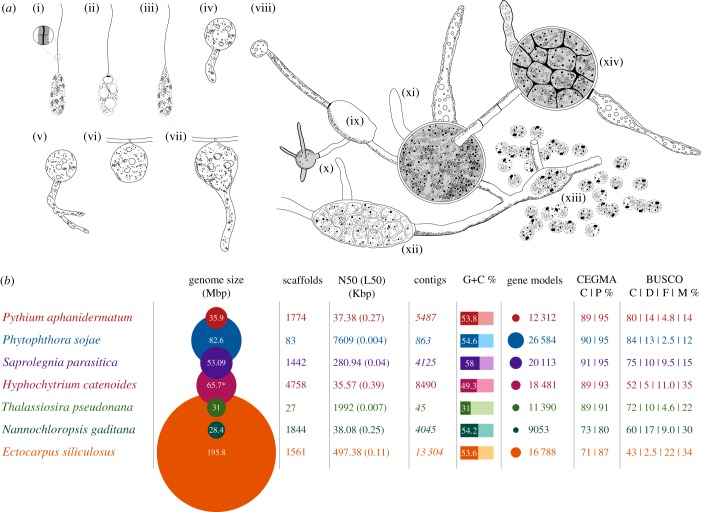
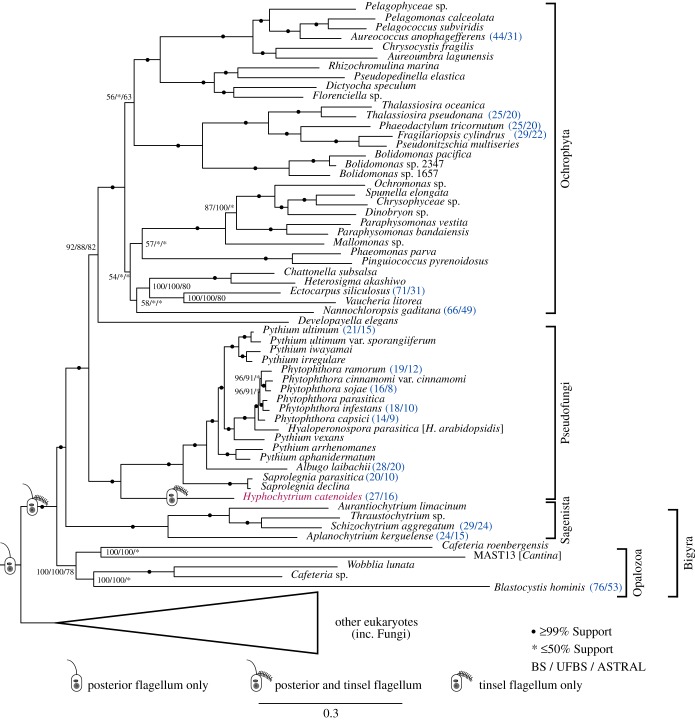
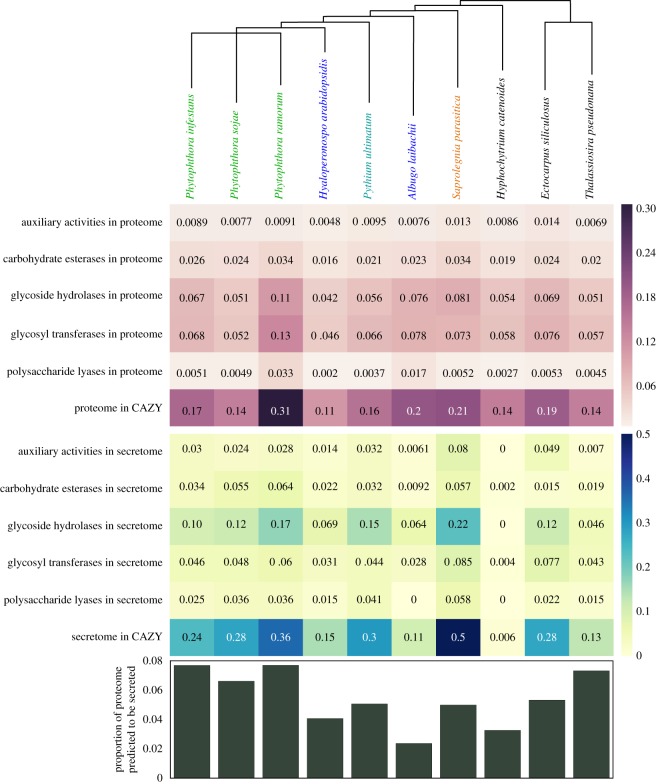
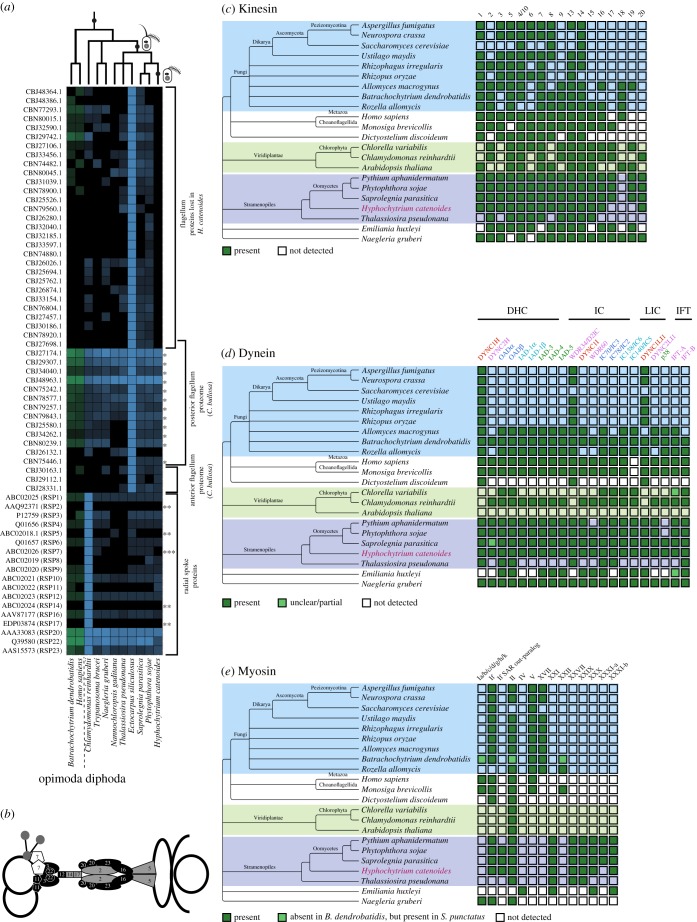
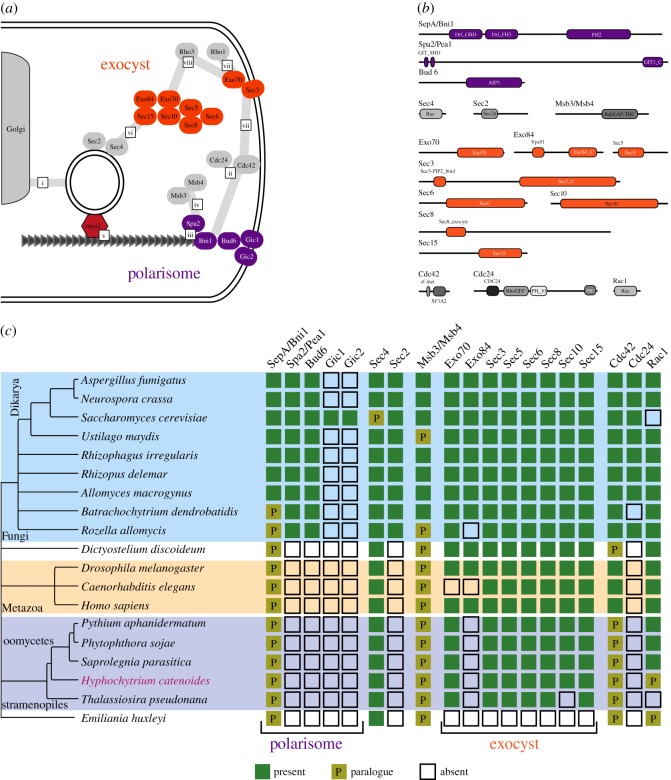
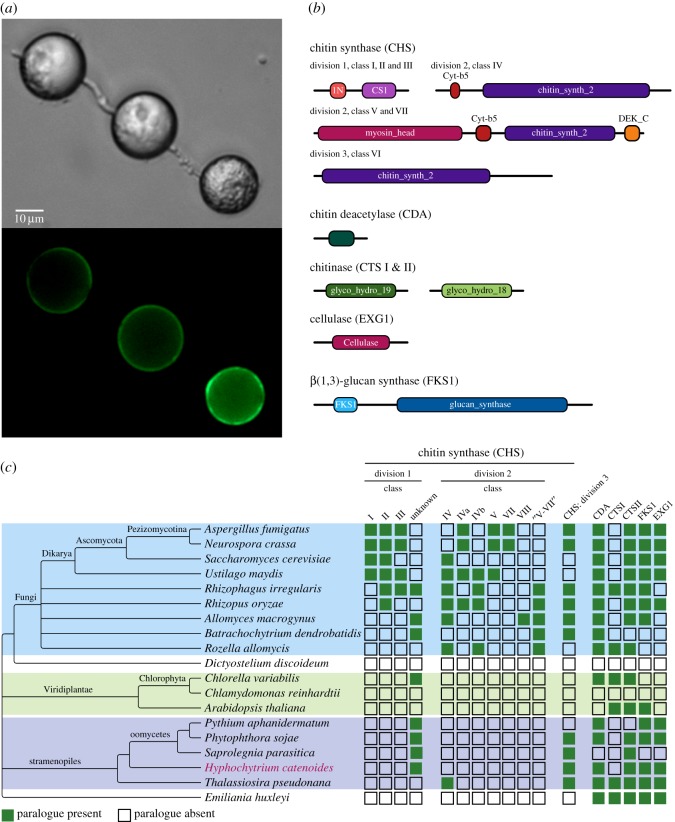
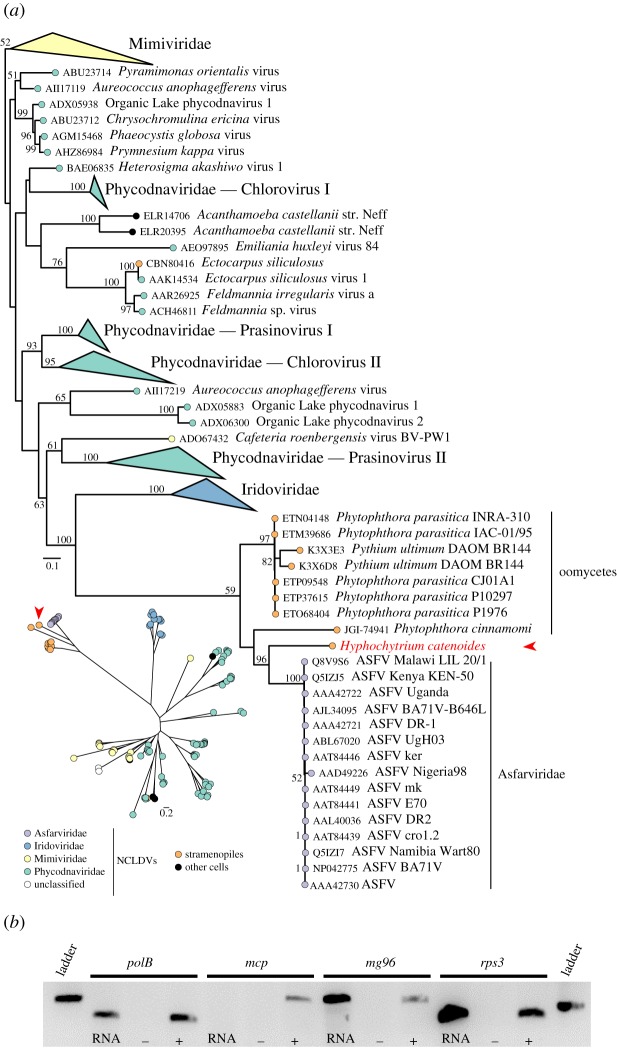
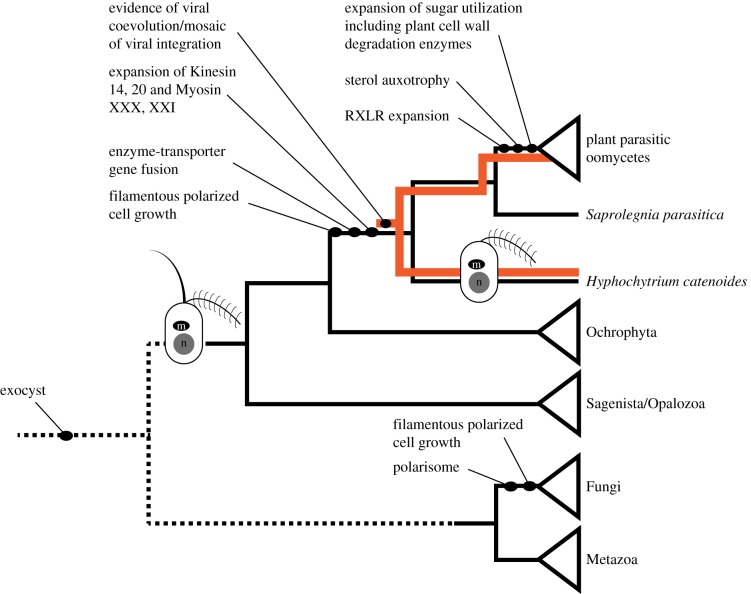
Eukaryotic microbes have three primary mechanisms for obtaining nutrients and energy: phagotrophy, photosynthesis and osmotrophy. Traits associated with the latter two functions arose independently multiple times in the eukaryotes. The Fungi successfully coupled osmotrophy with filamentous growth, and similar traits are also manifested in the Pseudofungi (oomycetes and hyphochytriomycetes). Both the Fungi and the Pseudofungi encompass a diversity of plant and animal parasites. Genome-sequencing efforts have focused on host-associated microbes (mutualistic symbionts or parasites), providing limited comparisons with free-living relatives. Here we report the first draft genome sequence of a hyphochytriomycete 'pseudofungus'; Hyphochytrium catenoides Using phylogenomic approaches, we identify genes of recent viral ancestry, with related viral derived genes also present on the genomes of oomycetes, suggesting a complex history of viral coevolution and integration across the Pseudofungi. H. catenoides has a complex life cycle involving diverse filamentous structures and a flagellated zoospore with a single anterior tinselate flagellum. We use genome comparisons, drug sensitivity analysis and high-throughput culture arrays to investigate the ancestry of oomycete/pseudofungal characteristics, demonstrating that many of the genetic features associated with parasitic traits evolved specifically within the oomycete radiation. Comparative genomics also identified differences in the repertoire of genes associated with filamentous growth between the Fungi and the Pseudofungi, including differences in vesicle trafficking systems, cell-wall synthesis pathways and motor protein repertoire, demonstrating that unique cellular systems underpinned the convergent evolution of filamentous osmotrophic growth in these two eukaryotic groups.

Keywords: large DNA virus; oomycete parasitic traits; polarized filamentous growth; secondary plastid endosymbiosis.


Conflict of interest statement

We declare we have no competing interests.

Figures

Figure 1.
Figure 1.
Developmental characteristics of H. catenoides and genome statistics of representative stramenopiles. Sketches of a subset of different stages of H. catenoides life cycle, adapted and redrawn from [6,14] showing: (i–iii) different views of zoospores (including magnification of tinselate flagellum i), (iv) germination stage of large spore, (v) primary enlargement or primary sporangium, (vi,vii) thallus development on substrate, (viii) unusual extensive branched thallus, which consists of separated sporangia at different stages of maturity (e.g. xii,xiv), connected by long, tubular, septate, hyaline and empty hyphae (x,xi), sometimes with enlargements without sporangia (e.g. ix). Zoospores may fail to swim coming to rest near exit tube (xiii). (b) Table of genome statistics for a range of different stramenopiles. Asterisk indicates k-mer estimation of genome size (column 2). All numbers are from the respective genome datasets (see electronic supplementary material, table S12). Numbers in italics (contigs, column 5) are inferred from the scaffolded data. CEGMA: C, complete; P, partial recovered gene models. BUSCO: C, complete; D, duplicated; F, fragmented; M, missing gene models.
Figure 2.
Figure 2.
A subsection of the 325 gene (90 230 amino acid) phylogeny of eukaryotes (electronic supplementary material, figure S6a) demonstrating the branching position of Hyphochytrium. Hyphochytrium highlighted in magenta. The ML tree was built using a supermatrix approach in IQ-TREE under the site heterogeneous model of evolution, LG + Γ4 + FMIX(empirical, C60) + PMSF. Values at nodes are ML bootstrap (MLBS) (100 real BS replicates in IQ-TREE LG + Γ4 + FMIX(emprical, C60) + PMSF), MLBS under the partitioned dataset using the LG + G4 model of evolution per partition (1000 ultrafast BS replicates) and 100 ASTRAL coalescence multilocus bootstrap replicates, respectively. Bootstrap values below 50% are denoted as an asterisk. Circles denote 99% or above values from all tree topology support analyses. Cartoons of cells indicate change in stramenopile flagellum morphology. Figures highlighted in blue and in parentheses after taxon names are the numbers returned by CEGMA for the complete/partial predicted frequency of 248 CEGs.
Figure 3.
Figure 3.
Comparison of secreted proteome and putative carbohydrate active proteins across the Pseudofungi including photosynthetic stramenopile taxa as an outgroup. The schematic phylogeny at the top indicates the relationship between different oomycete species with the ‘lifestyle’ of each species indicated by text colour; green (Phytophthora species) indicates plant hemibiotroph, blue (Hyaloperonospora and Albugo) obligate plant biotroph, teal (Pythium) plant necrotroph, orange (Saprolegnia) animal saprotroph/necrotroph and black indicates putatively free living (e.g. Hyphochytrium, Ectocarpus and Thalassiosira). The first heat map in white/purple indicates the proportion of proteome of each organism which was identified as belonging to a particular CAZY (www.cazy.org) category using BLASTp with an expectation of 1 × 10⁻⁵. The number listed is the proportion, and the colour relates to magnitude of the listed number (as shown by scale bar). The second heat map, in blue/yellow, indicates the proportion of the secretome (predicted via a custom pipeline https://github.com/fmaguire/predict_secretome/tree/refactor) that is identified as belonging to each of these CAZY categories. Auxiliary activities (AA) cover redox enzymes that act in conjunction with CAZY enzymes. The bar chart at the bottom shows the proportion of the proteome for each organism which is predicted to be secreted.
Figure 4.
Figure 4.
Comparative genomic analysis of H. catenoides flagellum proteome and motor protein repertoire. (a) Heat map showing sequence identity profiles for flagella proteins with putative homologues present across the eukaryotes (see, electronic supplementary material, table S4 for full dataset). The heat map identifies 29 proteins present in the oomycetes but absent in H. catenoides, suggesting that this gene had been lost at the same proximate point to the loss of the posterior flagellum. The analysis also shows 12 proteins (marked as *) identified as posterior flagellum specific in C. bullosa that are retained in H. catenoides and therefore putatively function in the anterior flagellum. Three C. bullosa anterior flagellum specific proteins are also retained in H. catenoides. The putative radial spoke proteome also shows numerous losses similar to Ho. sapiens (**), this includes the loss of RSP7 (***). Only changes in flagella cytology relevant to the evolution of the stramenopiles are sketched on the top tree. (b) Shows a cartoon of the radial spoke protein complex identified in Chlamydomonas with each shape number referring to the RPS number [70]. Black shapes illustrate proteins of the spoke complex conserved across the eukaryotes sampled, grey are non-conserved proteins (showing evidence of mosaic loss), while the white complex refers to RPS7 which, although absent in Ho. sapiens and other eukaryotes, has been lost separately and is consistent with the loss of the posterior flagellum in the ancestor of H. catenoides. (c) Distribution of major kinesin paralogue families. Kinesin-2, -9, -16 and -17 have been suggested to have function associated with the flagellum [71]. (d) Distribution of major dynein paralogue families. Paralogues are grouped according to the class of component: dynein heavy chain (DHC), intermediate chain (IC), light-intermediate chain (LIC) and intraflagellar transport (IFT), and coloured according to function (red, cytoplasmic; magenta, IFT; dark blue, axonemal outer-arm; light blue, axonemal inner-arm; green, axonemal single-headed). (e) Distribution of major myosin paralogue families focusing on variation between Fungi and Pseudofungi.
Figure 5.
Figure 5.
Comparative genomic analysis of gene families that function in polarized filamentous growth in the Fungi. (a) Cartoon outlining proteins and complexes involved in polarized growth in Saccharomyces cerevisiae (this is a variation of a figure shown in [80]). Vesicles are delivered from the Golgi (a(i)) along cytoskeleton tracks to predetermined sites on the plasma membrane. Cdc42p is activated by Cdc24p (a(ii)) promoting [84] assembly of the polarisome complex (a(iii)) resulting in the formin Bni1p radiating actin cables [85,86]. Msb3p and Msb4p interact with Spa2 in the polarisome (a(iv)) which is thought to recruit Cdc42 from the cytosol at the site of tip growth [87]. Post-Golgi secretory vesicles are transported along actin cables using a type V myosin motor protein [88,89] (a(v)), to dock with the exocyst complex in a process dependent on Sec4 and its GEF Sec2 [90,91] (a(vi)) and so the vesicle is guided to its target site on the plasma membrane [92]. Cdc42p and Rho1 are required for localization of Sec3p, which together form a spatial marker for the exocyst (a(vii)) and Rho3p and Cdc42p mediate vesicle docking (a(viii)). Cdc42p plays a key role in regulating these processes in S. cerevisiae but in Pezizomycotina and basidiomycete fungi equivalent functions are performed by Rac1p [93,94]. (b) The domain architecture of the 17 proteins associated with polarized growth in fungi. (c) The taxon distribution of putative homologues of polarized growth proteins across a representative set of taxa including the Pseudofungi. ‘P’ indicates a putative paralogue relationship as identified using phylogenetic analysis.
Figure 6
Figure 6
Comparative genomic analysis of gene families that function in cell-wall synthesis. (a) Micrographs showing the wheat germ agglutinin fluorescent staining of a chitin cell wall on Hyphochytrium structures. (b) The domain architecture of eight proteins that function in cell-wall synthesis. (c) The taxon distribution of putative gene families associated with cell-wall synthesis across a representative set of taxa including the Pseudofungi.
Figure 7.
Figure 7.
Phylogeny of viral MCP proteins indicating the branching position of the pseudofungal genes and evidence of transcription of viral derived genes in H. catenoides. (a) Homologous sequences were identified using three psi-BLAST iterations with H. catenoides putative MCP as query; to remove sequence redundancies, retrieved sequences were clustered at 90% amino acid identity with cd-hit v4.6. Sequences were then aligned using MAFFT v7 iterative, global homology mode (G-INS-i); alignment sites retained for subsequent phylogenetic analysis were selected using trimAL [110] gap distribution mode. Final MCP multiple sequence alignment was composed of 386 sites. ML tree was inferred using IQ-TREE v1.3 and LG + I + Γ4 + F model (determined as the best-fitting model by Bayesian information criterion). Node supports were evaluated with 100 non-parametric bootstrap replicates. The Mimiviridae clade was used to root the ML tree (unrooted version displayed on the lower left part). (b) RT-PCR showing expression of polB and mg96 viral genes alongside an rps3 positive control. No expression of the mcp gene was detected. RT-PCR was performed on H. catenoides RNA alongside genomic DNA (+) and no-template (−) controls, with PCR products run on an agarose gel alongside a 1 kb ladder (Promega; 250 bp shown).
Figure 8.
Figure 8.
Schematic phylogenetic tree summarizing the evolution of cell and genomic characters relevant to the evolution of the Pseudofungi. Only changes in flagella complement relevant to the evolution of the stramenopiles are sketched.

References

    1. Patterson DJ. 1989. Stamenopiles: chromophytes from a protistan perspective. In The chromophyte algae, problems and perspectives. (eds Green JC, Leadbeater BSC, Diver WL), pp. 357–379. Oxford, UK: Clarendon.
    1. Cavalier-Smith T. 1986. The kingdom Chromista: origin and systematics. In Progress in phycological research (eds Round FE, Chapman DJ), pp. 309–347. Bristol, UK: Biopress Ltd.
    1. Cavalier-Smith T, Chao EE. 2006. Phylogeny and megasystematics of phagotrophic heterokonts (kingdom Chromista). J. Mol. Evol. 62, 388–420. (doi:10.1007/s00239-004-0353-8) - DOI - PubMed
    1. Cavalier-Smith T. 1987. The origin of fungi and pseudofungi. In Evolutionary biology of the fungi (British mycological society symposia). (ed. Rayer ADM.), pp. 339–353. Cambridge, UK: Cambridge University Press.
    1. Burki F, Kaplan M, Tikhonenkov DV, Zlatogursky V, Minh BQ, Radaykina LV, Smirnov A, Mylnikov AP, Keeling PJ. 2016. Untangling the early diversification of eukaryotes: a phylogenomic study of the evolutionary origins of Centrohelida, Haptophyta and Cryptista. Proc. R. Soc. B 283, 20152802 (doi:10.1098/rspb.2015.2802) - DOI - PMC - PubMed

Publication types

LinkOut - more resources