. 2018 Feb 5;150(2):307-321.
doi: 10.1085/jgp.201711882. Epub 2018 Jan 10.

Nonsensing residues in S3-S4 linker's C terminus affect the voltage sensor set point in K+ channels

Affiliations

Nonsensing residues in S3-S4 linker's C terminus affect the voltage sensor set point in K+ channels

Joao L Carvalho-de-Souza et al. J Gen Physiol. .

Abstract

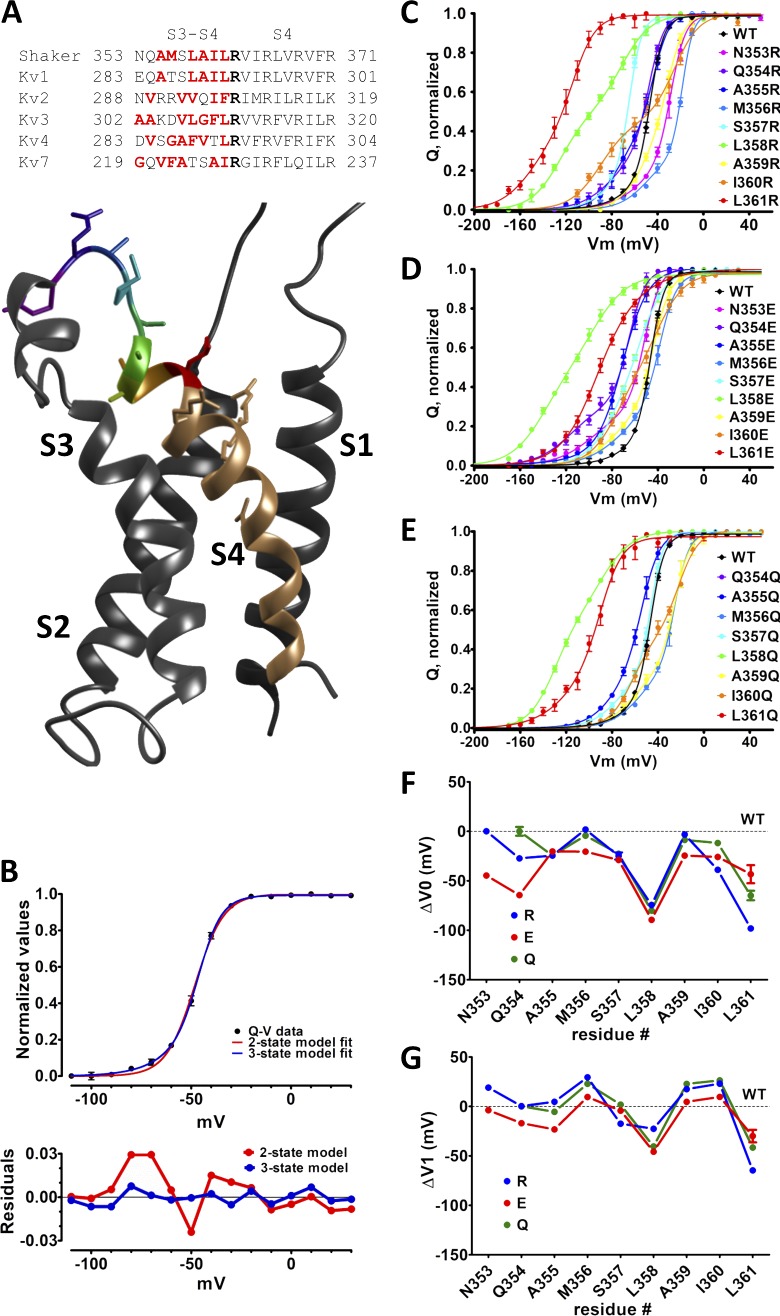
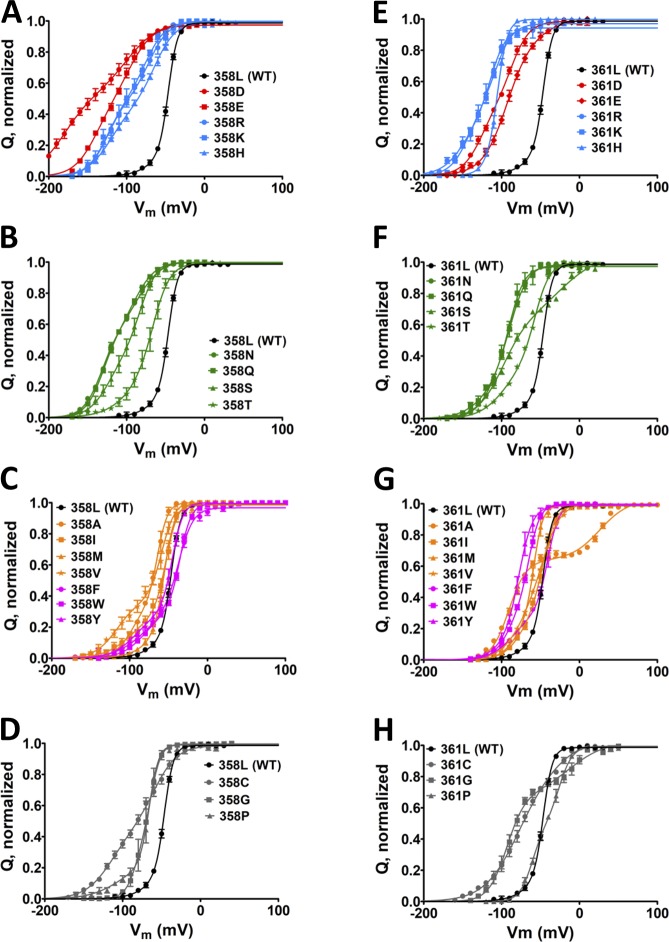
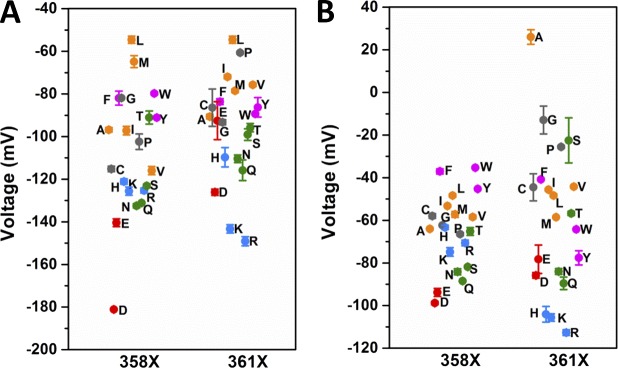
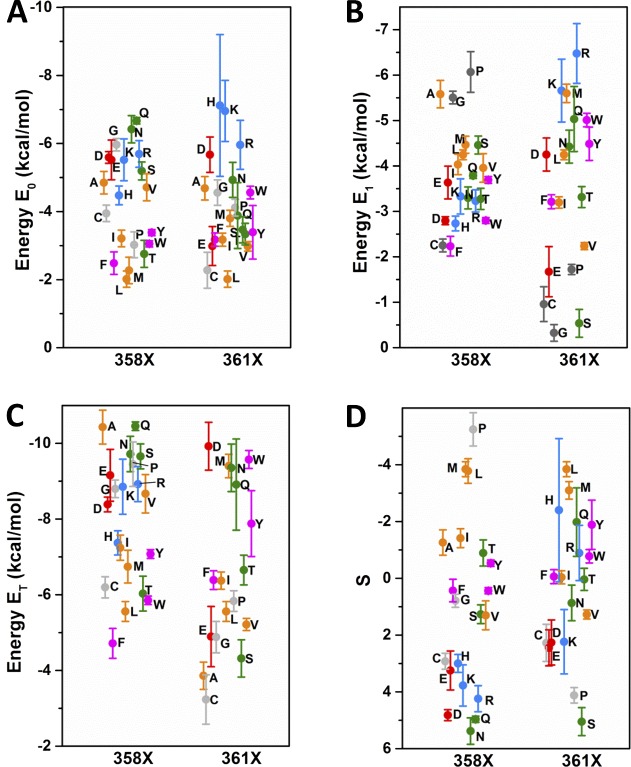
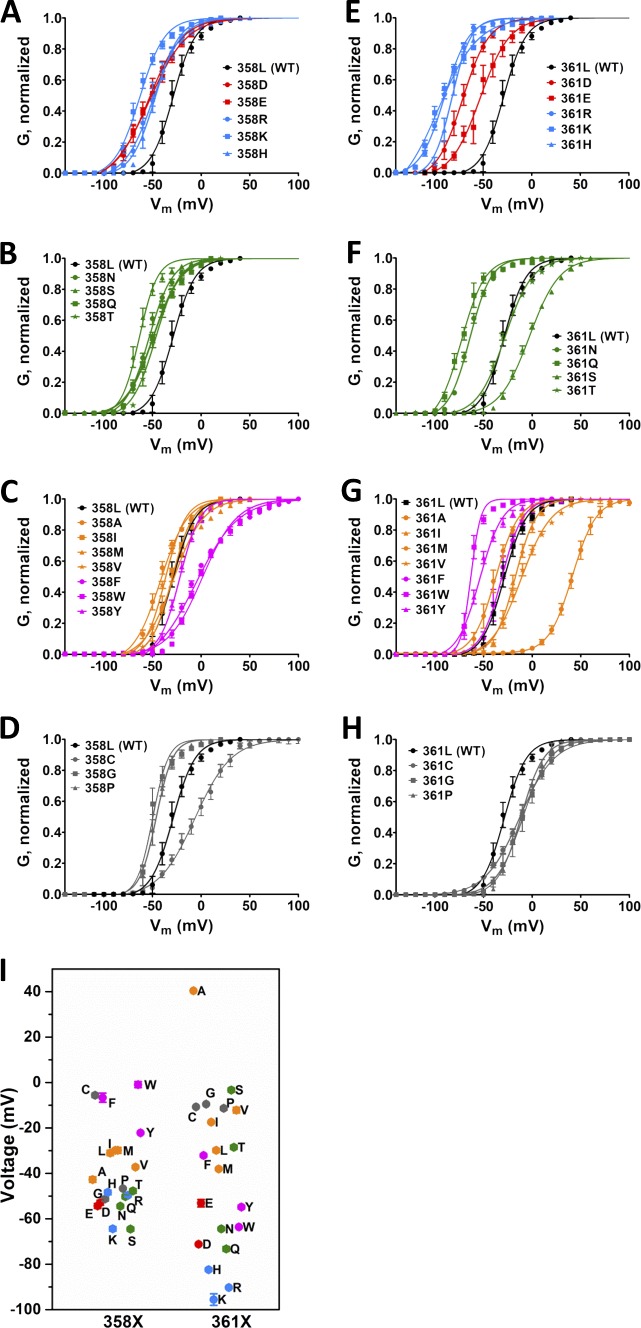
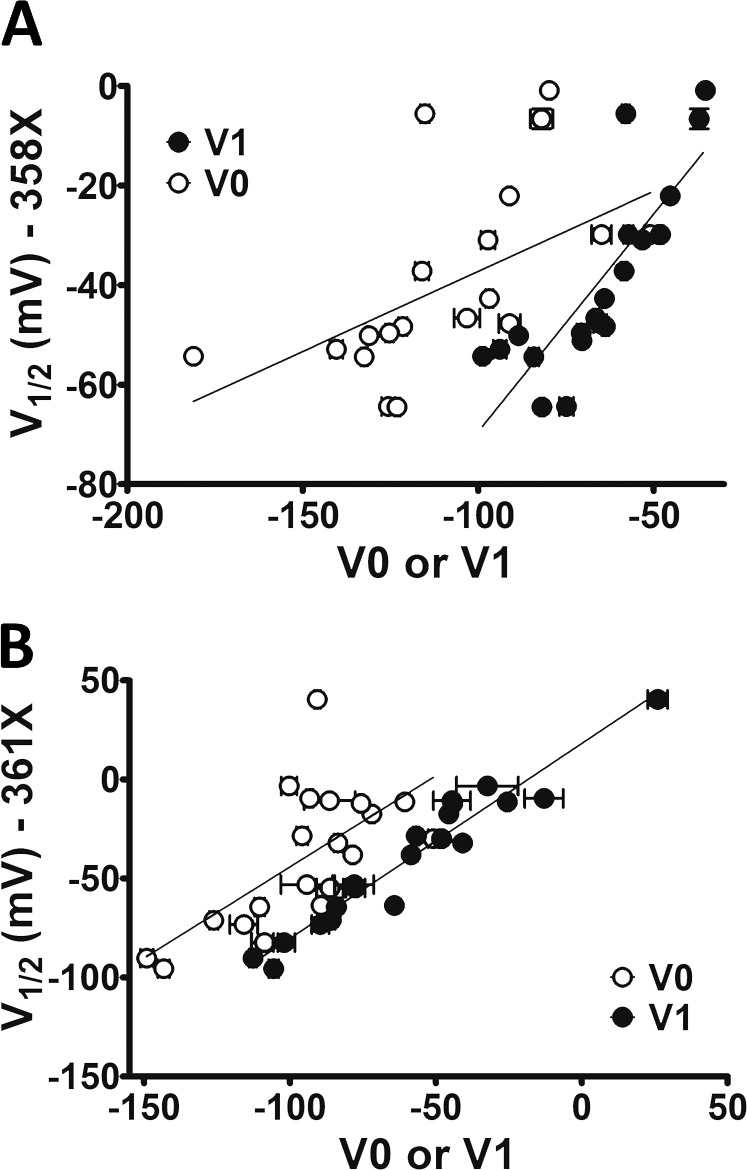
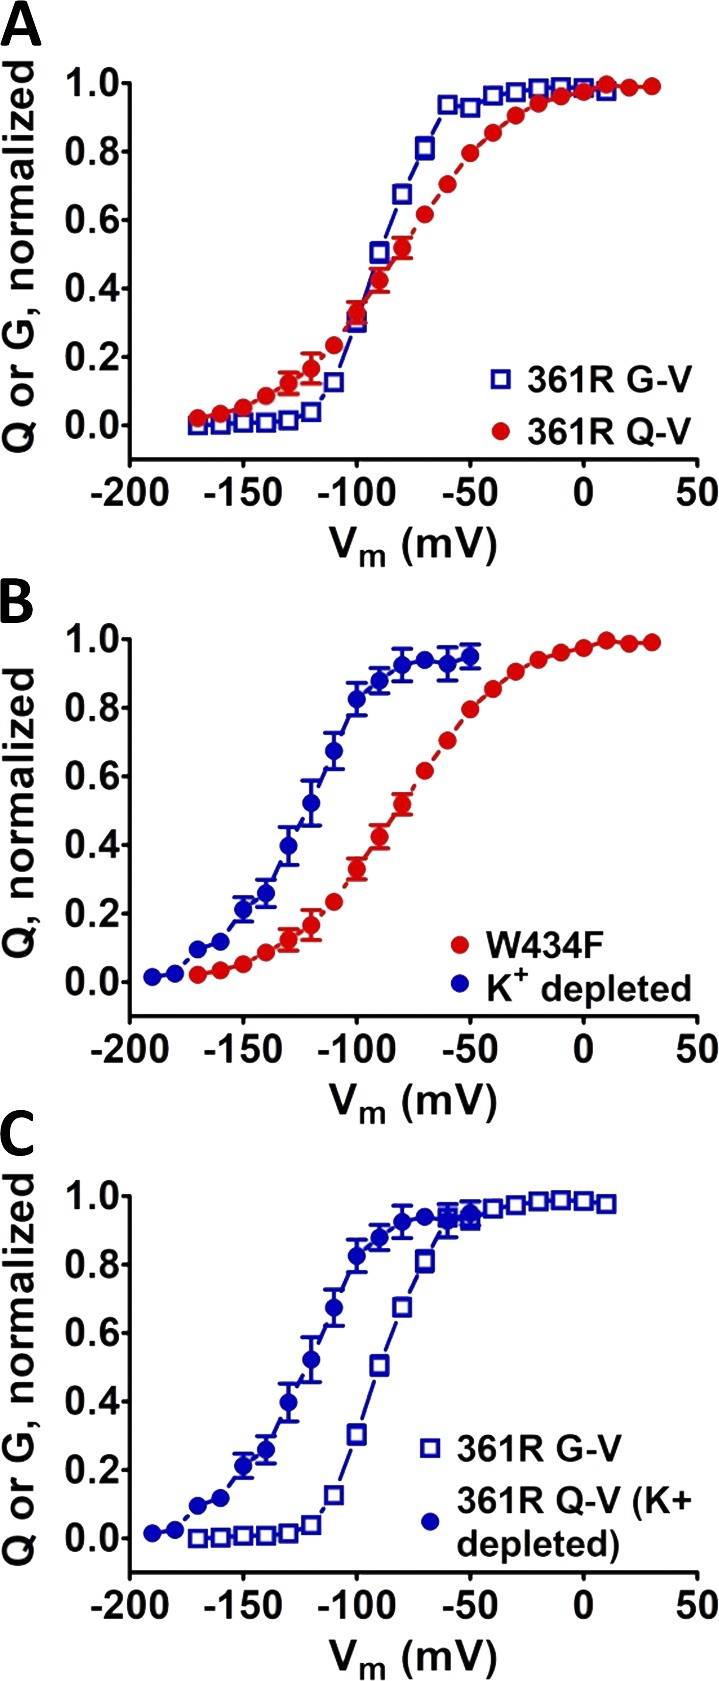
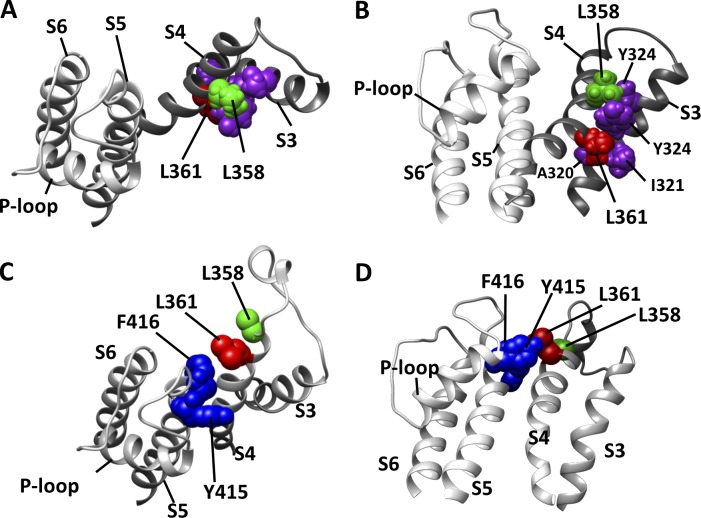
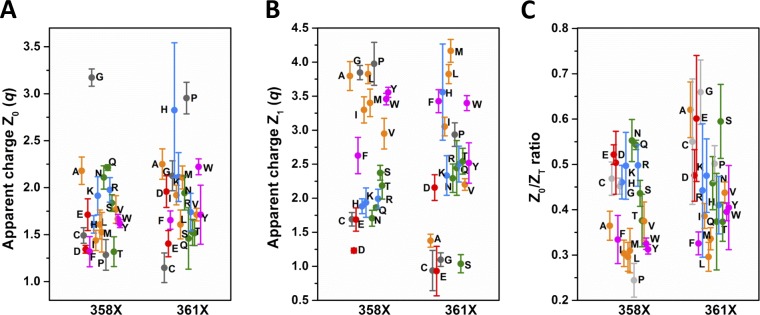
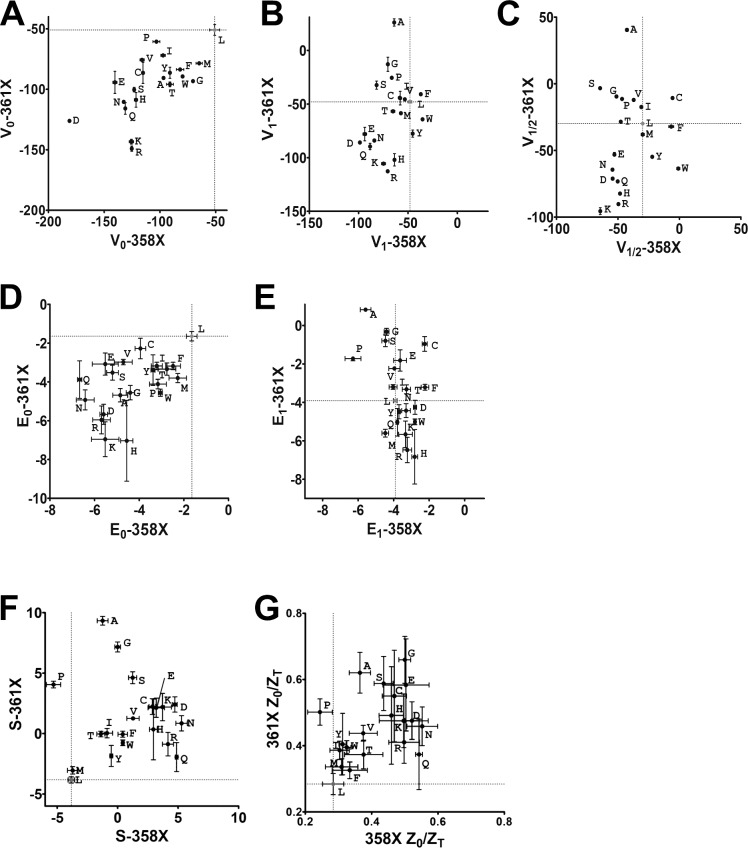
Voltage sensitivity in ion channels is a function of highly conserved arginine residues in their voltage-sensing domains (VSDs), but this conservation does not explain the diversity in voltage dependence among different K+ channels. Here we study the non-voltage-sensing residues 353 to 361 in Shaker K+ channels and find that residues 358 and 361 strongly modulate the voltage dependence of the channel. We mutate these two residues into all possible remaining amino acids (AAs) and obtain Q-V and G-V curves. We introduced the nonconducting W434F mutation to record sensing currents in all mutants except L361R, which requires K+ depletion because it is affected by W434F. By fitting Q-Vs with a sequential three-state model for two voltage dependence-related parameters (V0, the voltage-dependent transition from the resting to intermediate state and V1, from the latter to the active state) and G-Vs with a two-state model for the voltage dependence of the pore domain parameter (V1/2), Spearman's coefficients denoting variable relationships with hydrophobicity, available area, length, width, and volume of the AAs in 358 and 361 positions could be calculated. We find that mutations in residue 358 shift Q-Vs and G-Vs along the voltage axis by affecting V0, V1, and V1/2 according to the hydrophobicity of the AA. Mutations in residue 361 also shift both curves, but V0 is affected by the hydrophobicity of the AA in position 361, whereas V1 and V1/2 are affected by size-related AA indices. Small-to-tiny AAs have opposite effects on V1 and V1/2 in position 358 compared with 361. We hypothesize possible coordination points in the protein that residues 358 and 361 would temporarily and differently interact with in an intermediate state of VSD activation. Our data contribute to the accumulating knowledge of voltage-dependent ion channel activation by adding functional information about the effects of so-called non-voltage-sensing residues on VSD dynamics.


Figures

Figure 1.
Figure 1.
Residues L358 and L361 in nonconducting Shaker modulates the voltage dependence of its VSD. (A) S3–S4 linker and S4 sequences from Shaker and other voltage-dependent K+ channels, aligned by the putative first sensing charge (bold). For better distinction, hydrophilic residues are in red. A side view of KV1.2 (PDB code 3LUT) is shown with the residues 353 to 361 colored individually. (B) WT Shaker Q-V curve fittings with a two- and a three-state model (see Materials and methods for details) for comparison (top) and the respective residuals (bottom) are shown. (C–E) Q-V curves displaying average (symbols) and SEMs (vertical bars) from Shaker mutated with R (in C), E (in D) or Q (in E), separately in each of the nine residues 353–361 in the S3–S4 linker. All continuous lines are the best fit of three-state model (see Materials and methods). The color code in all Q-V curves matches the one used in the structure shown in A. In all plots, vertical bars from the colored symbols representing each data point denote the SEM. (F and G) The fitted parameters V0 and V1 are shown in F and G, respectively.
Figure 2.
Figure 2.
Q-V curves from both AA scans, L358 and L361, in nonconducting Shaker. (A–H) Averaged Q-V curves from L358X (A–D) and L361X (E–H). For a better visual, in each of the scans, charged AAs (D, E, R, H, and K) mutants are shown in A and E, polar AAs (N, Q, S, and T) mutants are shown in B and F, hydrophobic including aromatic AAs (A, I, L, M, V, F, W, and Y) mutants are shown in C and G, and special case AAs (C, G, and P) mutants are shown in D and H. For reference, the Q-V curves for WT channels are shown in black in all graphs. In all plots, vertical bars from the colored symbols representing each data point denote the SEM. Continuous lines are the best fit of the three-state model (see Materials and methods).
Figure 3.
Figure 3.
Set of voltages V0 and V1 from L358X and L361X taken from fits with three-state model for VSD activation. (A and B) V0 (A) and V1 (B) distributions from each mutant, from both scans as indicated in the graphs. The color code in the plot is the same as that used in Fig. 2. The SEM is plotted from each respective data point represented by the colored symbols.
Figure 4.
Figure 4.
Sets of energies E0, E1, and ET and factor S values from L358X and L361X. See Materials and methods for details. (A–D) Distribution from both scans as indicated in the graphs of the energy values involved in the first step of the three-state model for VSD activation, E0 (A); in the second step, E1 (B); the sum E0 + E1, ET (C); and the factor S, proportional to the stability of the intermediate state of the VSD (D). The color code in the plot is the same as that used in Fig. 2. The SEM is plotted from each respective data point represented by the colored symbols.
Figure 5.
Figure 5.
G-V curves from all AA scans of L358 and L361. (A–H) Averaged G-V curves from L358X (A–D) and L361X (E–H). For a better view, in each of the scans, mutations into charged AAs (D, E, R, H, and K) are shown in A and E, polar AAs (N, Q, S, and T) in B and F, hydrophobic AAs including aromatic amino acids (A, I, L, M, V, F, W, and Y) in C and G, and special cases AAs (C, G, and P) in D and H. For comparison, the G-V curves from WT channels is shown in all graphs. Continuous lines are the best fit of a two-state model to the data (see Materials and methods). (I) The fitted voltage V1/2 from both scans are shown with the color code in the plot is the same as that used in Fig. 2. In all plots, vertical bars from the colored symbols representing each data point denote the SEM.
Figure 6.
Figure 6.
V1/2from G-Vs correlates with V1 from respective Q-Vs as expected for a VSD-to-PD coupling preservation. (A) V1/2 values from L358X scan were plotted with their respective V0 and V1. rS coefficients were 0.70 and 0.91 for V0 and V1, respectively. (B) V1/2 values from L361X plotted with their respective V0 and V1, with rS of 0.58 and 0.96, respectively. Vertical and horizontal bars represent the SEM of the parameter V1/2 and V0 or V1, according to the legend, respectively.
Figure 7.
Figure 7.
Mutation W434F in PD affects VSD voltage sensitivity in L361R. The voltage dependence of the 361R mutant VSD is affected W434F mutation in the PD. (A) Q-V and G-V curves in channels containing the L361R mutation in the VSD, unusually crossing each other. Q-V curves were calculated from integrated sensing currents recorded by blocking K+ conductance with the W434F mutation. (B) Q-V curves recorded with W434F mutations and by depleting K+ from inside the cells evidencing the effect of the W434F mutation on 361R mutant VSD. (C) Comparison between Q-V and G-V curves, in both cases without the W434F mutation showing the expected relative voltage dependence. Vertical bars from the data points denote the SEM of each respective data point.
Figure 8.
Figure 8.
Relative positions of L358 and L361 residues from Shaker in the resting and active states as predicted by KV1.2 models. (A and B) Top view (A) and side view (B) of the resting state of the VSD as predicted by a structural- and functional-data-based consensus resting model (Vargas et al., 2011). The panels show S3 and S4 from the consensus model and S5, P-loop, and S6 from a neighbor channel subunit, from a crystallography-derived model of KV1.2 (PDB code 3LUT). Only pertinent residues are shown with spheres representing the Van der Waals volume of each atom. The color code is the following—magenta: residues I321, Y324, and T326 from S3; green: L358; red, L361. (C and D) Top view (C) and side view (D) of the active state of the VSD as predicted by a crystallography-derived model of KV1.2. Highlighted residues are also shown as spheres in the same way as in A and B, with residues L358 in green, L361 in red, and Y415 and F416, both from S5, in blue.
Figure 9.
Figure 9.
Apparent charges Z0 and Z1 and the ratio Z0/ZT, (ZT = Z0+ Z1) from mutant voltage sensors in L358X and L361X scans. (A and B) In A and B, respectively, Z0 and Z1 for all mutant voltage sensors, color coded as in Fig. 2, are shown along with SEMs. (C) All mutations in both 358 and 361 positions increase Z0/ZT ratio, except for L358P. The SEM is plotted from each respective data point represented by the colored symbols.
Figure 10.
Figure 10.
Comparisons between parameters from L358X and L361X show crucial differences between the scans. In all plots, data points are labeled by the mutation they are representing. Vertical and horizontal lines are at the WT values in x and y axis, splitting the plotting area into four quadrants. Data points in odd quadrants show the mutation has similar effects either in L358X and L361X. Data points in the even quadrants include cases where the same mutation has opposite effects when in L358X or L361X. (A) V0. (B) V1. (C) V1/2. (D) E0. (E) E1. (F) Z0/ZT. (G) Factor S (see Materials and methods for details). Bars represent the SEM.

References

    1. Bezanilla F., and Armstrong C.M.. 1977. Inactivation of the sodium channel. I. Sodium current experiments. J. Gen. Physiol. 70:549–566. 10.1085/jgp.70.5.549 - DOI - PMC - PubMed
    1. Bezanilla F., and Villalba-Galea C.A.. 2013. The gating charge should not be estimated by fitting a two-state model to a Q-V curve. J. Gen. Physiol. 142:575–578. 10.1085/jgp.201311056 - DOI - PMC - PubMed
    1. Cha A., and Bezanilla F.. 1997. Characterizing voltage-dependent conformational changes in the Shaker K+ channel with fluorescence. Neuron. 19:1127–1140. 10.1016/S0896-6273(00)80403-1 - DOI - PubMed
    1. Chen X., Wang Q., Ni F., and Ma J.. 2010. Structure of the full-length Shaker potassium channel Kv1.2 by normal-mode-based X-ray crystallographic refinement. Proc. Natl. Acad. Sci. USA. 107:11352–11357. 10.1073/pnas.1000142107 - DOI - PMC - PubMed
    1. Elinder F., Madeja M., Zeberg H., and Århem P.. 2016. Extracellular linkers completely transplant the voltage dependence from Kv1.2 ion channels to Kv2.1. Biophys. J. 111:1679–1691. 10.1016/j.bpj.2016.08.043 - DOI - PMC - PubMed

Publication types

MeSH terms

Substances

Associated data

LinkOut - more resources