

Germ Line IgM Is Sufficient, but Not Required, for Antibody-Mediated Alphavirus Clearance from the Central Nervous System
- PMID: 29321331
- PMCID: PMC5972861
- DOI: 10.1128/JVI.02081-17
Germ Line IgM Is Sufficient, but Not Required, for Antibody-Mediated Alphavirus Clearance from the Central Nervous System
Abstract
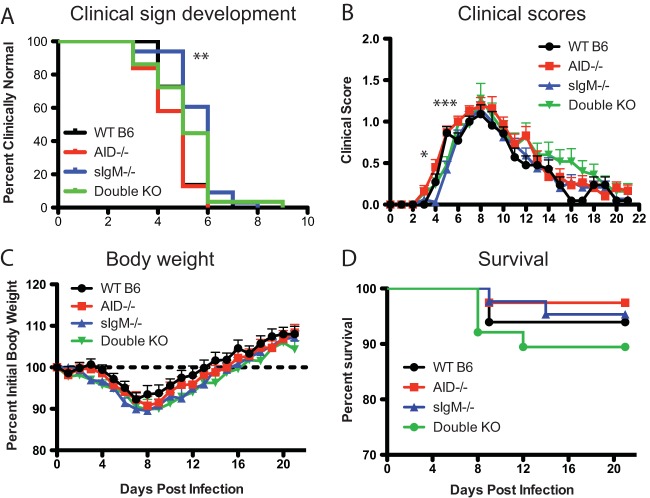
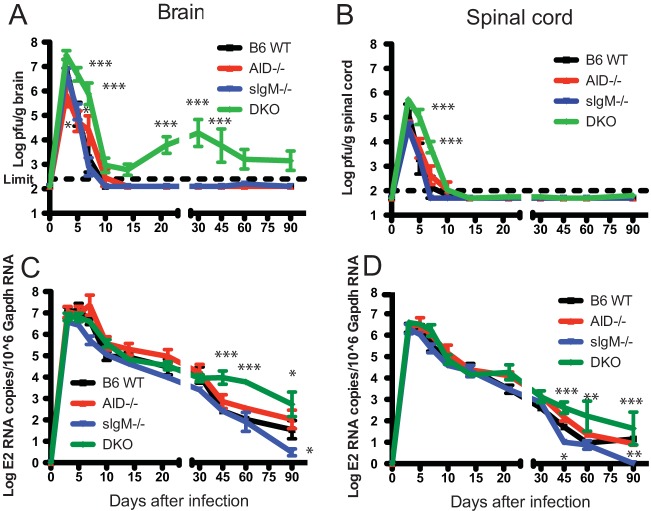
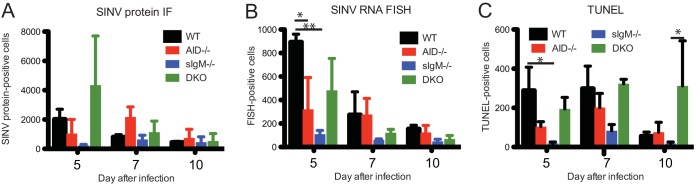
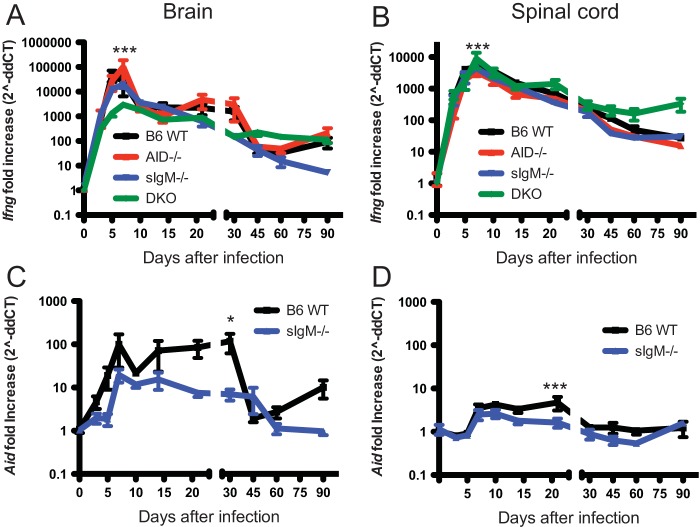
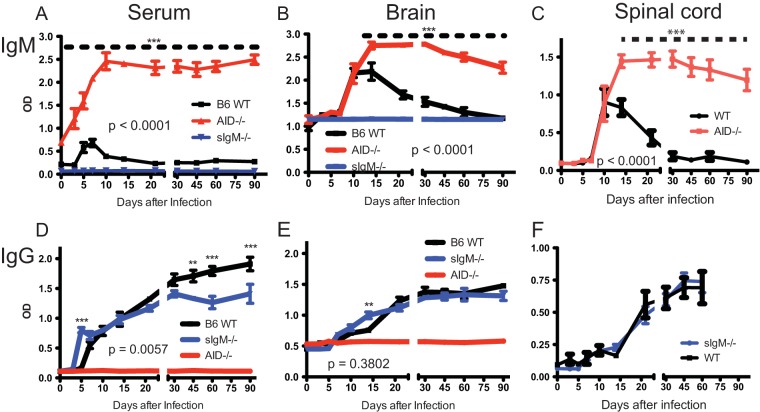
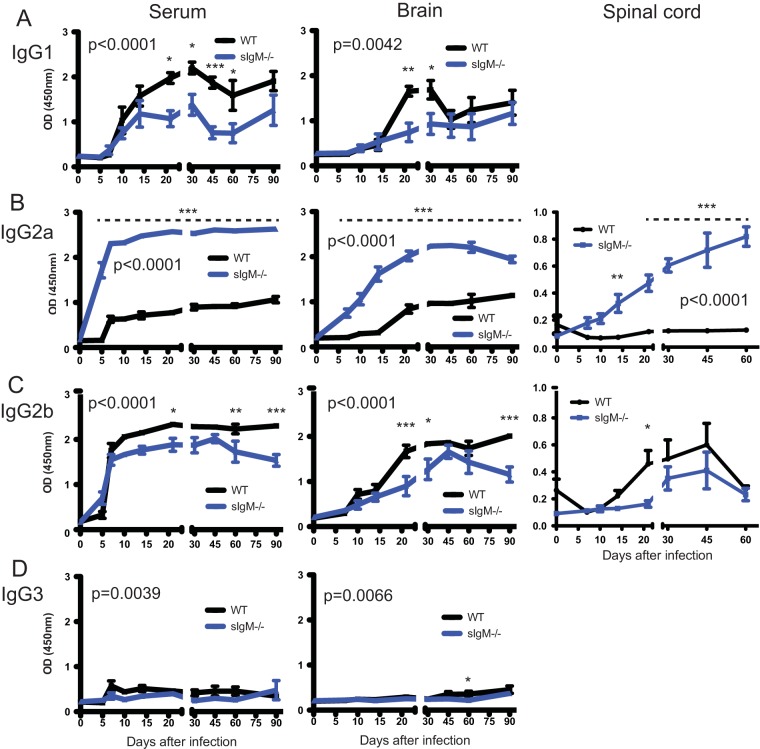
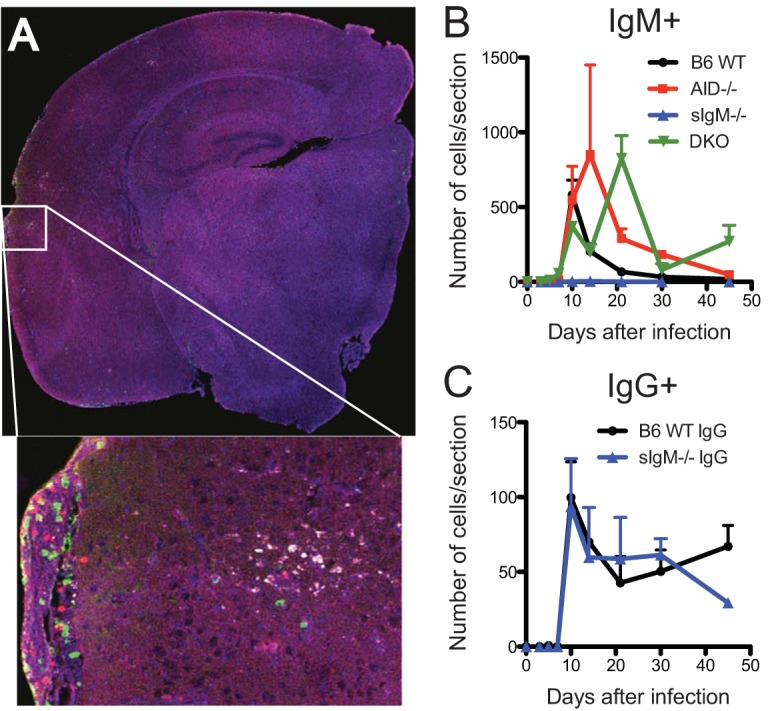
Sindbis virus (SINV) infection of neurons in the brain and spinal cord in mice provides a model system for investigating recovery from encephalomyelitis and antibody-mediated clearance of virus from the central nervous system (CNS). To determine the roles of IgM and IgG in recovery, we compared the responses of immunoglobulin-deficient activation-induced adenosine deaminase-deficient (AID-/-), secretory IgM-deficient (sIgM-/-), and AID-/- sIgM-/- double-knockout (DKO) mice with those of wild-type (WT) C57BL/6 mice for disease, clearance of infectious virus and viral RNA from brain and spinal cord, antibody responses, and B cell infiltration into the CNS. Because AID is essential for immunoglobulin class switch recombination and somatic hypermutation, AID-/- mice produce only germ line IgM, while sIgM-/- mice secrete IgG but no IgM and DKO mice produce no secreted immunoglobulin. After intracerebral infection with the TE strain of SINV, most mice recovered. Development of neurologic disease occurred slightly later in sIgM-/- mice, but disease severity, weight loss, and survival were similar between the groups. AID-/- mice produced high levels of SINV-specific IgM, while sIgM-/- mice produced no IgM and high levels of IgG2a compared to WT mice. All mice cleared infectious virus from the spinal cord, but DKO mice failed to clear infectious virus from brain and had higher levels of viral RNA in the CNS late after infection. The numbers of infected cells and the amount of cell death in brain were comparable. We conclude that antibody is required and that either germ line IgM or IgG is sufficient for clearance of virus from the CNS.IMPORTANCE Mosquito-borne alphaviruses that infect neurons can cause fatal encephalomyelitis. Recovery requires a mechanism for the immune system to clear virus from infected neurons without harming the infected cells. Antiviral antibody has previously been shown to be a noncytolytic means for alphavirus clearance. Antibody-secreting cells enter the nervous system after infection and produce antiviral IgM before IgG. Clinical studies of human viral encephalomyelitis suggest that prompt production of IgM is associated with recovery, but it was not known whether IgM is effective for clearance. Our studies used mice deficient in production of IgM, IgG, or both to characterize the antibody necessary for alphavirus clearance. All mice developed similar signs of neurologic disease and recovered from infection. Antibody was necessary for virus clearance from the brain, and either early germ line IgM or IgG was sufficient. These studies support the clinical observation that prompt production of antiviral antibody is a determinant of outcome.
Keywords: Sindbis virus; antibody; mice; neurons; viral encephalomyelitis; virus clearance.
Copyright © 2018 American Society for Microbiology.
Figures

Similar articles
-
Interleukin-10 Modulation of Virus Clearance and Disease in Mice with Alphaviral Encephalomyelitis.J Virol. 2018 Feb 26;92(6):e01517-17. doi: 10.1128/JVI.01517-17. Print 2018 Mar 15. J Virol. 2018. PMID: 29263262 Free PMC article.
-
Synergistic roles of antibody and interferon in noncytolytic clearance of Sindbis virus from different regions of the central nervous system.J Virol. 2007 Jun;81(11):5628-36. doi: 10.1128/JVI.01152-06. Epub 2007 Mar 21. J Virol. 2007. PMID: 17376910 Free PMC article.
-
Alphavirus-induced encephalomyelitis: antibody-secreting cells and viral clearance from the nervous system.J Virol. 2011 Nov;85(21):11490-501. doi: 10.1128/JVI.05379-11. Epub 2011 Aug 24. J Virol. 2011. PMID: 21865385 Free PMC article.
-
The role of antibody in recovery from alphavirus encephalitis.Immunol Rev. 1997 Oct;159:155-61. doi: 10.1111/j.1600-065x.1997.tb01013.x. Immunol Rev. 1997. PMID: 9416509 Review.
-
Recovery from viral encephalomyelitis: immune-mediated noncytolytic virus clearance from neurons.Immunol Res. 2010 Jul;47(1-3):123-33. doi: 10.1007/s12026-009-8143-4. Immunol Res. 2010. PMID: 20087684 Free PMC article. Review.
Cited by
-
Editorial: Immunotherapy for Tumor in the Brain: Insights From-and For-Other Tumor Sites.Front Oncol. 2018 Apr 27;8:128. doi: 10.3389/fonc.2018.00128. eCollection 2018. Front Oncol. 2018. PMID: 29755955 Free PMC article. No abstract available.
-
Phenotypic and transcriptional changes in peripheral blood mononuclear cells during alphavirus encephalitis in mice.mBio. 2024 Jun 12;15(6):e0073624. doi: 10.1128/mbio.00736-24. Epub 2024 May 2. mBio. 2024. PMID: 38695564 Free PMC article.
-
Interferon regulatory factors 3 and 7 have distinct roles in the pathogenesis of alphavirus encephalomyelitis.J Gen Virol. 2019 Jan;100(1):46-62. doi: 10.1099/jgv.0.001174. Epub 2018 Nov 19. J Gen Virol. 2019. PMID: 30451651 Free PMC article.
-
Acute RNA Viral Encephalomyelitis and the Role of Antibodies in the Central Nervous System.Viruses. 2020 Sep 5;12(9):988. doi: 10.3390/v12090988. Viruses. 2020. PMID: 32899509 Free PMC article. Review.
-
Both ADP-Ribosyl-Binding and Hydrolase Activities of the Alphavirus nsP3 Macrodomain Affect Neurovirulence in Mice.mBio. 2020 Feb 11;11(1):e03253-19. doi: 10.1128/mBio.03253-19. mBio. 2020. PMID: 32047134 Free PMC article.
References
-
- Jackson AC, Moench TR, Trapp BD, Griffin DE. 1988. Basis of neurovirulence in Sindbis virus encephalomyelitis of mice. Lab Invest 58:503–509. - PubMed
Publication types
MeSH terms
Substances
Grants and funding
LinkOut - more resources
Full Text Sources
Other Literature Sources
Research Materials
