. 2018 Jan 11;3(1):e97199.
doi: 10.1172/jci.insight.97199.

Development of an airway mucus defect in the cystic fibrosis rat

Affiliations

Development of an airway mucus defect in the cystic fibrosis rat

Susan E Birket et al. JCI Insight. .

Abstract

The mechanisms underlying the development and natural progression of the airway mucus defect in cystic fibrosis (CF) remain largely unclear. New animal models of CF, coupled with imaging using micro-optical coherence tomography, can lead to insights regarding these questions. The Cftr-/- (KO) rat allows for longitudinal examination of the development and progression of airway mucus abnormalities. The KO rat exhibits decreased periciliary depth, hyperacidic pH, and increased mucus solid content percentage; however, the transport rates and viscoelastic properties of the mucus are unaffected until the KO rat ages. Airway submucosal gland hypertrophy develops in the KO rat by 6 months of age. Only then does it induce increased mucus viscosity, collapse of the periciliary layer, and delayed mucociliary transport; stimulation of gland secretion potentiates this evolution. These findings could be reversed by bicarbonate repletion but not pH correction without counterion donation. These studies demonstrate that abnormal surface epithelium in CF does not cause delayed mucus transport in the absence of functional gland secretions. Furthermore, abnormal bicarbonate transport represents a specific target for restoring mucus clearance, independent of effects on periciliary collapse. Thus, mature airway secretions are required to manifest the CF defect primed by airway dehydration and bicarbonate deficiency.

Keywords: Cell Biology; Epithelial transport of ions and water; Pulmonology.


Conflict of interest statement

Conflict of interest: K.K. Chu, G.J. Tearney, and S.M. Rowe hold a patent (14/240,938) on the use of μOCT for pharmaceutical drug discovery.

Figures

Figure 1
Figure 1. Tracheal gland development.
(A) Representative images of Alcian blue–periodic acid–Schiff–stained (AB-PAS–stained) tracheal sections from 1-, 3-, and 6-month-old WT and KO rats. Arrows indicate mucus plugging in the gland ducts in the 6-month-old KO trachea. Scale bar: 50 μm. (B) Submucosal gland area measurements in each age and genotype. (C) Submucosal gland intracellular mucus measurements from each age and genotype. Data are shown as mean ± SEM. Data were analyzed by 2-way ANOVA. *P < 0.05. Data in A are representative of 3 independent studies. Data in B and C are from 6 animals/group for each panel.
Figure 2
Figure 2. Airway surface liquid depletion throughout development.
(A) Representative μOCT images of WT and KO rat tracheae at baseline conditions as well as treated with acetylcholine to stimulate mucus secretion, depicting the epithelial layer (ep), mucus layer (mu), lamina propria (lp), and airway surface liquid (ASL) depth (red bar). White bar: 10 μm (in 2 dimensions). Raw images were acquired at an 0.7 μM resolution. Quantification of the images yields measurements of ASL depth at baseline (B) and after cholinergic stimulation (C) as well as the absolute change (D) and percentage change (E) in ASL after acetylcholine stimulation. Data are shown as mean ± SEM. Data were analyzed by 2-way ANOVA. *P < 0.05, ****P < 0.0001. Data in A are representative of 3 independent studies. Data in B–E are from 6 animals/group.
Figure 3
Figure 3. Hyperacidic and hyperconcentrated airway surface liquid.
pH of WT and KO trachea, at increasing age, was measured using a solid content pH probe at baseline (A) and after cholinergic stimulation (B). Percentage of solid content of the airway surface liquid was measured at baseline (C) and after cholinergic stimulation (D). (E) Change in the solid content percentage after cholinergic stimulation was calculated for each age. Periciliary layer (PCL) depth at baseline (F) and after acetylcholine stimulation (G) is derived from μOCT images in Figure 2A. Data are shown as mean ± SEM. Data were analyzed by 2-way ANOVA. *P < 0.05, **P < 0.01, ****P < 0.0001. Data in A–D are from 4 animals/group. Data in E are from 3 animals/group. Data in F and G are from 6 animals/group.
Figure 4
Figure 4. Altered mucus transport and viscosity.
Mucociliary transport (MCT) rates at baseline conditions (A) and after stimulation with acetylcholine (B). Particle-tracking microrheology (PTM) was used to determine the effective viscosity of mucus at baseline conditions (C), which were 0.06 Hz, and after stimulation with acetylcholine (D). Representative tracks of beads in mucus of each condition at 1 month (E), 3 months (F), and 6 months (G) of age. Scale bar: 1 μm. *P < 0.05. Data were analyzed by 2-way ANOVA. Data in A–D are from 6 animals/group. Data in F and G are representative of 3 independent studies.
Figure 5
Figure 5. Hyperacidic airway surface liquid and altered mucus are bicarbonate dependent.
pH of 3-month-old WT tracheae in normal conditions and in bicarbonate-free conditions compared with KO tracheae, was measured using a solid content pH probe (A). Solid content of the airway surface mucus in 3-month-old WT trachea under normal and bicarbonate-free conditions was also compared with KO trachea (B). Periciliary layer (PCL) depths of WT tracheae in normal conditions and in bicarbonate-free conditions, compared with KO trachea, obtained from μOCT imaging (C). μOCT imaging also yields mucociliary transport (MCT) rates at baseline (D) and after cholinergic stimulation (E). Particle-tracking microrheology (PTM) yields effective viscosity of WT tracheae in the presence and absence of bicarbonate, compared with KO (F). MCT rates compared with effective viscosity indicate a strong relationship between viscosity of the mucus and the rate at which it is transported across the trachea (G). However, MCT rates compared with the solid content percentage (1-month KO conditions marked by τ) (H) and the solid content percentage compared with viscosity (I) do not correlate in a statistically significant manner. Data are shown as mean ± SEM. *P < 0.05, **P < 0.01, ***P < 0.001, ****P < 0.0001. Data were analyzed by (A–C) 1-way ANOVA and (D–F) 2-way ANOVA. Data in A depict 3 regions of interest (ROIs) from 4 animals/group. Data in B are from 3 animals/group. Data in C are 4 ROIs from 6 animals/group. Data in D–I are from 6 animals/group.
Figure 6
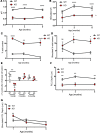
Figure 6. MCT rate recovery with apical treatment with sodium bicarbonate.
Mucociliary transport (MCT) rates compared with baseline of 6-month-old WT and KO tracheae treated with increasing concentrations of sodium bicarbonate (A) and corresponding ciliary beat frequency (CBF) (B). MCT rates compared with baseline in 6-month-old WT and KO tracheae treated with hypertonic saline or 115 mM sodium bicarbonate (C). MCT rates compared with baseline in 6-month-old WT and KO tracheae after addition of hypertonic saline or 115 mM sodium bicarbonate (D). *P < 0.05, **P < 0.01. n = 4–6 animals/group. Data were analyzed by (A–C) 2-way ANOVA and (D) 1-way ANOVA. Data are from 4 animals/group.
Figure 7
Figure 7. MCT normalization requires pH-dependent counterion equilibrium.
Mucociliary transport (MCT) rates compared with baseline when treated with sodium bicarbonate, Tris, or HEPES buffered to a pH of between 6.5 and 8.5 in 6-month-old KO (A) and WT (B) tracheae. Comparison of MCT rates in 6-month-old KO tracheae at baseline or treated with different solutions buffered to pH 7.5 compared with WT tracheae at baseline (C). *P < 0.05. The dotted line in A and B indicates P < 0.05 by 2-way ANOVA. n = 4–6 animals/group. Data in C were analyzed by was analyzed by 1-way ANOVA. Data are from 4 animals/group.

References

    1. Rowe SM, Miller S, Sorscher EJ. Cystic fibrosis. N Engl J Med. 2005;352(19):1992–2001. doi: 10.1056/NEJMra043184. - DOI - PubMed
    1. De Boeck K, Vermeulen F, Dupont L. The diagnosis of cystic fibrosis. Presse Med. 2017;46(6 Pt 2):e97–e108. - PubMed
    1. Poulsen JH, Fischer H, Illek B, Machen TE. Bicarbonate conductance and pH regulatory capability of cystic fibrosis transmembrane conductance regulator. Proc Natl Acad Sci USA. 1994;91(12):5340–5344. doi: 10.1073/pnas.91.12.5340. - DOI - PMC - PubMed
    1. Quinton PM. Missing Cl conductance in cystic fibrosis. Am J Physiol. 1986;251(4 Pt 1):C649–C652. - PubMed
    1. Welsh MJ. An apical-membrane chloride channel in human tracheal epithelium. Science. 1986;232(4758):1648–1650. doi: 10.1126/science.2424085. - DOI - PubMed

Publication types

Substances

LinkOut - more resources