

Structural ensemble-based docking simulation and biophysical studies discovered new inhibitors of Hsp90 N-terminal domain
- PMID: 29321504
- PMCID: PMC5762686
- DOI: 10.1038/s41598-017-18332-8
Structural ensemble-based docking simulation and biophysical studies discovered new inhibitors of Hsp90 N-terminal domain
Abstract
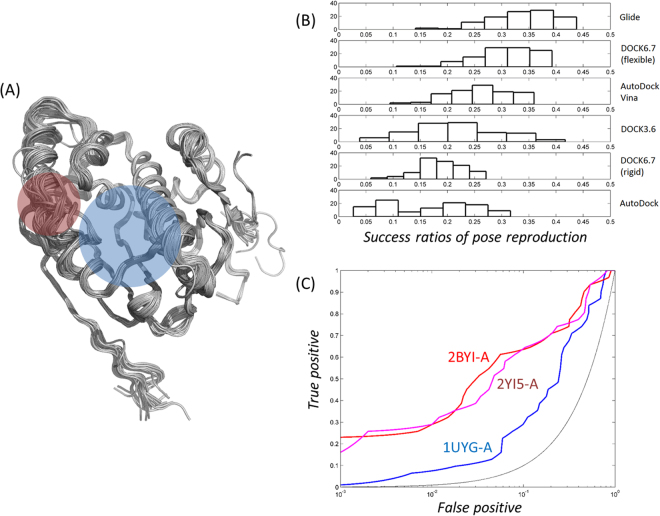
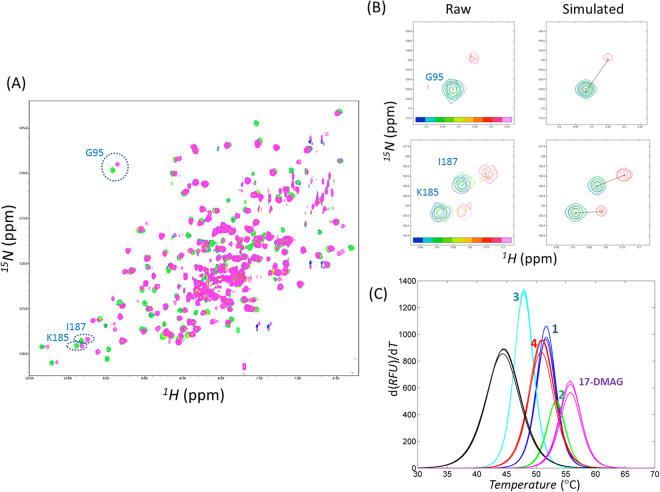
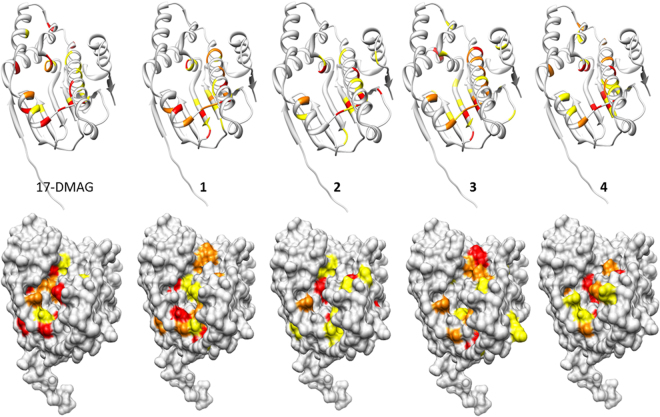
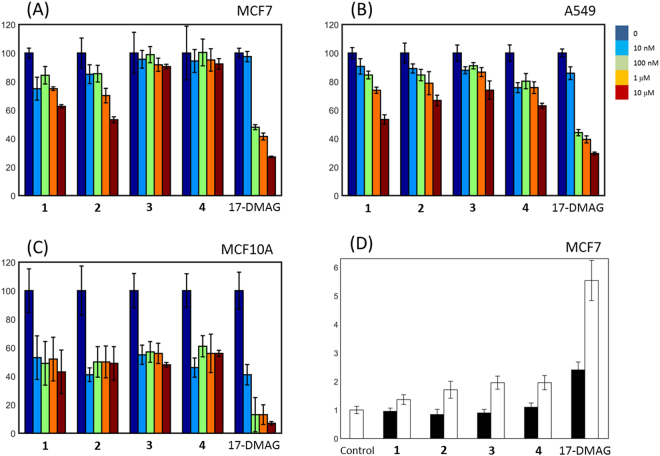
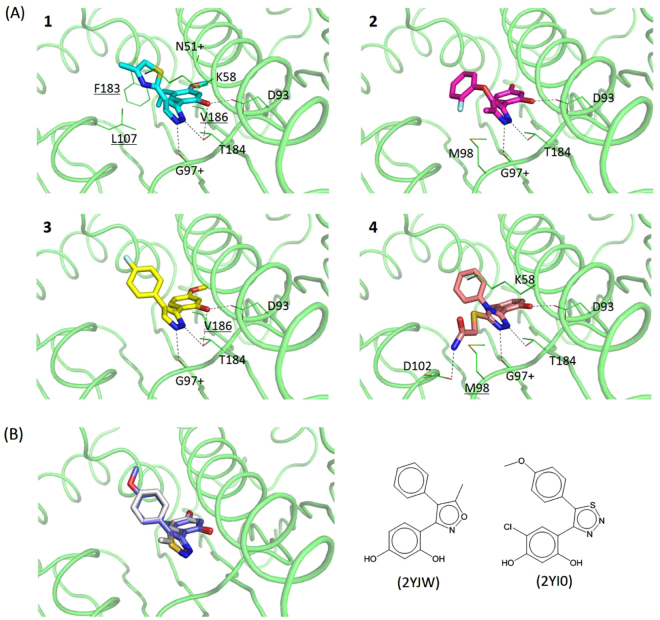
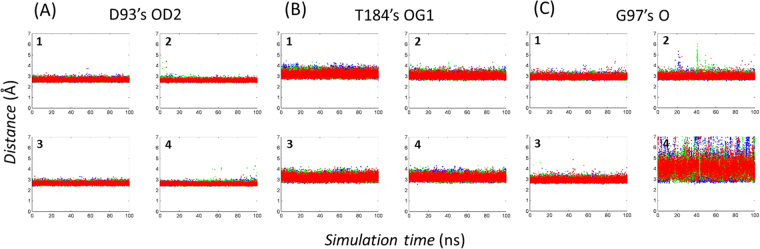
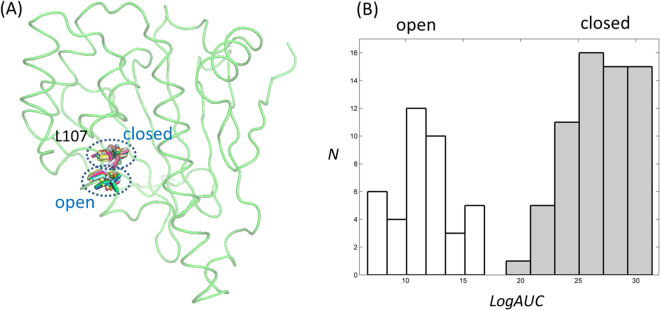
Heat shock protein 90 (Hsp90) is one of the most abundant cellular proteins and plays a substantial role in the folding of client proteins. The inhibition of Hsp90 has been regarded as an attractive therapeutic strategy for treating cancer because many oncogenic kinases are Hsp90 client proteins. In this study, we report new inhibitors that directly bind to N-terminal ATP-binding pocket of Hsp90. Optimized structure-based virtual screening predicted candidate molecules, which was followed by confirmation using biophysical and cell-based assays. Among the reported crystal structures, we chose the two structures that show the most favourable early enrichments of true-positives in the receiver operating characteristic curve. Four molecules showed significant changes in the signals of 2D [1H, 15N] correlation NMR spectroscopy. Differential scanning calorimetry analysis supported the results indicating direct binding. Quantified dissociation constant values of the molecules, determined by a series of 2D NMR experiments, lie in the range of 0.1-33 μM. Growth inhibition assay with breast and lung cancer cells confirmed the cellular activities of the molecules. Cheminformatics revealed that the molecules share limited chemical similarities with known inhibitors. Molecular dynamics simulations detailed the putative binding modes of the inhibitors.
Conflict of interest statement
The authors declare that they have no competing interests.
Figures

Similar articles
-
Could the FDA-approved anti-HIV PR inhibitors be promising anticancer agents? An answer from enhanced docking approach and molecular dynamics analyses.Drug Des Devel Ther. 2015 Nov 13;9:6055-65. doi: 10.2147/DDDT.S87653. eCollection 2015. Drug Des Devel Ther. 2015. PMID: 26622167 Free PMC article.
-
Prediction of dual agents as an activator of mutant p53 and inhibitor of Hsp90 by docking, molecular dynamic simulation and virtual screening.J Mol Graph Model. 2015 Sep;61:186-95. doi: 10.1016/j.jmgm.2015.08.001. Epub 2015 Aug 4. J Mol Graph Model. 2015. PMID: 26277488
-
Visualizing the Dynamics of a Protein Folding Machinery: The Mechanism of Asymmetric ATP Processing in Hsp90 and its Implications for Client Remodelling.J Mol Biol. 2021 Jan 22;433(2):166728. doi: 10.1016/j.jmb.2020.166728. Epub 2020 Dec 1. J Mol Biol. 2021. PMID: 33275968
-
Structural and computational biology of the molecular chaperone Hsp90: from understanding molecular mechanisms to computer-based inhibitor design.Curr Top Med Chem. 2009;9(15):1369-85. doi: 10.2174/156802609789895700. Curr Top Med Chem. 2009. PMID: 19860735 Review.
-
Anticancer Inhibitors of Hsp90 Function: Beyond the Usual Suspects.Adv Cancer Res. 2016;129:51-88. doi: 10.1016/bs.acr.2015.12.001. Epub 2016 Feb 10. Adv Cancer Res. 2016. PMID: 26916001 Free PMC article. Review.
Cited by
-
Discovery of Kinase and Carbonic Anhydrase Dual Inhibitors by Machine Learning Classification and Experiments.Pharmaceuticals (Basel). 2022 Feb 16;15(2):236. doi: 10.3390/ph15020236. Pharmaceuticals (Basel). 2022. PMID: 35215348 Free PMC article.
-
A systematic approach to identify host targets and rapidly deliver broad-spectrum antivirals.Mol Ther. 2022 May 4;30(5):1797-1800. doi: 10.1016/j.ymthe.2022.02.015. Epub 2022 Feb 28. Mol Ther. 2022. PMID: 35231394 Free PMC article. No abstract available.
-
Structure-Based Scaffold Repurposing toward the Discovery of Novel Cholinesterase Inhibitors.ACS Omega. 2020 Nov 24;5(48):30971-30979. doi: 10.1021/acsomega.0c03848. eCollection 2020 Dec 8. ACS Omega. 2020. PMID: 33324805 Free PMC article.
-
The Coiled Coil and C2 Domains Modulate BCR Localization and BCR-ABL1 Compartmentalization, Transforming Activity and TKI Responsiveness.Int J Mol Sci. 2025 Jul 9;26(14):6591. doi: 10.3390/ijms26146591. Int J Mol Sci. 2025. PMID: 40724843 Free PMC article.
-
Discovery of potent heat shock protein 90 (Hsp90) inhibitors: structure-based virtual screening, molecular dynamics simulation, and biological evaluation.J Enzyme Inhib Med Chem. 2023 Dec;38(1):2220558. doi: 10.1080/14756366.2023.2220558. J Enzyme Inhib Med Chem. 2023. PMID: 37357755 Free PMC article.
References
Publication types
MeSH terms
Substances
LinkOut - more resources
Full Text Sources
Other Literature Sources
