. 2018 Jan 10;9(1):144.
doi: 10.1038/s41467-017-02602-0.

Integrative genomic and transcriptomic analysis of leiomyosarcoma

Affiliations

Integrative genomic and transcriptomic analysis of leiomyosarcoma

Priya Chudasama et al. Nat Commun. .

Abstract

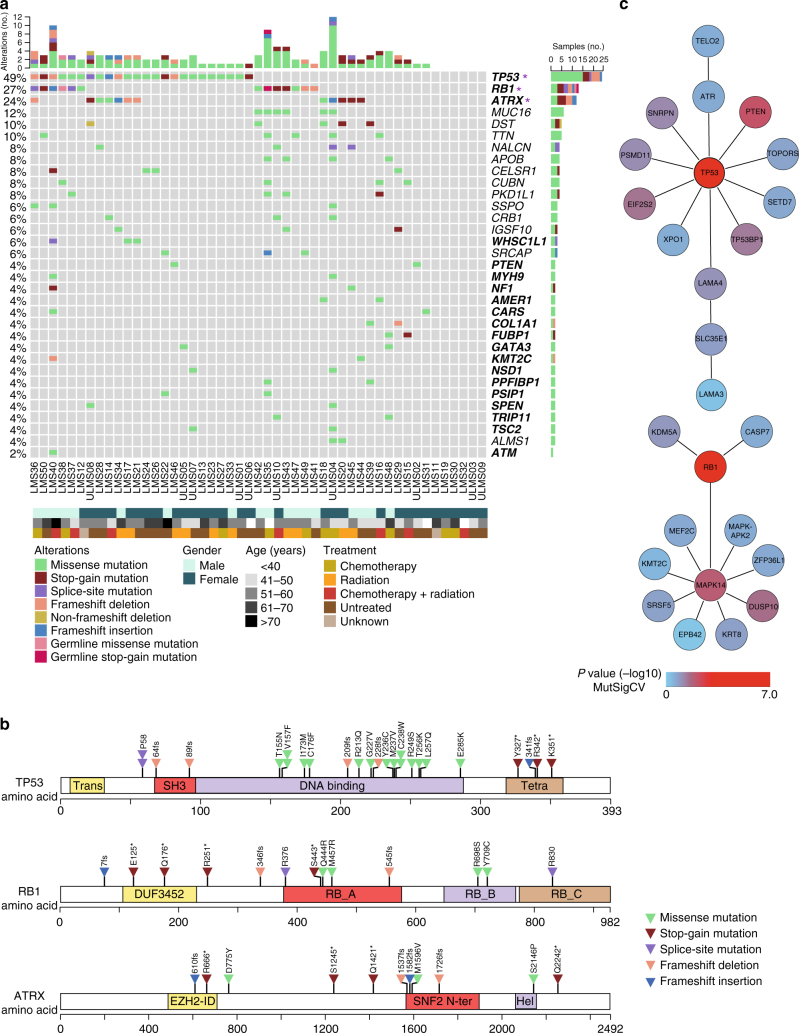
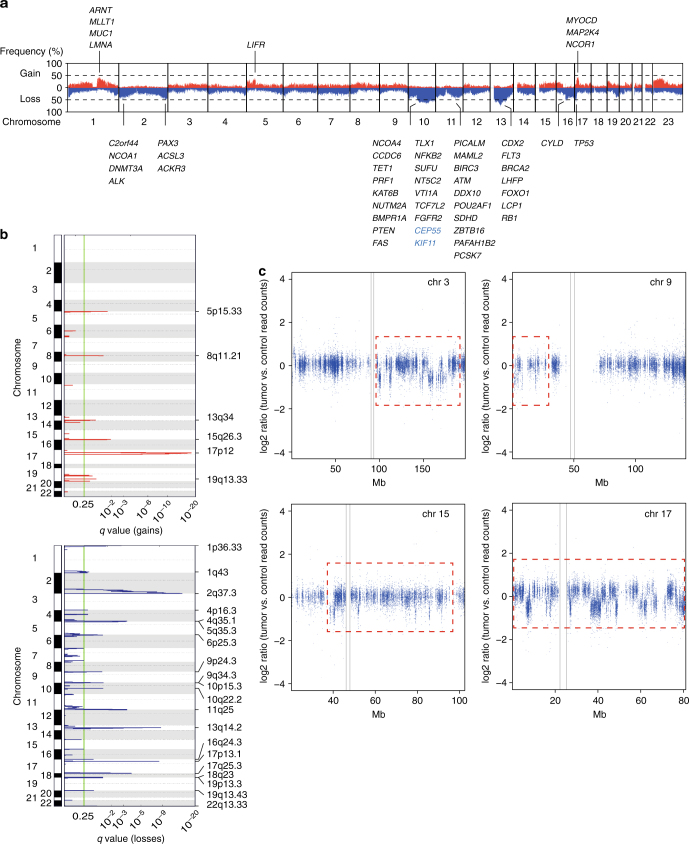
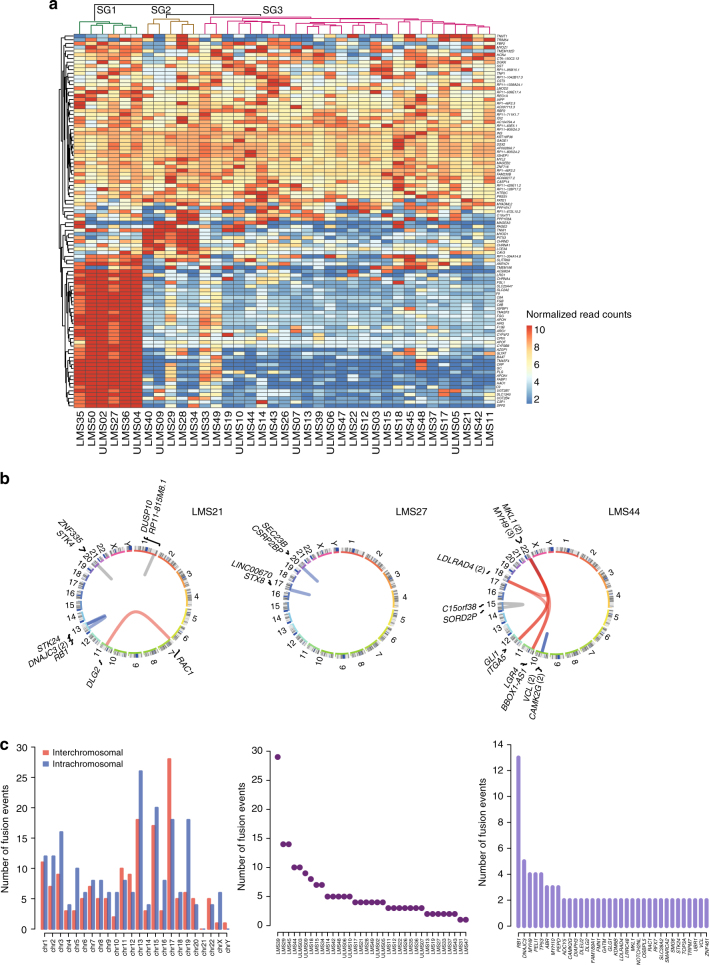
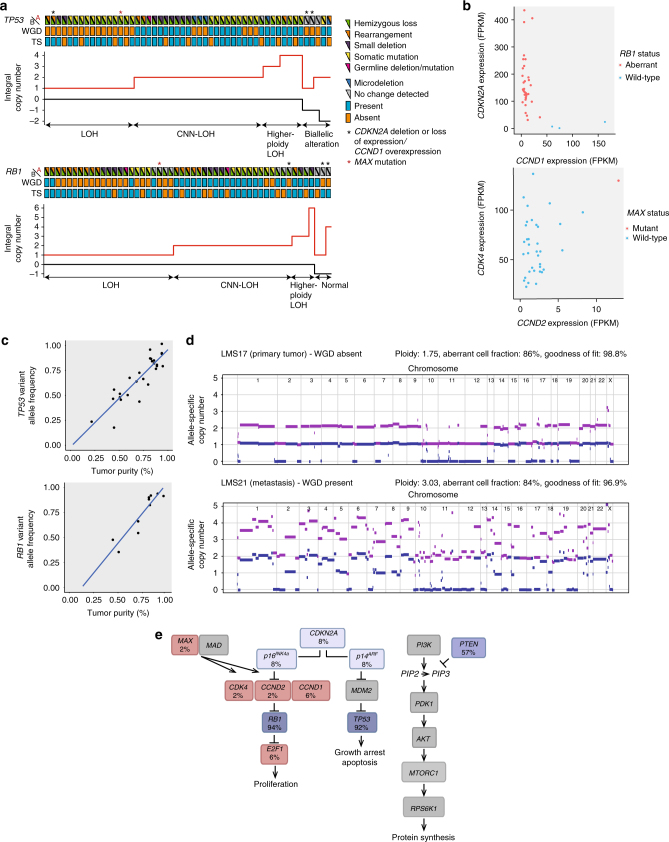
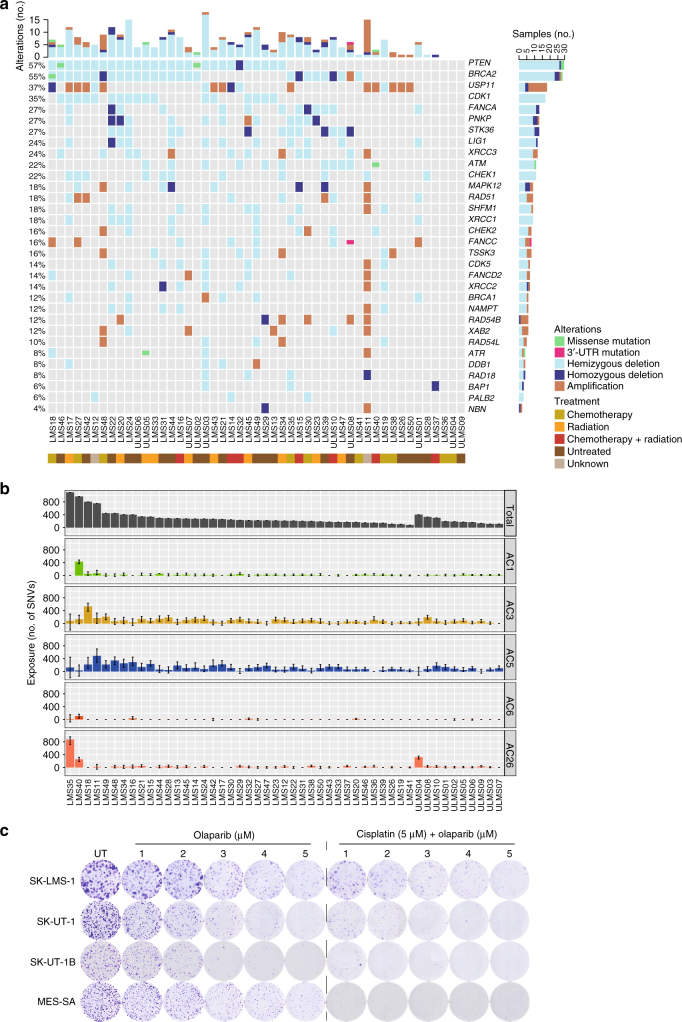
Leiomyosarcoma (LMS) is an aggressive mesenchymal malignancy with few therapeutic options. The mechanisms underlying LMS development, including clinically actionable genetic vulnerabilities, are largely unknown. Here we show, using whole-exome and transcriptome sequencing, that LMS tumors are characterized by substantial mutational heterogeneity, near-universal inactivation of TP53 and RB1, widespread DNA copy number alterations including chromothripsis, and frequent whole-genome duplication. Furthermore, we detect alternative telomere lengthening in 78% of cases and identify recurrent alterations in telomere maintenance genes such as ATRX, RBL2, and SP100, providing insight into the genetic basis of this mechanism. Finally, most tumors display hallmarks of "BRCAness", including alterations in homologous recombination DNA repair genes, multiple structural rearrangements, and enrichment of specific mutational signatures, and cultured LMS cells are sensitive towards olaparib and cisplatin. This comprehensive study of LMS genomics has uncovered key biological features that may inform future experimental research and enable the design of novel therapies.


Conflict of interest statement

The authors declare no competing financial interests.

Figures

Fig. 1
Fig. 1
Mutational landscape of adult LMS. a Frequency and type of mutations. Rows represent individual genes, columns represent individual tumors. Genes are sorted according to frequency of SNVs/indels (left). Asterisks indicate significantly mutated genes according to MutSigCV. Bars depict the number of SNVs/indels for individual tumors (top) and genes (right). Established cancer genes are shown in bold. Types of mutations and selected clinical features are annotated according to the color codes (bottom). b Schematic representation of SNVs/indels in TP53, RB1, and ATRX. Protein domains are indicated (Trans transactivation domain, SH3 Src homology 3-like domain, Tetra tetramerization domain, DUF3452 domain of unknown function, RB_A RB1-associated protein domain A, RB_B RB1-associated protein domain B, RB_C RB1-associated protein domain C, EZH2-ID EZH2 interaction domain, SNF2 N ter SNF2 family N-terminal domain, Hel helicase domain). c Top subnetworks from HotNet2 analysis of genes harboring SNVs/indels. MutSigCV P-values (−log10) for individual genes are annotated according to the color code
Fig. 2
Fig. 2
Genomic imbalances in adult LMS. a Overall pattern of CNAs. Chromosomes are represented along the horizontal axis, frequencies of chromosomal gains (red) and losses (blue) are represented along the vertical axis. Established cancer genes (black) and components of the CINSARC signature (blue) affected by CNAs in at least 30% of cases are indicated. b GISTIC2.0 plot of recurrent focal gains (top) and losses (bottom). The green line indicates the cut-off for significance (q = 0.25). c Read-depth plots of case LMS24 showing oscillating CNAs of chromosomes 3, 9, 15, and 17 (red dotted lines), indicative of chromothripsis. Gray lines indicate centromeres. Mb megabase, chr chromosome
Fig. 3
Fig. 3
Transcriptomic characterization of adult LMS. a Unsupervised hierarchical clustering based on the top 100 differentially expressed genes showing separation of tumors into three subgroups (SG1–3; dendrogram colors green, brown, and magenta). The heatmap displays normalized read count values for individual genes, which were centered, scaled (z-score), and quantile-discretized. b Structural variant plots of fusion transcripts in three tumors identified by TopHat2 and validated by RT-PCR (blue, intrachromosomal; red, interchromosomal) or visual inspection using Integrative Genomics Viewer (gray). Numbers in parentheses indicate the number of fusions involving the respective gene. c Number of fusion events per chromosome (left), tumor (middle), and gene (right). chr, chromosome
Fig. 4
Fig. 4
Genetic lesions targeting TP53 and RB1 in adult LMS. a Structural variant plots of all fusion transcripts involving TP53 and RB1 detected in 37 tumors. b Interchromosomal rearrangement resulting in a non-functional TP53-TCERG1 fusion transcript in case LMS44 (top) and intrachromosomal rearrangement resulting in a non-functional RB1-ATP8A2 fusion transcript in case LMS45 (bottom). TS transcriptome sequencing, chr chromosome. c Schematic representation of different genetic lesions targeting TP53 and RB1. e exon, i intron, chr chromosome, UTR untranslated region
Fig. 5
Fig. 5
Biallelic inactivation of TP53 and RB1 and whole-genome duplication (WGD) in adult LMS. a Combined analysis of genetic lesions and allele-specific copy number showing frequent biallelic inactivation of TP53 and RB1. In the top panels, samples are plotted from left to right based on their copy number composition, and genetic lesions specific for the A and B alleles as well as the presence or absence of WGD are annotated according to the color code. Asterisks indicate cases with either loss of CDKN2A expression in combination with CCND1 overexpression or MAX mutation. In the bottom panels, allele-specific integral copy numbers are plotted. Cases with retention of a single allele are assigned to the loss-of-heterozygosity (LOH) group, cases with one or more alleles derived from the same parental allele are assigned to the copy number-neutral (CNN) or higher-ploidy LOH groups, and cases with different combinations of maternal and paternal alleles are assigned to the normal or biallelic alteration group, respectively. TS transcriptome sequencing. b Scatter plots showing expression of CDKN2A and CCND1 in cases with wild-type and aberrant RB1 (left) and expression of CDK4 and CCND2 in cases with wild-type and mutant MAX (right). FPKM fragments per kilobase of transcript per million mapped reads. c Scatter plots showing congruency of TP53 and RB1 variant allele frequencies with tumor purity as detected by allele-specific copy number analysis. d Allele-specific copy-number profiles for a primary tumor/metastasis pair showing absence of WGD in the primary tumor (top) and presence of WGD in the metastasis (bottom). Chromosomes are represented along the horizontal axis, copy numbers are indicated along the vertical axis. The purple line indicates the total allele-specific copy number. The blue line indicates the minor allele-specific copy number. e Genes involved in cell cycle regulation or PI3K-AKT-mTOR signaling recurrently affected by genetic alterations in LMS tumors. Blue and red boxes denote genes with inactivating and activating lesions, respectively. Percentage values indicate the collective frequencies of SNVs, indels, CNAs, fusions, microalterations, and aberrant expression affecting the respective genes
Fig. 6
Fig. 6
High frequency of alternative lengthening of telomeres (ALT) in adult LMS. a Detection of C-circles in LMS tumors and control cell lines (U2OS, positive control; HeLa, negative control). Shown are test samples (top row) and control samples (bottom row). ALT-positive samples, as inferred from the enriched C-circle signal, are indicated in red. ALT-negative samples are indicated in blue. +pol, with polymerase; −pol, without polymerase. b Measurement of telomere content in LMS tumors. Telomere quantitative PCR was performed on tumor and matched control samples, and telomere repeat signals were normalized to a single-copy gene (36B4; T/S ratio). Shown are the telomere contents of tumor samples relative to those of control samples (left) and the absolute telomere contents of tumor samples (right). c Recurrent alterations in telomerase maintenance genes in LMS tumors. Rows represent individual genes, columns represent individual tumors. Genes are sorted according to frequency of SNVs, indels, and CNAs (left). Bars depict the number of alterations for individual tumors (top) and genes (right). Types of alterations and ALT status are annotated according to the color codes (bottom). UTR untranslated region; n.d. not determined
Fig. 7
Fig. 7
Evidence for BRCAness in adult LMS. a Alterations in genes reported as synthetic lethal to PARP inhibition. Rows represent individual genes, columns represent individual tumors. Genes are sorted according to frequency of SNVs, indels, and CNAs (left). Bars depict the number of alterations for individual tumors (top) and genes (right). Types of alterations and treatment history are annotated according to the color codes (bottom). UTR untranslated region. b Contribution of mutational signatures to the overall mutational load in LMS tumors. Each bar represents the number of SNVs explained by the respective mutational signature in an individual tumor. Error bars represent 95% confidence intervals. AC Alexandrov-COSMIC. c Clonogenic assays showing dose-dependent sensitivity of LMS cell lines to continuous olaparib treatment (1–5 µm) with or without prior exposure to a 2-h pulse of cisplatin (5 µm). UT untreated

References

    1. Coindre JM, et al. Predictive value of grade for metastasis development in the main histologic types of adult soft tissue sarcomas: a study of 1240 patients from the French Federation of Cancer Centers Sarcoma Group. Cancer. 2001;91:1914–1926. doi: 10.1002/1097-0142(20010515)91:10<1914::AID-CNCR1214>3.0.CO;2-3. - DOI - PubMed
    1. Penel N, et al. Testing new regimens in patients with advanced soft tissue sarcoma: analysis of publications from the last 10 years. Ann. Oncol. 2011;22:1266–1272. doi: 10.1093/annonc/mdq608. - DOI - PubMed
    1. Agaram NP, et al. Targeted exome sequencing profiles genetic alterations in leiomyosarcoma. Genes Chromosomes Cancer. 2016;55:124–130. doi: 10.1002/gcc.22318. - DOI - PMC - PubMed
    1. Yang CY, et al. Targeted next-generation sequencing of cancer genes identified frequent TP53 and ATRX mutations in leiomyosarcoma. Am. J. Transl. Res. 2015;7:2072–2081. - PMC - PubMed
    1. Yang J, et al. Genetic aberrations in soft tissue leiomyosarcoma. Cancer Lett. 2009;275:1–8. doi: 10.1016/j.canlet.2008.06.013. - DOI - PMC - PubMed

Publication types