. 2017 Dec 11:9:412.
doi: 10.3389/fnagi.2017.00412. eCollection 2017.

Brain Aging: Uncovering Cortical Characteristics of Healthy Aging in Young Adults

Affiliations

Brain Aging: Uncovering Cortical Characteristics of Healthy Aging in Young Adults

Sahil Bajaj et al. Front Aging Neurosci. .

Abstract

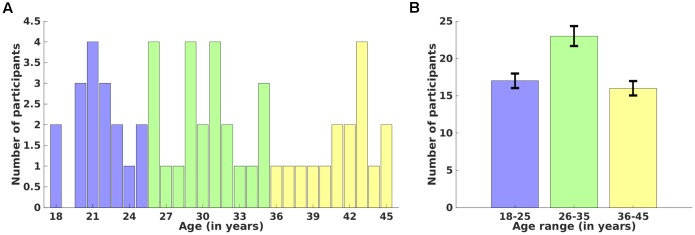
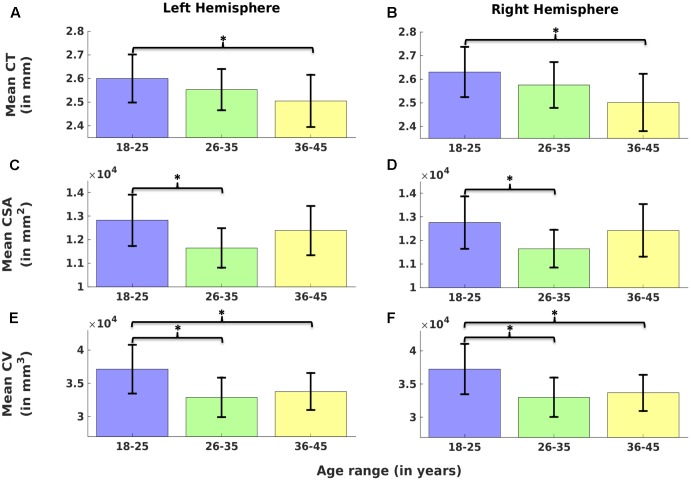
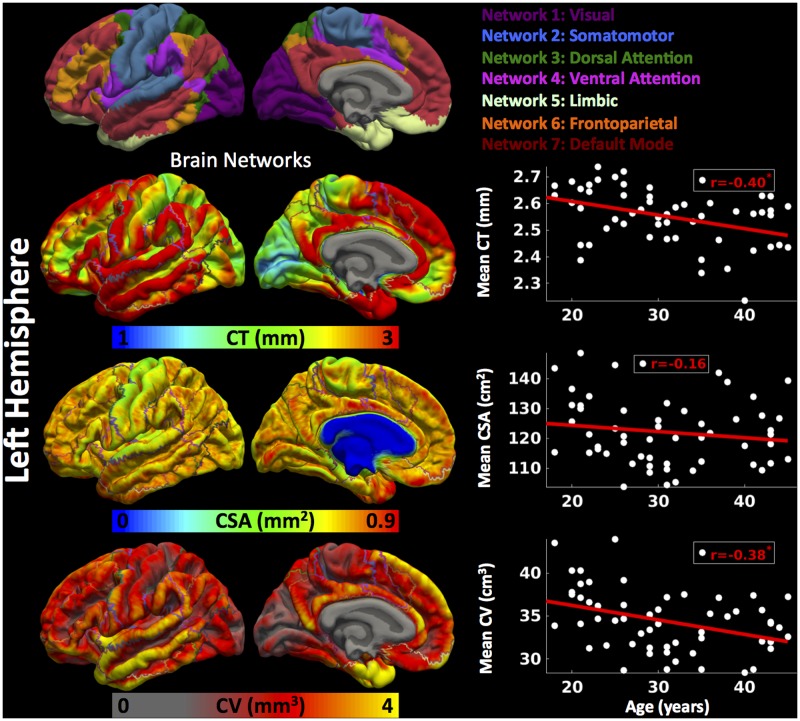
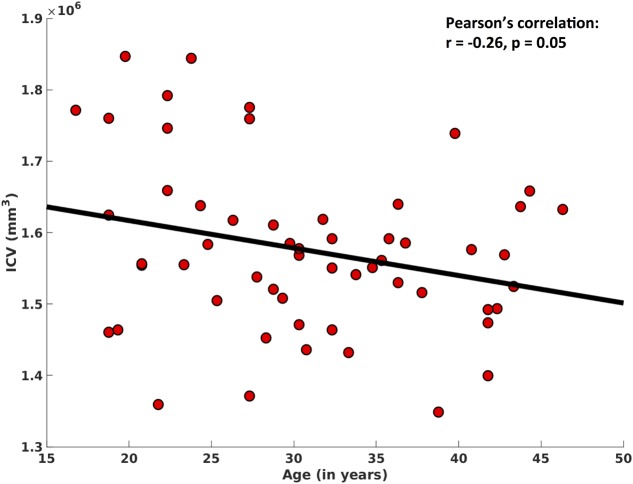
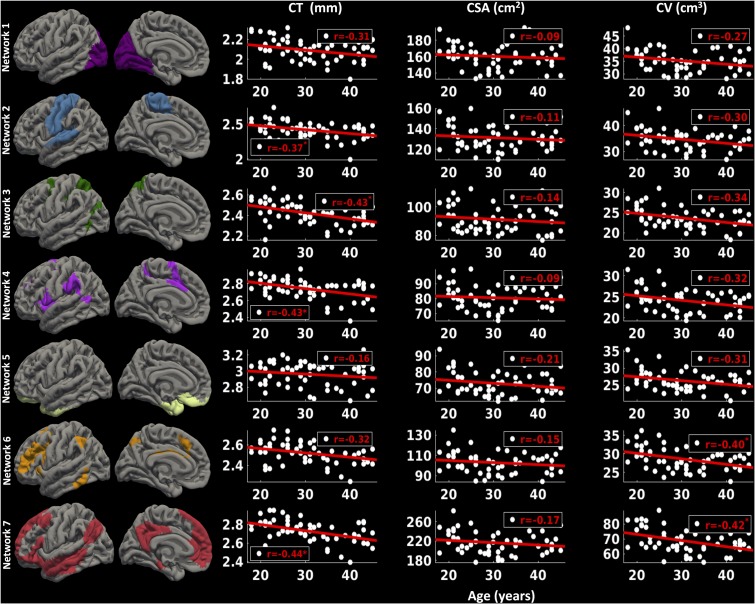
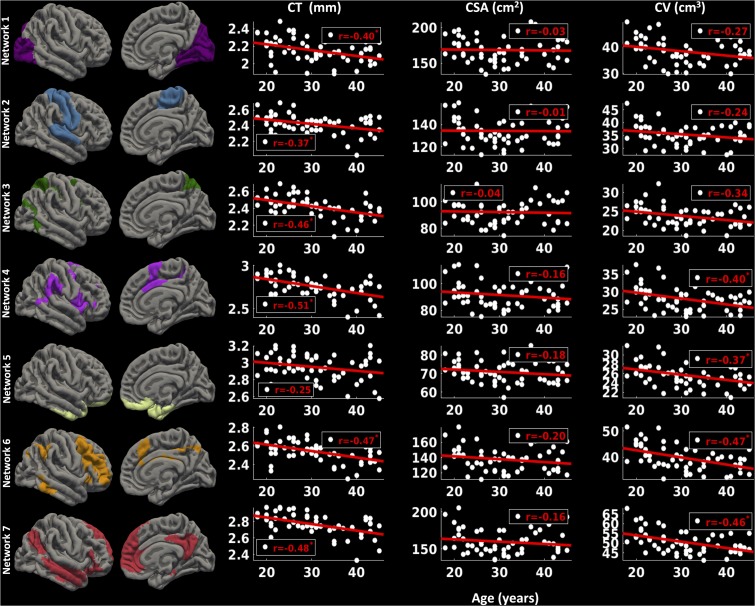
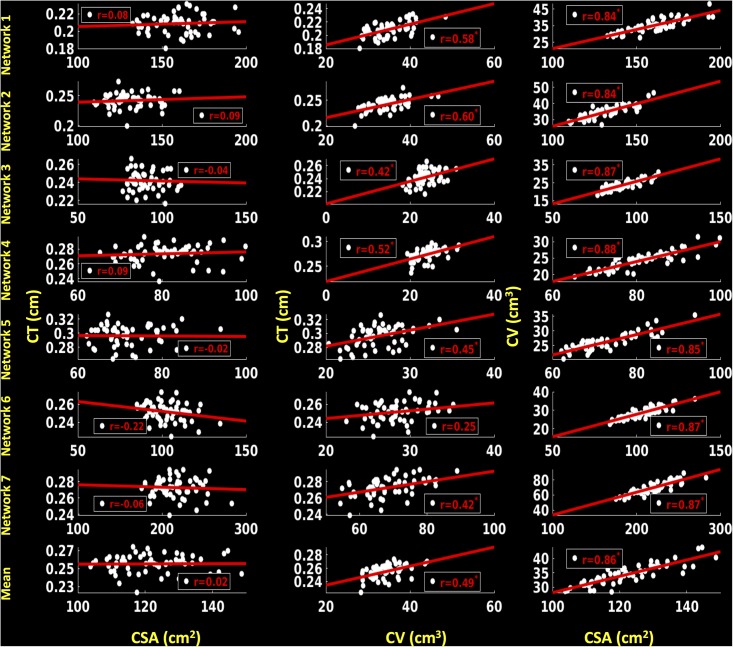
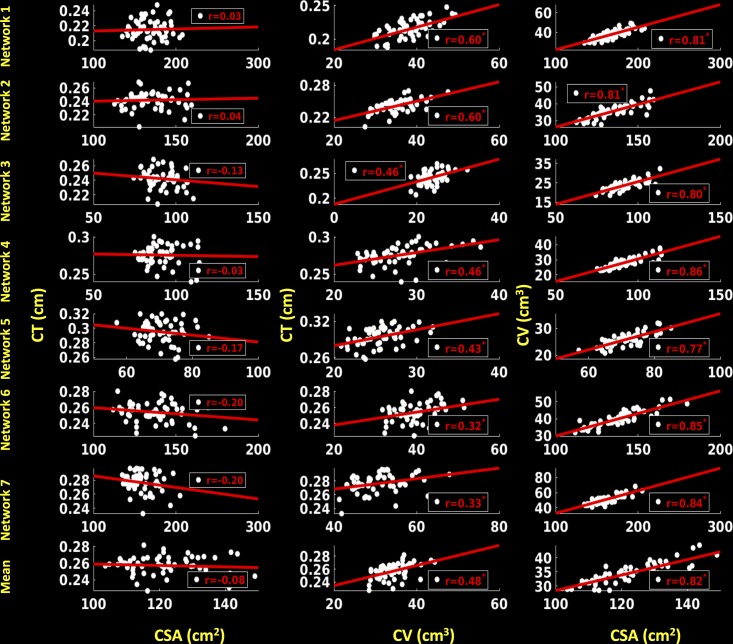
Despite extensive research in the field of aging neuroscience, it still remains unclear whether age related cortical changes can be detected in different functional networks of younger adults and whether these networks respond identically to healthy aging. We collected high-resolution brain anatomical data from 56 young healthy adults (mean age = 30.8 ± 8.1 years, 29 males). We performed whole brain parcellation into seven functional networks, including visual, somatomotor, dorsal attention, ventral attention, limbic, frontoparietal and default mode networks. We estimated intracranial volume (ICV) and averaged cortical thickness (CT), cortical surface area (CSA) and cortical volume (CV) over each hemisphere as well as for each network. Averaged cortical measures over each hemisphere, especially CT and CV, were significantly lower in older individuals compared to younger ones (one-way ANOVA, p < 0.05, corrected for multiple comparisons). There were negative correlations between age and averaged CT and CV over each hemisphere (p < 0.05, corrected for multiple comparisons) as well as between age and ICV (p = 0.05). Network level analysis showed that age was negatively correlated with CT for all functional networks (p < 0.05, corrected for multiple comparisons), apart from the limbic network. While age was unrelated to CSA, it was negatively correlated with CV across several functional networks (p < 0.05, corrected for multiple comparisons). We also showed positive associations between CV and CT and between CV and CSA for all networks (p < 0.05, corrected for multiple comparisons). We interpret the lack of association between age and CT of the limbic network as evidence that the limbic system may be particularly resistant to age-related declines during this period of life, whereas the significant age-related declines in averaged CT over each hemisphere as well as in all other six networks suggests that CT may serve as a reliable biomarker to capture the effect of normal aging. Due to the simultaneous dependence of CV on CT and CSA, CV was unable to identify such effects of normal aging consistently for the other six networks, but there were negative associations observed between age and averaged CV over each hemisphere as well as between age and ICV. Our findings suggest that the identification of early cortical changes within various functional networks during normal aging might be useful for predicting the effect of aging on the efficiency of functional performance even during early adulthood.

Keywords: cortical measures; cortical surface area; cortical thickness; cortical volume; functional networks; healthy aging; limbic system.


Figures

FIGURE 1
FIGURE 1
Distribution of participants over age. Age-wise (18–45 years) (A) and age-range (18–25, 26–35, and 36–45 years) (B) distributions over number of participants. Error bars represent the standard deviation of the mean value.
FIGURE 2
FIGURE 2
Comparison of cortical measures (Cortical thickness: CT, cortical surface area: CSA, and cortical volume: CV) across age groups. Mean CT (A,B), mean CSA (C,D) and mean CV (E,F) over left (A,C,E) and right hemisphere (B,D,F) are plotted across three age groups (G1: 18–25, G2: 26–35, and G3: 36–45). Error bars represent the standard deviation. Significant differences are denoted by (one-way ANOVA, p < 0.05, corrected for multiple comparisons).
FIGURE 3
FIGURE 3
Brain parcellation and age-related changes in mean cortical measures for left hemisphere. Left hemispheric brain parcellation into seven functional networks and vertex-wise maps for cortical thickness (CT in mm), cortical surface area (CSA in mm2) and cortical volume (CV in mm3). Linear plots showing age-related significant reduction in mean CT (in mm), non-significant reduction in mean CSA (cm2) and significant reduction in mean CV (cm3) over left hemisphere.
FIGURE 4
FIGURE 4
Brain parcellation and age-related changes in mean cortical measures for right hemisphere. Right hemispheric brain parcellation into seven functional networks and vertex-wise maps for cortical thickness (CT in mm), cortical surface area (CSA in mm2) and cortical volume (CV in mm3). Linear plots showing age-related significant reduction in mean CT (in mm), non-significant reduction in mean CSA (cm2) and significant reduction in mean CV (cm3) over right hemisphere.
FIGURE 5
FIGURE 5
Correlation between intracranial volume (ICV) and age. After regressing out the effect of ‘gender,’ here we show a significant negative association between ICV and age.
FIGURE 6
FIGURE 6
Network-wise age-related changes in cortical measures for left hemisphere. Linear plots showing significant or trend toward significant reduction in cortical thickness (CT in mm) (p < 0.05, corrected for multiple comparisons), non-significant reduction in cortical surface area (CSA in cm2) and significant or trend toward significant reduction in cortical volume (CV in cm3) (p < 0.05, corrected for multiple comparisons) for seven functional networks on left hemisphere.
FIGURE 7
FIGURE 7
Network-wise age-related changes in cortical measures for right hemisphere. Linear plots showing significant reduction in cortical thickness (CT in mm) (p < 0.05, corrected for multiple comparisons), non-significant reduction in cortical surface area (CSA in cm2) and significant or trend toward significant reduction in cortical volume (CV in cm3) (p < 0.05, corrected for multiple comparisons) for seven functional networks on right hemisphere.
FIGURE 8
FIGURE 8
Correlations between cortical surface area (CSA) and cortical thickness (CT), cortical volume (CV) and CT and between CSA and CV for left hemisphere. Linear plots showing non-significant association between CSA (cm2) and CT (cm), significant or trend toward significant positive association between CV (cm3) and CT (cm) (p < 0.05, corrected for multiple comparisons), and significant positive association between CSA (cm2) and CV (cm3) (p < 0.05, corrected for multiple comparisons) for seven functional networks and mean over seven functional networks on left hemisphere.
FIGURE 9
FIGURE 9
Correlations between cortical surface area (CSA) and cortical thickness (CT), cortical volume (CV) and CT and between CSA and CV for right hemisphere. Linear plots showing non-significant association between CSA (cm2) and CT (cm), significant or trend toward significant positive association between CV (cm3) and CT (cm) (p < 0.05, corrected for multiple comparisons), and significant positive association between CSA (cm2) and CV (cm3) (p < 0.05, corrected for multiple comparisons) for seven functional networks and mean over seven functional networks on right hemisphere.

References

    1. Allen J. S., Bruss J., Brown C. K., Damasio H. (2005). Normal neuroanatomical variation due to age: the major lobes and a parcellation of the temporal region. Neurobiol. Aging 26 1245–1260; discussion 1279–1282. 10.1016/j.neurobiolaging.2005.05.023 - DOI - PubMed
    1. Bartzokis G., Beckson M., Lu P. H., Nuechterlein K. H., Edwards N., Mintz J. (2001). Age-related changes in frontal and temporal lobe volumes in men: a magnetic resonance imaging study. Arch. Gen. Psychiatry 58 461–465. - PubMed
    1. Campbell K. L., Grady C. L., Ng C., Hasher L. (2012). Age differences in the frontoparietal cognitive control network: implications for distractibility. Neuropsychologia 50 2212–2223. 10.1016/j.neuropsychologia.2012.05.025 - DOI - PMC - PubMed
    1. Damoiseaux J. S., Beckmann C. F., Arigita E. J., Barkhof F., Scheltens P., Stam C. J., et al. (2008). Reduced resting-state brain activity in the “default network” in normal aging. Cereb. Cortex 18 1856–1864. 10.1093/cercor/bhm207 - DOI - PubMed
    1. Dickerson B. C., Feczko E., Augustinack J. C., Pacheco J., Morris J. C., Fischl B., et al. (2009). Differential effects of aging and Alzheimer’s disease on medial temporal lobe cortical thickness and surface area. Neurobiol. Aging 30 432–440. 10.1016/j.neurobiolaging.2007.07.022 - DOI - PMC - PubMed

LinkOut - more resources