. 2017 Dec 11:8:922.
doi: 10.3389/fphys.2017.00922. eCollection 2017.

Respiratory Frequency during Exercise: The Neglected Physiological Measure

Affiliations

Respiratory Frequency during Exercise: The Neglected Physiological Measure

Andrea Nicolò et al. Front Physiol. .

Abstract

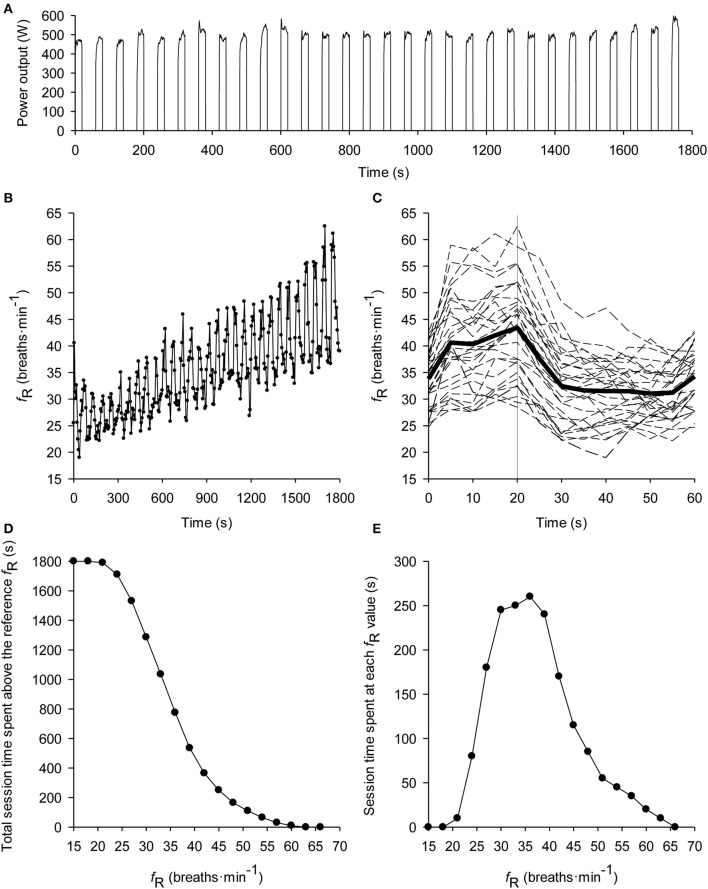
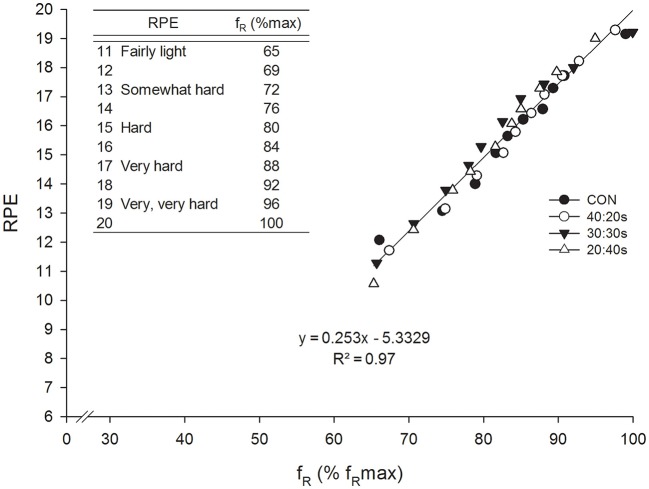
The use of wearable sensor technology for athlete training monitoring is growing exponentially, but some important measures and related wearable devices have received little attention so far. Respiratory frequency (fR), for example, is emerging as a valuable measurement for training monitoring. Despite the availability of unobtrusive wearable devices measuring fR with relatively good accuracy, fR is not commonly monitored during training. Yet fR is currently measured as a vital sign by multiparameter wearable devices in the military field, clinical settings, and occupational activities. When these devices have been used during exercise, fR was used for limited applications like the estimation of the ventilatory threshold. However, more information can be gained from fR. Unlike heart rate, [Formula: see text]O2, and blood lactate, fR is strongly associated with perceived exertion during a variety of exercise paradigms, and under several experimental interventions affecting performance like muscle fatigue, glycogen depletion, heat exposure and hypoxia. This suggests that fR is a strong marker of physical effort. Furthermore, unlike other physiological variables, fR responds rapidly to variations in workload during high-intensity interval training (HIIT), with potential important implications for many sporting activities. This Perspective article aims to (i) present scientific evidence supporting the relevance of fR for training monitoring; (ii) critically revise possible methodologies to measure fR and the accuracy of currently available respiratory wearables; (iii) provide preliminary indication on how to analyze fR data. This viewpoint is expected to advance the field of training monitoring and stimulate directions for future development of sports wearables.

Keywords: athletes; breathing; effort; training monitoring; wearable sensors.


Figures

Figure 1
Figure 1
Typical subject performing a 20-s work 40-s rest self-paced intermittent cycling time trial lasting 30 min (i.e., 30 repetitions). Data are from Nicolò et al. (2014a). The time course of power output is depicted in (A). Of note, fR responds very fast to the alternation of the work and recovery phases, and increases progressively over time (B). The rapid change in fR according to variations in workload can be better observed by showing the time course of fR within the 60-s work-recovery cycle (C). The solid thick line represents the average of the entire trial, the dashed lines represent each repetition and the solid vertical line separates the 20-s work from the 40-s recovery. For details on this analysis see Nicolò et al. (2014b). This is also a convenient representation to show fR data real time during HIIT. In order to synthesize the effort of the training session, the fR distribution (D) and concentration (E) profiles have also been constructed. The distribution profile describes the time spent above each fR-value, while the concentration profile describes the time spent at each fR-value. Both analyses can also be used to describe several training sessions. See Kosmidis and Passfield (2015) for more details on the two analyses.
Figure 2
Figure 2
Correlation between RPE and fR normalized to fRmax during a continuous (CON) and three different HIIT trials (40:20 s, 40 s work 20 s rest; 30:30 s, 30 s work 30 s rest; 20:40 s, 20 s work 40 s rest) matched for effort and exercise duration (30 min). The linear regression results from pooling together data from the four trials. The regression equation of the correlation obtained was used to associate fR normalized to fRmax with the 6–20 RPE scale (upper left corner of the chart). This was done in order to favor the interpretation of fR-values obtained during exercise. Reproduced from Nicolò et al. (2014a).

References

    1. Bailón R., Sörnmo L., Laguna P. (2006). A robust method for ECG-based estimation of the respiratory frequency during stress testing. IEEE Trans. Biomed. Eng. 53, 1273–1285. 10.1109/TBME.2006.871888 - DOI - PubMed
    1. Busse M. W., Maassen N., Konrad H. (1991). Relation between plasma K+ and ventilation during incremental exercise after glycogen depletion and repletion in man. J. Physiol. 443, 469–476. 10.1113/jphysiol.1991.sp018845 - DOI - PMC - PubMed
    1. Charlton P. H., Bonnici T., Tarassenko L., Clifton D. A., Beale R., Watkinson P. J. (2016). An assessment of algorithms to estimate respiratory rate from the electrocardiogram and photoplethysmogram. Physiol. Meas. 37, 610–626. 10.1088/0967-3334/37/4/610 - DOI - PMC - PubMed
    1. Cheng A. C., Black J. F., Buising K. L. (2008). Respiratory rate: the neglected vital sign. Med. J. Aust. 189, 531. - PubMed
    1. Cretikos M. A., Bellomo R., Hillman K., Chen J., Finfer S., Flabouris A. (2008). Respiratory rate: the neglected vital sign. Med. J. Aust. 188, 657–659. - PubMed