. 2017 Dec 11:8:2430.
doi: 10.3389/fmicb.2017.02430. eCollection 2017.

Fecal Microbiota Transplantation, Commensal Escherichia coli and Lactobacillus johnsonii Strains Differentially Restore Intestinal and Systemic Adaptive Immune Cell Populations Following Broad-spectrum Antibiotic Treatment

Affiliations

Fecal Microbiota Transplantation, Commensal Escherichia coli and Lactobacillus johnsonii Strains Differentially Restore Intestinal and Systemic Adaptive Immune Cell Populations Following Broad-spectrum Antibiotic Treatment

Ira Ekmekciu et al. Front Microbiol. .

Abstract

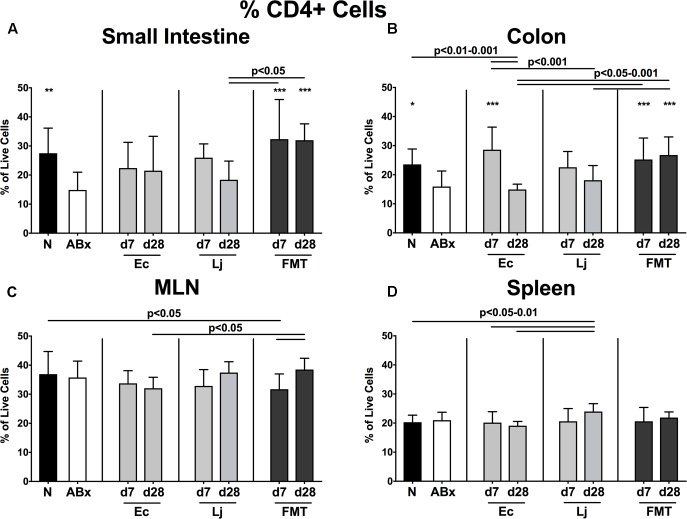
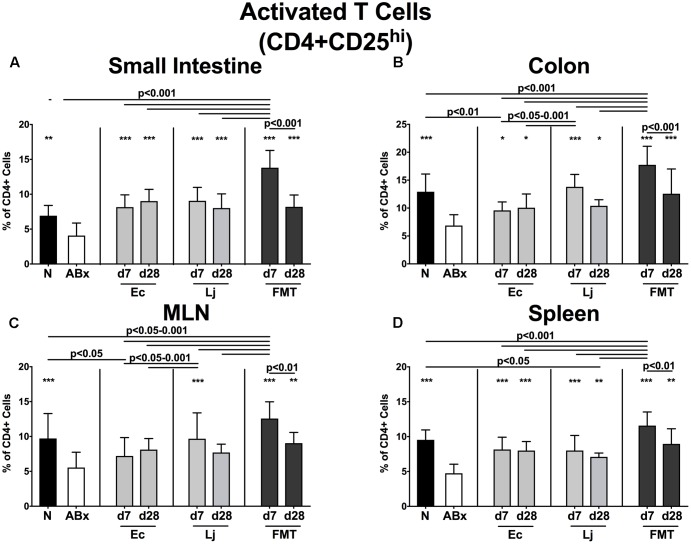
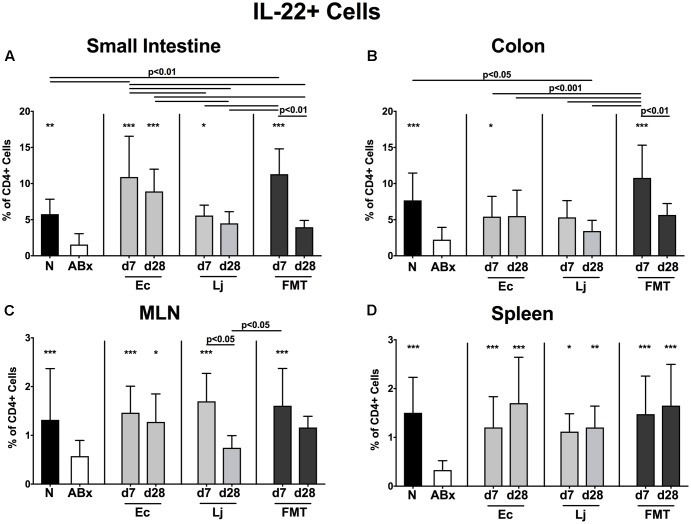
The essential role of the intestinal microbiota in the well-functioning of host immunity necessitates the investigation of species-specific impacts on this interplay. Aim of this study was to examine the ability of defined Gram-positive and Gram-negative intestinal commensal bacterial species, namely Escherichia coli and Lactobacillus johnsonii, respectively, to restore immune functions in mice that were immunosuppressed by antibiotics-induced microbiota depletion. Conventional mice were subjected to broad-spectrum antibiotic treatment for 8 weeks and perorally reassociated with E. coli, L. johnsonii or with a complex murine microbiota by fecal microbiota transplantation (FMT). Analyses at days (d) 7 and 28 revealed that immune cell populations in the small and large intestines, mesenteric lymph nodes and spleens of mice were decreased after antibiotic treatment but were completely or at least partially restored upon FMT or by recolonization with the respective bacterial species. Remarkably, L. johnsonii recolonization resulted in the highest CD4+ and CD8+ cell numbers in the small intestine and spleen, whereas neither of the commensal species could stably restore those cell populations in the colon until d28. Meanwhile less efficient than FMT, both species increased the frequencies of regulatory T cells and activated dendritic cells and completely restored intestinal memory/effector T cell populations at d28. Furthermore, recolonization with either single species maintained pro- and anti-inflammatory immune functions in parallel. However, FMT could most effectively recover the decreased frequencies of cytokine producing CD4+ lymphocytes in mucosal and systemic compartments. E. coli recolonization increased the production of cytokines such as TNF, IFN-γ, IL-17, and IL-22, particularly in the small intestine. Conversely, only L. johnsonii recolonization maintained colonic IL-10 production. In summary, FMT appears to be most efficient in the restoration of antibiotics-induced collateral damages to the immune system. However, defined intestinal commensals such as E. coli and L. johnsonii have the potential to restore individual functions of intestinal and systemic immunity. In conclusion, our data provide novel insights into the distinct role of individual commensal bacteria in maintaining immune functions during/following dysbiosis induced by antibiotic therapy thereby shaping host immunity and might thus open novel therapeutical avenues in conditions of perturbed microbiota composition.

Keywords: Escherichia coli; Lactobacillus johnsonii; commensal intestinal microbiota; fecal microbiota transplantation; immune restoration; immune-modulating effects; intestinal mucosal and peripheral and central immunity; secondary abiotic (gnotobiotic) mice.


Figures

FIGURE 1
FIGURE 1
Kinetics of intestinal bacterial colonization densities following bacterial recolonization of secondary abiotic mice. Secondary abiotic mice were generated by broad-spectrum antibiotic treatment and perorally recolonized with (A) E. coli (open squares) or (B) L. johnsonii (open circles) on day (d) 0 as described in “Materials and Methods.” Bacterial colonization densities were assessed in fecal samples (colony forming units per gram, CFU/g) over time upon recolonization as indicated by culture. Medians (black bars) are indicated. Data were pooled from three independent experiments.
FIGURE 2
FIGURE 2
Percentages of CD4+ cells in intestinal and systemic compartments of secondary abiotic and recolonized mice. Secondary abiotic mice were generated by broad-spectrum antibiotic treatment and perorally recolonized by gavage. Subsequently, lymphocytes from small intestinal and colonic lamina propria, MLN and spleen were isolated, and analyzed by flow cytometry as described in “Materials and Methods.” The percentages of the CD4+ lymphocyte population within the (A) small intestine, (B) colon, (C) MLN, and (D) spleen of naive conventional mice (N), secondary abiotic mice (ABx) and mice re-associated with either E. coli (Ec), L. johnsonii (Lj) or complex intestinal microbiota by FMT on d7 and d28 post-recolonization are depicted. Columns represent means +SD. Significance levels (p-values) determined with one-way ANOVA test followed by Tukey post-correction test for multiple comparisons are indicated. Significant differences as compared to secondary abiotic mice are indicated by asterisks (p < 0.05; ∗∗p < 0.01; ∗∗∗p < 0.001). Data were pooled from three independent experiments.
FIGURE 3
FIGURE 3
Absolute cell numbers of CD4+ cells in intestinal and systemic compartments of secondary abiotic and recolonized mice. Secondary abiotic mice were generated by broad-spectrum antibiotic treatment and perorally recolonized by gavage. Subsequently, lymphocytes from small intestinal and colonic lamina propria, MLN and spleen were isolated, and analyzed by flow cytometry as described in “Materials and Methods.” Concentrations of CD4+ lymphocytes in the (A) small intestine, (B) colon, (C) MLN, and (D) spleen of naive conventional mice (N), secondary abiotic mice (ABx) and mice re-associated with either E. coli (Ec), L. johnsonii (Lj) or complex intestinal microbiota by FMT on d7 and d28 post-recolonization are depicted. Columns represent means +SD. Significance levels (p-values) determined with one-way ANOVA test followed by Tukey post-correction test for multiple comparisons are indicated. Significant differences as compared to secondary abiotic mice are indicated by asterisks (p < 0.05; ∗∗p < 0.01; ∗∗∗p < 0.001). Data were pooled from three independent experiments.
FIGURE 4
FIGURE 4
Activated T cells (including Treg) in intestinal and systemic compartments of secondary abiotic and recolonized mice. Secondary abiotic mice were generated by broad-spectrum antibiotic treatment and perorally recolonized by gavage. Subsequently, lymphocytes from small intestinal and colonic lamina propria, MLN and spleen were isolated, and analyzed by flow cytometry as described in “Materials and Methods.” The frequencies of activated T cells (including Treg, CD4+CD25+, gated on CD4+ cells) in the (A) small intestine, (B) colon, (C) MLN and (D) spleen of naive conventional mice (N), secondary abiotic mice (ABx) and mice re-associated with either E. coli (Ec), L. johnsonii (Lj) or complex intestinal microbiota by FMT on d7 and d28 post-recolonization are depicted. Columns represent means +SD. Significance levels (p-values) determined with one-way ANOVA test followed by Tukey post-correction test for multiple comparisons are indicated. Significant differences as compared to secondary abiotic mice are indicated by asterisks (p < 0.05; ∗∗p < 0.01; ∗∗∗p < 0.001). Data were pooled from three independent experiments.
FIGURE 5
FIGURE 5
CD4+ memory/effector T cells in intestinal and systemic compartments of secondary abiotic and recolonized mice. Secondary abiotic mice were generated by broad-spectrum antibiotic treatment and perorally recolonized by gavage. Subsequently, lymphocytes from small intestinal and colonic lamina propria, MLN and spleen were isolated, and analyzed by flow cytometry as described in “Materials and Methods.” The proportions of CD4+ memory/effector cells (CD4+CD44hi, gated on CD4+ cells) in the (A) small intestine, (B) colon, (C) MLN and (D) spleen of naive conventional mice (N), secondary abiotic mice (ABx) and mice re-associated with either E. coli (Ec), L. johnsonii (Lj) or complex intestinal microbiota by FMT on d7 and d28 post-recolonization are depicted. Columns represent means +SD. Significance levels (p-values) determined with one-way ANOVA test followed by Tukey post-correction test for multiple comparisons are indicated. Significant differences as compared to secondary abiotic mice are indicated by asterisks (p < 0.05; ∗∗p < 0.01; ∗∗∗p < 0.001). Data were pooled from three independent experiments.
FIGURE 6
FIGURE 6
TNF producing CD4+ cells in intestinal and systemic compartments of secondary abiotic and recolonized mice. Secondary abiotic mice were generated by broad-spectrum antibiotic treatment and perorally recolonized by gavage. Subsequently, lymphocytes were isolated from small intestinal and colonic lamina propria, MLN, and spleen and stimulated with PMA/ionomycin in presence of brefeldin A and subsequently analyzed by flow cytometry. The percentages of IFN-γ producing CD4+ cells in the (A) small intestine, (B) colon, (C) MLN and (D) spleen of naive conventional mice (N), secondary abiotic mice (ABx) and mice re-associated with either E. coli (Ec), L. johnsonii (Lj) or complex intestinal microbiota by FMT on d7 and d28 post-recolonization are depicted. Columns represent means +SD. Significance levels (p-values) determined with one-way ANOVA test followed by Tukey post-correction test for multiple comparisons are indicated. Significant differences as compared to secondary abiotic mice are indicated by asterisks (p < 0.05; ∗∗p < 0.01; ∗∗∗p < 0.001). Data were pooled from three independent experiments.
FIGURE 7
FIGURE 7
IFN-γ producing CD4+ cells in intestinal and systemic compartments of secondary abiotic and recolonized mice. Secondary abiotic mice were generated by broad-spectrum antibiotic treatment and perorally recolonized by gavage. Subsequently, lymphocytes were isolated from small intestinal and colonic lamina propria, MLN, and spleen and stimulated with PMA/ionomycin in presence of brefeldin A and subsequently analyzed by flow cytometry. The percentages of TNF producing CD4+ cells in the (A) small intestine, (B) colon, (C) MLN and (D) spleen of naive conventional mice (N), secondary abiotic mice (ABx) and mice re-associated with either E. coli (Ec), L. johnsonii (Lj) or complex intestinal microbiota by FMT on d7 and d28 post-recolonization are depicted. Columns represent means +SD. Significance levels (p-values) determined with one-way ANOVA test followed by Tukey post-correction test for multiple comparisons are indicated. Significant differences as compared to secondary abiotic mice are indicated by asterisks (p < 0.05; ∗∗p < 0.01; ∗∗∗p < 0.001). Data were pooled from three independent experiments.
FIGURE 8
FIGURE 8
IL-17 producing CD4+ cells in intestinal and systemic compartments of secondary abiotic and recolonized mice. Secondary abiotic mice were generated by broad-spectrum antibiotic treatment and perorally recolonized by gavage. Subsequently, lymphocytes were isolated from small intestinal and colonic lamina propria, MLN, and spleen and stimulated with PMA/ionomycin in presence of brefeldin A and subsequently analyzed by flow cytometry. The percentages of IL-17 producing CD4+ cells in the (A) small intestine, (B) colon, (C) MLN and (D) spleen of naive conventional mice (N), secondary abiotic mice (ABx) and mice re-associated with either E. coli (Ec), L. johnsonii (Lj) or complex intestinal microbiota by FMT on d7 and d28 post-recolonization are depicted. Columns represent means +SD. Significance levels (p-values) determined with one-way ANOVA test followed by Tukey post-correction test for multiple comparisons are indicated. Significant differences as compared to secondary abiotic mice are indicated by asterisks (p < 0.05; ∗∗p < 0.01; ∗∗∗p < 0.001). Data were pooled from three independent experiments.
FIGURE 9
FIGURE 9
IL-22 producing CD4+ cells in intestinal and systemic compartments of secondary abiotic and recolonized mice. Secondary abiotic mice were generated by broad-spectrum antibiotic treatment and perorally recolonized by gavage. Subsequently, lymphocytes were isolated from small intestinal and colonic lamina propria, MLN, and spleen and stimulated with PMA/ionomycin in presence of brefeldin A and subsequently analyzed by flow cytometry. The percentages of IL-22 producing CD4+ cells in the (A) small intestine, (B) colon, (C) MLN and (D) spleen of naive conventional mice (N), secondary abiotic mice (ABx) and mice re-associated with either E. coli (Ec), L. johnsonii (Lj) or complex intestinal microbiota by FMT on d7 and d28 post-recolonization are depicted. Columns represent means +SD. Significance levels (p-values) determined with one-way ANOVA test followed by Tukey post-correction test for multiple comparisons are indicated. Significant differences as compared to secondary abiotic mice are indicated by asterisks (p < 0.05; ∗∗p < 0.01; ∗∗∗p < 0.001). Data were pooled from three independent experiments.
FIGURE 10
FIGURE 10
IL-10 producing CD4+ cells in intestinal and systemic compartments of secondary abiotic and recolonized mice. Secondary abiotic mice were generated by broad-spectrum antibiotic treatment and perorally recolonized by gavage. Subsequently, lymphocytes were isolated from small intestinal and colonic lamina propria, MLN, and spleen and stimulated with PMA/ionomycin in presence of brefeldin A and subsequently analyzed by flow cytometry. The percentages of IL-10 producing CD4+ cells in the (A) small intestine, (B) colon, (C) MLN and (D) spleen of naive conventional mice (N), secondary abiotic mice (ABx) and mice re-associated with either E. coli (Ec), L. johnsonii (Lj) or complex intestinal microbiota by FMT on d7 and d28 post-recolonization are depicted. Columns represent means +SD. Significance levels (p-values) determined with one-way ANOVA test followed by Tukey post-correction test for multiple comparisons are indicated. Significant differences as compared to secondary abiotic mice are indicated by asterisks (p < 0.05; ∗∗p < 0.01; ∗∗∗p < 0.001). Data were pooled from three independent experiments.

References

    1. Atarashi K., Tanoue T., Ando M., Kamada N., Nagano Y., Narushima S., et al. (2015). Th17 cell induction by adhesion of microbes to intestinal epithelial cells. Cell 163 367–380. 10.1016/j.cell.2015.08.058 - DOI - PMC - PubMed
    1. Atarashi K., Tanoue T., Shima T., Imaoka A., Kuwahara T., Momose Y., et al. (2011). Induction of colonic regulatory T cells by indigenous Clostridium species. Science 331 337–341. 10.1126/science.1198469 - DOI - PMC - PubMed
    1. Aujla S. J., Dubin P. J., Kolls J. K. (2007). Th17 cells and mucosal host defense. Semin. Immunol. 19 377–382. 10.1016/j.smim.2007.10.009 - DOI - PMC - PubMed
    1. Backhed F., Ley R. E., Sonnenburg J. L., Peterson D. A., Gordon J. I. (2005). Host-bacterial mutualism in the human intestine. Science 307 1915–1920. 10.1126/science.1104816 - DOI - PubMed
    1. Bereswill S., Ekmekciu I., Escher U., Fiebiger U., Stingl K., Heimesaat M. M. (2017). Lactobacillus johnsonii ameliorates intestinal, extra-intestinal and systemic pro-inflammatory immune responses following murine Campylobacter jejuni infection. Sci. Rep. 7:2138. 10.1038/s41598-017-02436-2 - DOI - PMC - PubMed