. 2017 Nov 23;8(1):36-52.
doi: 10.1002/ece3.3605. eCollection 2018 Jan.

Population genomics and geographical parthenogenesis in Japanese harvestmen (Opiliones, Sclerosomatidae, Leiobunum)

Affiliations

Population genomics and geographical parthenogenesis in Japanese harvestmen (Opiliones, Sclerosomatidae, Leiobunum)

Mercedes Burns et al. Ecol Evol. .

Abstract

Naturally occurring population variation in reproductive mode presents an opportunity for researchers to test hypotheses regarding the evolution of sex. Asexual reproduction frequently assumes a geographical pattern, in which parthenogenesis-dominated populations are more broadly dispersed than their sexual conspecifics. We evaluate the geographical distribution of genomic signatures associated with parthenogenesis using nuclear and mitochondrial DNA sequence data from two Japanese harvestman sister taxa, Leiobunum manubriatum and Leiobunum globosum. Asexual reproduction is putatively facultative in these species, and female-biased localities are common in habitat margins. Past karyotypic and current cytometric work indicates L. globosum is entirely tetraploid, while L. manubriatum may be either diploid or tetraploid. We estimated species phylogeny, genetic differentiation, diversity, and mitonuclear discordance in females collected across the species range in order to identify range expansion toward marginal habitat, potential for hybrid origin, and persistence of asexual lineages. Our results point to northward expansion of a tetraploid ancestor of L. manubriatum and L. globosum, coupled with support for greater male gene flow in southern L. manubriatum localities. Specimens from localities in the Tohoku and Hokkaido regions were indistinct, particularly those of L. globosum, potentially due to little mitochondrial differentiation or haplotypic variation. Although L. manubriatum overlaps with L. globosum across its entire range, L. globosum was reconstructed as monophyletic with strong support using mtDNA, and marginal support with nuclear loci. Ultimately, we find evidence for continued sexual reproduction in both species and describe opportunities to clarify the rate and mechanism of parthenogenesis.

Keywords: Opiliones; geographical parthenogenesis; mitonuclear discordance; population genomics.


Figures

Figure 1
Figure 1
Shaded distribution maps with select geological features and latitude for (a) Leiobunum manubriatum and (b) Leiobunum globosum, adapted from Tsurusaki (1986). Points indicate survey sex ratio, where white = female only, gray = males rare (<25%), and black = males more common (>25%). Sampling localities 1–15 are plotted across (a) and (b). Photographs of males (legs removed) of each species are inset and accompanied by scale bar of 1 mm
Figure 2
Figure 2
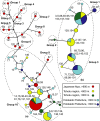
Median‐joining networks (ɛ = 0) of mitochondrial cytochrome oxidase I/II for (a) L. manubriatum and (b) L. globosum. Small numbers next to branches indicate the number of mutations separating haplotypes. Network haplogroup distinctions are labeled and demarcated with dashed circles. Pie charts indicate the proportion of individuals from each colored locality, with circle size proportionate to the total number of individuals with that haplotype
Figure 3
Figure 3
Bayesian likelihood tree reconstructing phylogenetic relationships between all specimens using nuclear SNP data. Posterior probabilities ≥50% are reported to left of node above branches (support for base of L. globosum is <50%, and highlighted in red). Bootstrap support ≥50% from maximum likelihood trees is reported to left of node below branches. Supported clades from the same locality are shaded (L. manubriatum, yellow, L. globosum, blue) and labeled with locality name
Figure 4
Figure 4
Bayesian likelihood tree reconstructing phylogenetic relationships between all specimens using mtDNA data. Posterior probabilities ≥50% are reported to left of node above branches. Bootstrap support ≥50% from maximum likelihood trees is reported to left of node below branches. Supported clades from the same locality are shaded (L. manubriatum, yellow, L. globosum, blue) and labeled with locality name. Labeled gray regions denote phylogenetic haplogroups from backbone nodes with greater than 75% support for DAPC prior
Figure 5
Figure 5
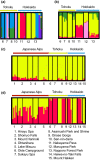
STRUCTURE plots of L. globosum (a) k = 6 and (b) k = 4, the population values supported via the Evanno's K method for (a) the species‐specific and (b) 112‐locus total datasets, respectively. (c) and (d) are k = 2 STRUCTURE plots for L. manubriatum, prepared using either (c) the species‐specific dataset or (d) the 112‐locus dataset common to both species
Figure 6
Figure 6
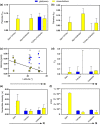
A summary of population statistics, with L. manubriatum and L. globosum plotted on the same axes. (a) pairwise regional FST using SNP data. (b) Pairwise regional ΦST with standard error using mtDNA. (c) Observed (H o, filled symbols) and expected (H e, open symbols) heterozygosity by locality latitude for L. globosum (circles) and L. manubriatum (squares). Regression line indicates a significant decrease in H o with increase in latitude in L. manubriatum. (d) Mean inbreeding coefficient (FIS) by region, with support values from 1,000 bootstrap replicates. (e) Nuclear data nucleotide diversity (π), normalized by locus count for L. globosum and L. manubriatum. (f) mtDNA π for L. globosum and L. manubriatum
Figure 7
Figure 7
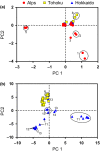
Plot of specimen scores on principal components 1 and 2 for (a) L. manubriatum and (b) L. globosum, constructed using species‐specific nuclear genomic loci. Regions are indicated by symbol shape and color, where Alps = red circles, Tohoku = yellow squares, Hokkaido = blue triangles. Clusters of specimens from the same locality are circled and selected clusters or individual specimen scores are labeled by localities 1–15 (see Figure 1 for map ID)
Figure 8
Figure 8
(a) Proportion of successfully assigned individuals in DAPC analyses with six grouping priors (locality, region, elevation, both—a combination of region and elevation, haplotype assigned from median‐joining network, and haplotype assigned by mtDNA phylogeny) for L. manubriatum and L. globosum. Average maximum posterior probability of assignment (±95% CI) for discrimination of (b) L. globosum samples and (c) L. manubriatum samples. Letters indicate significant differences in prior confidence following ANOVA with multiple comparisons. Dotted lines indicate mean posterior probability given no genetic principal component data, that is, each individual has a 1/N probability of assignment to any cluster, where N = number of clusters for the given prior

References

    1. Ashman, T. L. , Bachtrog, D. , Blackmon, H. , Goldberg, E. E. , Hahn, M. W. , Kirkpatrick, M. , … Vamosi, J. C. (2014). Tree of sex: A database of sexual systems. Scientific Data, 1, 140015 https://doi.org/10.1038/sdata.2014.15 - DOI - PMC - PubMed
    1. Baldo, L. , Prendini, L. , Corthals, A. , & Werren, J. H. (2007). Wolbachia are present in southern African scorpions and cluster with supergroup F. Current Microbiology, 55, 367–373. https://doi.org/10.1007/s00284-007-9009-4 - DOI - PubMed
    1. Bandelt, H. , Forster, P. , & Röhl, A. (1999). Median‐joining networks for inferring intraspecific phylogenies. Molecular Biology and Evolution, 16(1), 37–48. https://doi.org/10.1093/oxfordjournals.molbev.a026036 - DOI - PubMed
    1. Barrow, L. N. , Bigelow, A. T. , Phillips, C. A. , & Lemmon, E. M. (2015). Phylogeographic inference using Bayesian model comparison across a fragmented chorus frog species complex. Molecular Ecology, 24, 4739–4758. https://doi.org/10.1111/mec.13343 - DOI - PubMed
    1. Berthelot, C. , Brunet, F. , Chalopin, D. , Juanchich, A. , Bernard, M. , Noël, B. , … Guiguen, Y. (2014). The rainbow trout genome provides novel insights into evolution after whole‐genome duplication in vertebrates. Nature Communications, 5, 3657 https://doi.org/10.1038/ncomms4657 - DOI - PMC - PubMed