. 2017 Dec 11:7:293.
doi: 10.3389/fonc.2017.00293. eCollection 2017.

High-Content Monitoring of Drug Effects in a 3D Spheroid Model

Affiliations

High-Content Monitoring of Drug Effects in a 3D Spheroid Model

Frédérique Mittler et al. Front Oncol. .

Abstract

A recent decline in the discovery of novel medications challenges the widespread use of 2D monolayer cell assays in the drug discovery process. As a result, the need for more appropriate cellular models of human physiology and disease has renewed the interest in spheroid 3D culture as a pertinent model for drug screening. However, despite technological progress that has significantly simplified spheroid production and analysis, the seeming complexity of the 3D approach has delayed its adoption in many laboratories. The present report demonstrates that the use of a spheroid model may be straightforward and can provide information that is not directly available with a standard 2D approach. We describe a cost-efficient method that allows for the production of an array of uniform spheroids, their staining with vital dyes, real-time monitoring of drug effects, and an ATP-endpoint assay, all in the same 96-well U-bottom plate. To demonstrate the method performance, we analyzed the effect of the preclinical anticancer drug MLN4924 on spheroids formed by VCaP and LNCaP prostate cancer cells. The drug has different outcomes in these cell lines, varying from cell cycle arrest and protective dormancy to senescence and apoptosis. We demonstrate that by using high-content analysis of spheroid arrays, the effect of the drug can be described as a series of EC50 values that clearly dissect the cytostatic and cytotoxic drug actions. The method was further evaluated using four standard cancer chemotherapeutics with different mechanisms of action, and the effect of each drug is described as a unique multi-EC50 diagram. Once fully validated in a wider range of conditions, this method could be particularly valuable for phenotype-based drug discovery.

Keywords: 3D model; HCS screening; MLN4924; Nedd8; drug discovery; prostate cancer; spheroids; ubiquitin.


Figures

Figure 1
Figure 1
Spheroid assembly in U-bottom, 96-well NTA plates. (A) Schematic diagram of spheroid assembly. Representative images on the right show the aggregates formed by VCaP (4,000 cells seeded), LNCaP (1,000 cells seeded), and PC3 (500 cells seeded) cells in 7 days. The images were acquired with a Zeiss Observer Z1 microscope. Scale bar, 200 µm. For real-time observation of VCaP spheroid assembly, see Movie S1 in Supplementary Material. (B,C) Kinetics of spheroid assembly. Spheroids were formed with (B) 2,000 VCaP cells and (C) 500 LNCaP cells. The images were acquired with a CellInsight NXT HCS platform, and the aggregate “Area” and “Shape P2A” (roundness) metrics were calculated using a Morphology.V4 application. Scale bar, 200 µm. The plots show the data analyzed with “R” statistics software (mean ± SD, 24 spheroids per cell line). (D) Uniformity of VCaP spheroid assembly. Representative CellInsight images of spheroids formed by varying numbers of VCaP cells over 7 days. The field of view is 896.6 µm × 896.6 µm. (E) The box plots show the corresponding VCaP spheroid volumes estimated with Morphology.V4 and analyzed with R software. The slope of the linear trend line corresponds to ~12 pL of occupied volume per seeded cell.
Figure 2
Figure 2
Effect of MLN on spheroid growth, morphology, and apoptosis. (A,B) Spheroids were preformed (A) for 7 days with 2,000 VCaP cells and (B) for 4 days with 500 LNCaP cells and treated (at Time = 0) with the indicated concentrations of MLN. CellEvent® Caspase-3/7 Green Detection Reagent (1 µM final) was added at the same time. The images were acquired once a day with the CellInsight NXT HCS platform. Spheroid “Area” and “Shape P2A” [blue segmentation, (C,D)] as well as CellEvent fluorescence (FITC filter set) and fluorescence area [green segmentation, (C,D)] were measured using a Morphology.V4 application. The plots show the changes in spheroid morphology and CellEvent fluorescence analyzed with “R” software (mean ± SD, six spheroids per condition). (C,D) Representative images of (C) VCaP and (D) LNCaP spheroids were acquired with the CellInsight NXT HCS platform at day 4 (VCaP) or at day 2 (LNCaP) of the treatment. Scale bar, 200 µm.
Figure 3
Figure 3
LysoTracker Deep Red staining of MLN-treated spheroids. (A,B) Spheroids were preformed (A) for 7 days with 2,000 VCaP cells and (B) for 4 days with 500 LNCaP cells and treated for 4 days (VCaP) or 2 days (LNCaP) with MLN in the presence of 1 µM CellEvent as described in Figure 2 legend. LysoTracker Deep Red (20 nM final) was added (T = 0), and the images were acquired at the indicated time points using the CellInsight NXT HCS platform. LysoTracker Deep Red fluorescence (Cy5 filter set) and florescence area were measured using a Morphology.V4 application. The plots show the changes in spheroid-associated LysoTracker fluorescence analyzed with “R” software (mean ± SD, six spheroids per condition). (C,D) Representative images of (C) VCaP and (D) LNCaP spheroids were acquired on a Zeiss Observer Z1 microscope after 8 h of LysoTracker treatment. Scale bar, 200 µm.
Figure 4
Figure 4
Quantification of phenotypic changes induced by MLN in prostate cancer spheroids. (A,B) Preformed spheroids were treated for 4 days [VCaP, (A)] or 2 days [LNCaP, (B)] with the indicated concentrations of MLN in the presence of 1 µM CellEvent and stained for 8 h with LysoTracker Deep Red as described in Figure 3 legend. Bright field and fluorescence images were acquired with the CellInsight NXT HCS platform and analyzed using the Morphology.V4 application. The box plots created with “R” software show the changes in spheroid phenotype induced by MLN compared with the mean values in the control spheroids (mean ± SD, six spheroids per condition, per plate, P-values: ***<0.001, **<0.01, and *<0.05).
Figure 5
Figure 5
ATP-based endpoint assay to assess the MLN effect. (A,B) Spheroids were preformed (A) for 7 days with 2,000 VCaP cells and (B) for 4 days with 500 LNCaP cells and treated for 4 days (VCaP) or 2 days (LNCaP) with the indicated concentrations of MLN. Then, the spheroids were lysed with ViaLight™ reagent, and luminescence was measured directly in the U-bottomed 96-well NTA plate using a GloMax®-Multi Detection System (dark blue curves, 3D U-bottom). Then, the spheroid lysates were transferred into a white plate with a flat transparent bottom (Greiner Bio-One), and luminescence was remeasured (light blue curves, 3D F-bottom). In parallel, VCaP (100,000 cells seeded) and LNCaP (20,000 cells seeded) monolayer cultures in white microtiter plates with a flat transparent bottom (Greiner) were processed similarly with ViaLight™ reagent and analyzed (red curves, 2D F-bottom). The data were normalized to the mean value obtained under control conditions (MLN = 0 nM) and are plotted as the means ± SD (six replicates per condition, per plate).
Figure 6
Figure 6
High-content analysis plots for drug response in VCaP and LNCaP spheroids. The plots were constructed using the data in Tables 3 and 4. The EC50 values were estimated from dose–response curves for “Area,” “Shape P2A” (P2A), “CellEvent” (CE), “LysoTracker” (LysoT), and ATP parameters, which were measured in VCaP (green circles) and LNCaP (red circles) spheroids. The increments “−1” and “−2” indicate lower and higher values, respectively. The threshold lines correspond to the drug concentration at which no change in spheroid ATP content was observed within a given treatment time [2 days for LNCaP (red line) and 4 days for VCaP (green line)]. The EC50 values below the threshold were tentatively assigned to the cytostatic drug effect, whereas those above the threshold were assigned to the cytotoxic drug effect.
Figure 7
Figure 7
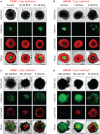
Various phenotypes of drug-treated spheroids. The experimental conditions were the same as described in Figure 3 legend. (A,B) Distinct cytostatic phenotypes. (C,D) Distinct cytotoxic phenotypes. Scale bar, 200 µm.

References

    1. Horvath P, Aulner N, Bickle M, Davies AM, Nery ED, Ebner D, et al. Screening out irrelevant cell-based models of disease. Nat Rev Drug Discov (2016) 15(11):751–69.10.1038/nrd.2016.175 - DOI - PubMed
    1. Scannell JW, Blanckley A, Boldon H, Warrington B. Diagnosing the decline in pharmaceutical R&D efficiency. Nat Rev Drug Discov (2012) 11(3):191–200.10.1038/nrd3681 - DOI - PubMed
    1. Allison M. Reinventing clinical trials. Nat Biotechnol (2012) 30(1):41–9.10.1038/nbt.2083 - DOI - PubMed
    1. Hirschhaeuser F, Menne H, Dittfeld C, West J, Mueller-Klieser W, Kunz-Schughart LA. Multicellular tumor spheroids: an underestimated tool is catching up again. J Biotechnol (2010) 148(1):3–15.10.1016/j.jbiotec.2010.01.012 - DOI - PubMed
    1. Weiswald LB, Bellet D, Dangles-Marie V. Spherical cancer models in tumor biology. Neoplasia (2015) 17(1):1–15.10.1016/j.neo.2014.12.004 - DOI - PMC - PubMed