

Diabetes and pregnancy: national trends over a 15 year period
- PMID: 29322220
- PMCID: PMC6448996
- DOI: 10.1007/s00125-017-4529-3
Diabetes and pregnancy: national trends over a 15 year period
Abstract
Aims/hypothesis: We aimed to examine time trends in national perinatal outcomes in pregnancies complicated by pre-existing type 1 or type 2 diabetes.
Methods: We analysed episode-level data on all obstetric inpatient delivery events (live or stillbirth) between 1 April 1998 and 31 March 2013 (n = 813,921) using the Scottish Morbidity Record (SMR02). Pregnancies to mothers with type 1 (n = 3229) and type 2 (n = 1452) diabetes were identified from the national diabetes database (Scottish Care Information-Diabetes), and perinatal outcomes were compared among women with type 1 diabetes, type 2 diabetes and those without diabetes.
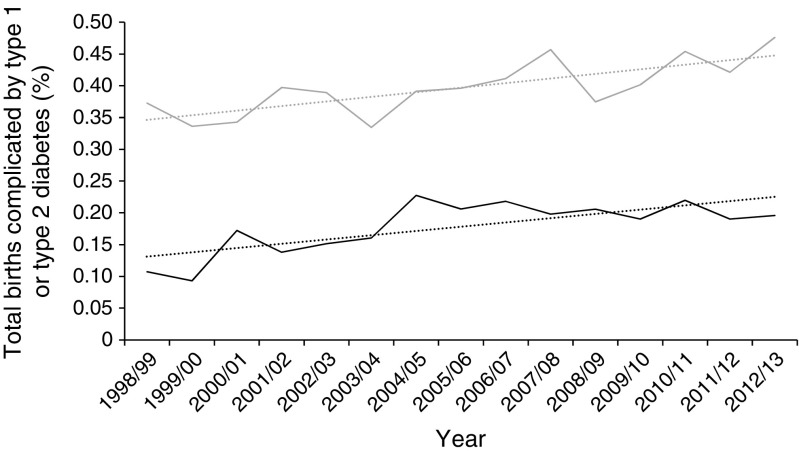
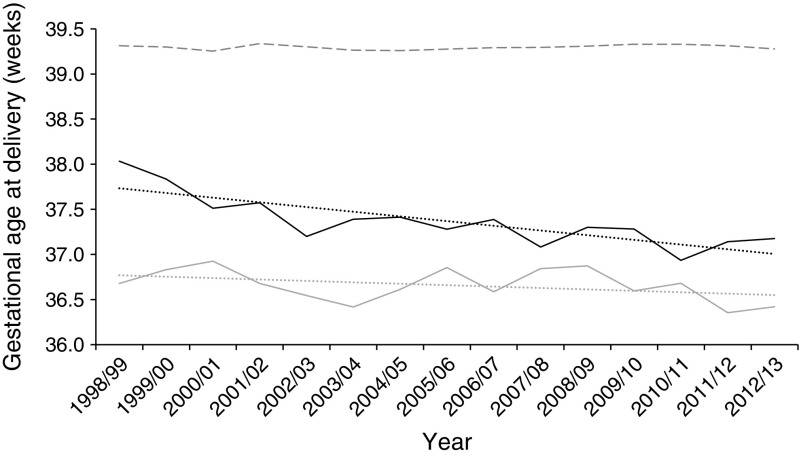
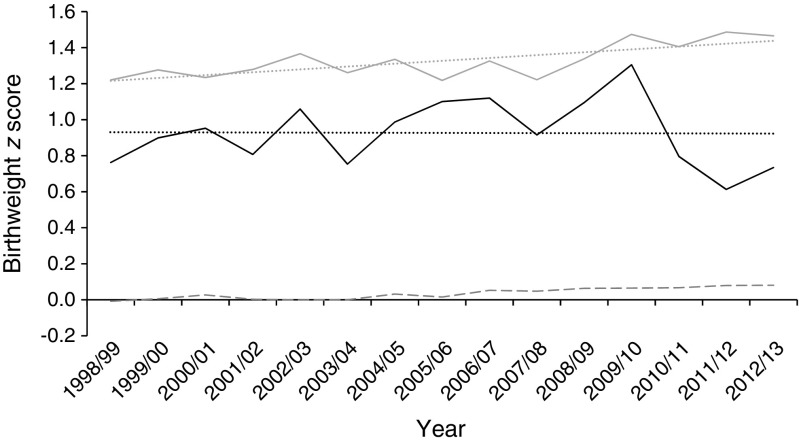
Results: The number of pregnancies complicated by diabetes increased significantly, by 44% in type 1 diabetes and 90% in type 2 diabetes, across the 15 years examined, to rates of 1 in 210 and 1 in 504 deliveries, respectively. Compared with women without diabetes, delivery occurred 2.6 weeks earlier (type 1 diabetes 36.7 ± 2.3 weeks) and 2 weeks earlier (type 2 diabetes 37.3 ± 2.4 weeks), respectively, showing significant reductions for both type 1 (from 36.7 weeks to 36.4 weeks, p = 0.03) and type 2 (from 38.0 weeks to 37.2 weeks, p < 0.001) diabetes across the time period. The proportions of preterm delivery were markedly increased in women with diabetes (35.3% type 1 diabetes, 21.8% type 2 diabetes, 6.1% without diabetes; p < 0.0001), and these proportions increased with time for both groups (p < 0.005). Proportions of elective Caesarean sections (29.4% type 1 diabetes, 30.5% type 2 diabetes, 9.6% without diabetes) and emergency Caesarean sections (38.3% type 1 diabetes, 29.1% type 2 diabetes, 14.6% without diabetes) were greatly increased in women with diabetes and increased over time except for stable rates of emergency Caesarean section in type 1 diabetes. Gestational age-, sex- and parity-adjusted z score for birthweight (1.33 ± 1.34; p < 0.001) were higher in type 1 diabetes and increased over time from 1.22 to 1.47 (p < 0.001). Birthweight was also increased in type 2 diabetes (0.94 ± 1.34; p < 0.001) but did not alter with time. There were 65 perinatal deaths in offspring of mothers with type 1 diabetes and 39 to mothers with type 2 diabetes, representing perinatal mortality rates of 20.1 (95% CI 14.7, 24.3) and 26.9 (16.7, 32.9) per 1000 births, respectively, and rates 3.1 and 4.2 times, respectively, those observed in the non-diabetic population (p < 0.001). Stillbirth rates in type 1 and type 2 diabetes were 4.0-fold and 5.1-fold that in the non-diabetic population (p < 0.001). Perinatal mortality and stillbirth rates showed no significant fall over time despite small falls in the rates for the non-diabetic population.
Conclusions/interpretation: Women with diabetes are receiving increased intervention in pregnancy (earlier delivery, increased Caesarean section rates), but despite this, higher birthweights are being recorded. Improvements in rates of stillbirth seen in the general population are not being reflected in changes in stillbirth or perinatal mortality in our population with diabetes.
Keywords: Diabetes; Epidemiology; Perinatal; Pregnancy; Trends; Type 1 diabetes; Type 2 diabetes.
Conflict of interest statement
The authors declare that there is no duality of interest associated with this manuscript.
Figures
References
-
- Evers IM, de Valk HW, Visser GH. Risk of complications of pregnancy in women with type 1 diabetes: nationwide prospective study in the Netherlands. BMJ. 2004;328:915. doi: 10.1136/bmj.38043.583160.EE. - DOI - PMC - PubMed
-
- Macintosh MCM, Fleming KM, Bailey JA, et al. Perinatal mortality and congenital anomalies in babies of women with type 1 or type 2 diabetes in England, Wales, and Northern Ireland: population based study. BMJ. 2006;333:177. doi: 10.1136/bmj.38856.692986.AE. - DOI - PMC - PubMed
Publication types
MeSH terms
LinkOut - more resources
Full Text Sources
Other Literature Sources
Medical
Miscellaneous
