. 2018 Jan 11;8(1):411.
doi: 10.1038/s41598-017-18564-8.

An application of machine learning to haematological diagnosis

Affiliations

An application of machine learning to haematological diagnosis

Gregor Gunčar et al. Sci Rep. .

Abstract

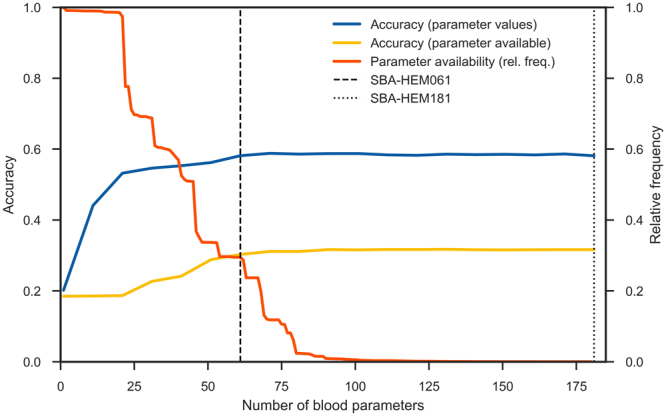
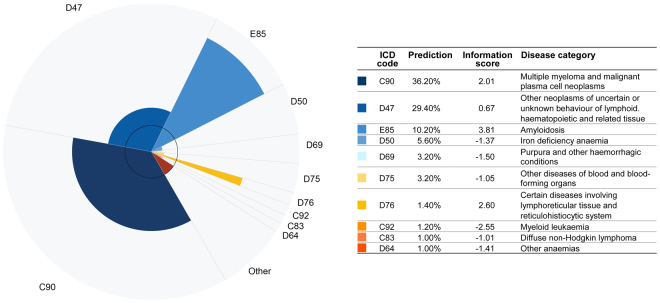
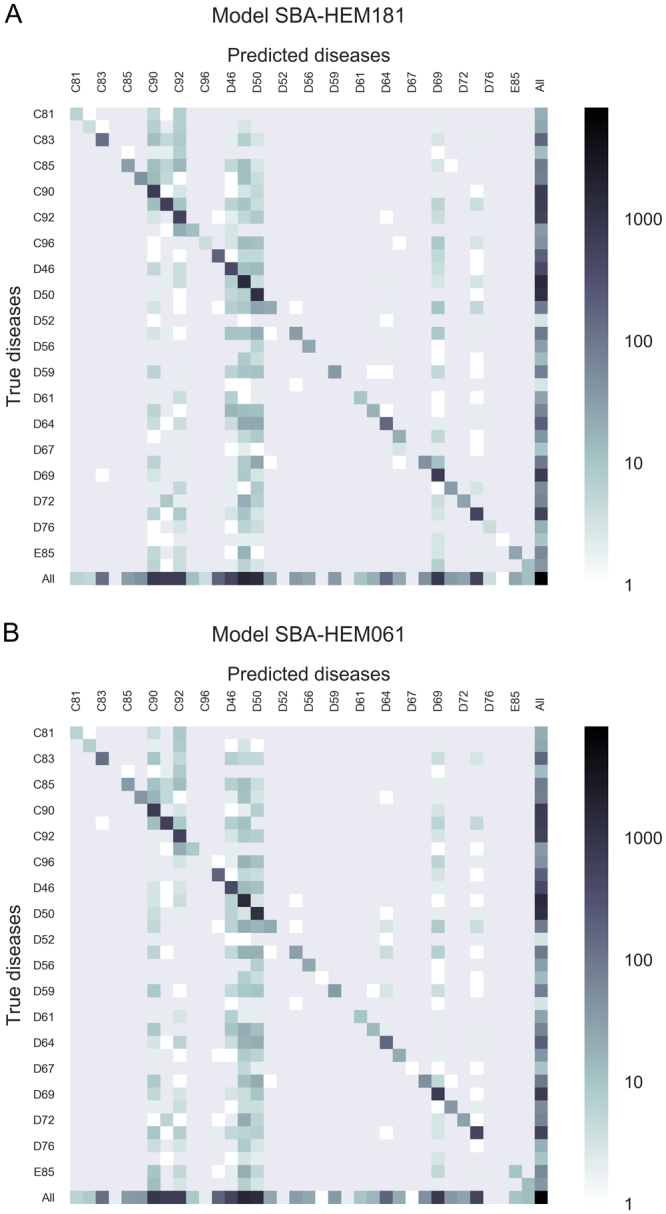
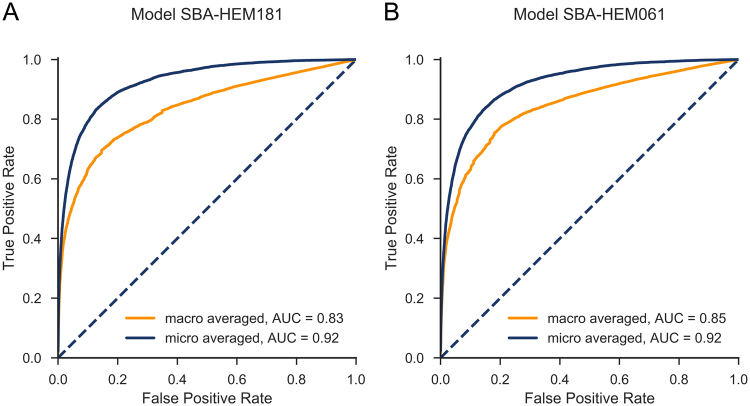
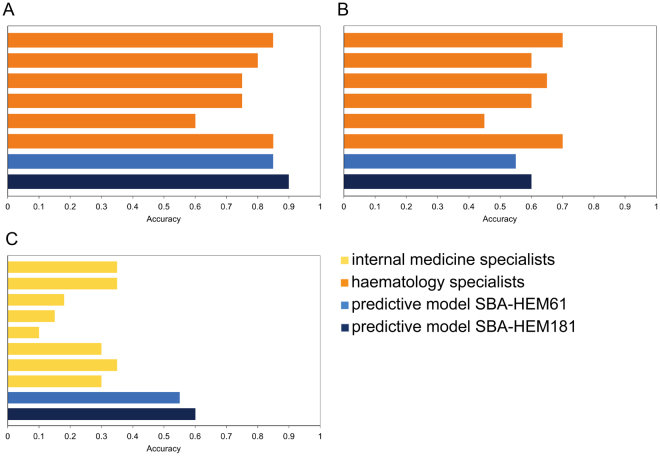
Quick and accurate medical diagnoses are crucial for the successful treatment of diseases. Using machine learning algorithms and based on laboratory blood test results, we have built two models to predict a haematologic disease. One predictive model used all the available blood test parameters and the other used only a reduced set that is usually measured upon patient admittance. Both models produced good results, obtaining prediction accuracies of 0.88 and 0.86 when considering the list of five most likely diseases and 0.59 and 0.57 when considering only the most likely disease. The models did not differ significantly, which indicates that a reduced set of parameters can represent a relevant "fingerprint" of a disease. This knowledge expands the model's utility for use by general practitioners and indicates that blood test results contain more information than physicians generally recognize. A clinical test showed that the accuracy of our predictive models was on par with that of haematology specialists. Our study is the first to show that a machine learning predictive model based on blood tests alone can be successfully applied to predict haematologic diseases. This result and could open up unprecedented possibilities for medical diagnosis.


Conflict of interest statement

Smart Blood Analytics Swiss SA (SBA) fully funded this research. Mar. N. is SBA CEO, M.K., Mat. N. and G.G. are SBA advisors.

Figures

Figure 1
Figure 1
Number of decision trees in random forest. The maximum accuracy is achieved at 200 trees. Further increasing the number of trees increases the training and execution time without significant accuracy benefits, however it slightly reduces the variance.
Figure 2
Figure 2
Missing data. Blood parameters ordered by decreasing relative frequency. Most parameter values 75.1% are unknown (missing).
Figure 3
Figure 3
Schematic representation of the Smart Blood Analytics (SBA) algorithm process.
Figure 4
Figure 4
Learning curve. Learning curve with increasing numbers of parameters, ordered by their importance according to ReliefF estimate.
Figure 5
Figure 5
Influences of parameter frequency, presence and actual measured values on model accuracy. The actual parameter value (blue line) and its presence (whether it was measured or not (in yellow line) are depicted, as well as relative frequency of the parameters (the ratio of how many times they were measured to the total number of measurements in orange line). To obtain the blue accuracy curve, the actual parameter values were used for training and testing, while for the yellow accuracy curve, the parameter values were replaced with either 0 (not measured) and 1 (measured), and no imputation was used. The flattening of both accuracy curves indicates that, when the frequently measured parameters are present, the rarely measured parameters contribute little to model accuracy.
Figure 6
Figure 6
Graphical representation of the predictive model results. The ten most likely diseases are depicted in a polar chart with varying radii. Each chart slice represents a disease whose angle corresponds to the predicted (posttest) disease probability and whose radius is proportional to the logarithm of the ratio between pre- and post-test, the (prevalence) probability or information score.
Figure 7
Figure 7
Confusion matrix for the five most likely diseases for both predictive models (A) SBA-HEM181 and (B) for SBA-HEM61. Each column of the matrix represents instances of predicted diseases, while each row represents instances of actual diseases. The frequencies are marked on a logarithmic scale.
Figure 8
Figure 8
Macro- and micro-averaged ROC curves with (A) a full set of 181 parameters and (B) a basic set of 61 parameters. The curves almost overlap, and the AUCs are almost identical.
Figure 9
Figure 9
Comparison of the accuracy of internal medicine specialists with both predictive models (A) accuracy of the six haematology specialists compared to both predictive models when considering the five most likely predicted diseases; (B) accuracy of the six haematology specialists compared to both predictive models when considering only the most likely predicted disease; (C) accuracy of the eight non-haematology internal medicine specialists compared to both predictive models when considering the most likely predicted disease.

References

    1. Jordan MI, Mitchell TM. Machine learning: Trends, perspectives, and prospects. Science. 2015;349:255–260. doi: 10.1126/science.aaa8415. - DOI - PubMed
    1. van Ginneken B. Fifty years of computer analysis in chest imaging: rule-based, machine learning, deep learning. Radiological Physics and Technology. 2017;10:23–32. doi: 10.1007/s12194-017-0394-5. - DOI - PMC - PubMed
    1. de Bruijne M. Machine learning approaches in medical image analysis: From detection to diagnosis. Med Image Anal. 2016;33:94–97. doi: 10.1016/j.media.2016.06.032. - DOI - PubMed
    1. Kerr WT, Lau EP, Owens GE, Trefler A. The future of medical diagnostics: large digitized databases. Yale J Biol Med. 2012;85:363–377. - PMC - PubMed
    1. Kukar M, Kononenko I, Grošelj C. Modern parameterization and explanation techniques in diagnostic decision support system: A case study in diagnostics of coronary artery disease. Artificial intelligence in medicine. 2011;52:77–90. doi: 10.1016/j.artmed.2011.04.009. - DOI - PubMed