. 2018 Jan 11;8(1):542.
doi: 10.1038/s41598-017-18863-0.

Functional Antibody Response Against V1V2 and V3 of HIV gp120 in the VAX003 and VAX004 Vaccine Trials

Affiliations

Functional Antibody Response Against V1V2 and V3 of HIV gp120 in the VAX003 and VAX004 Vaccine Trials

Preetha Balasubramanian et al. Sci Rep. .

Abstract

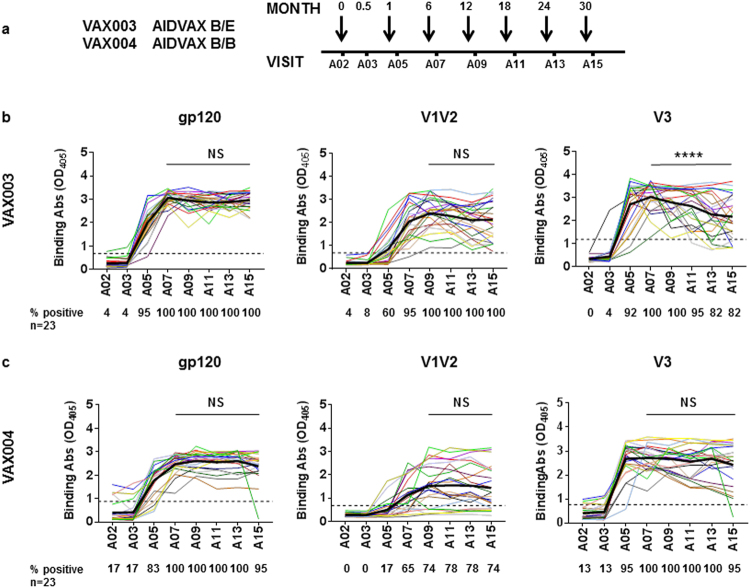
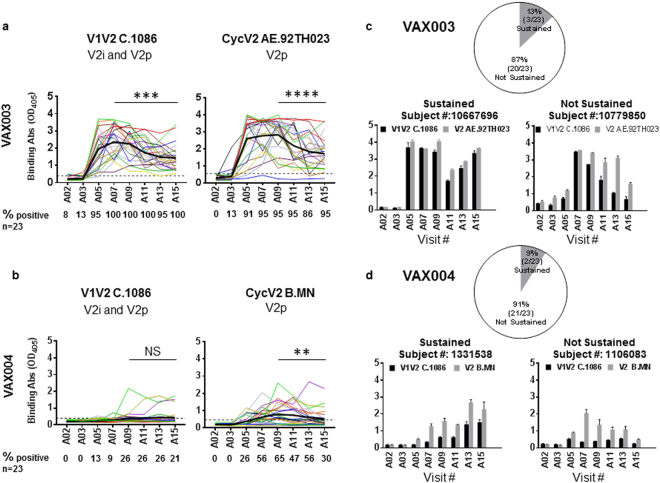
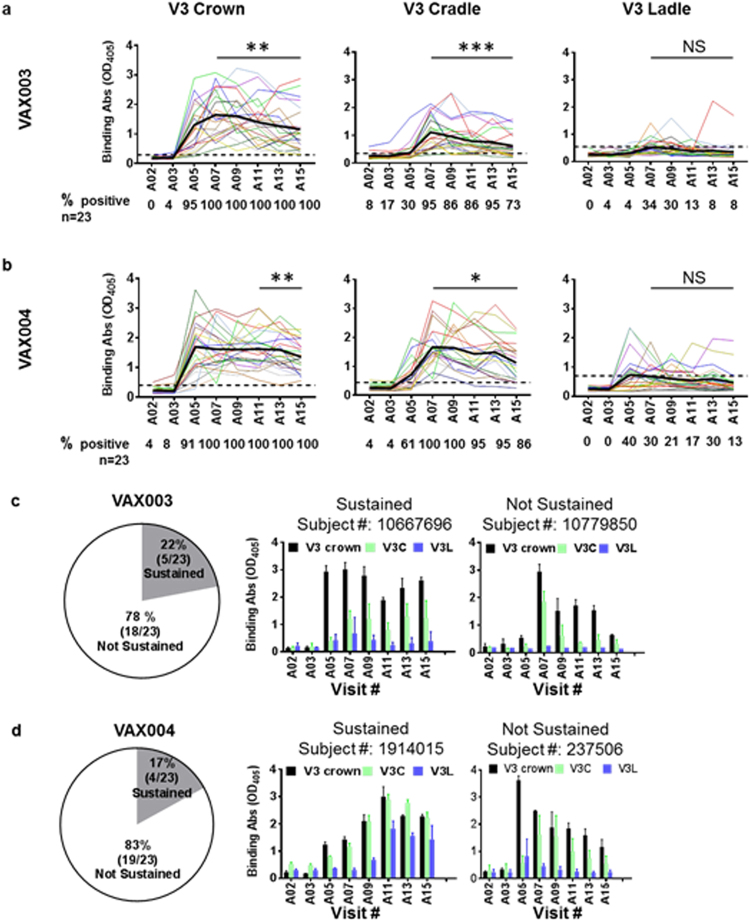
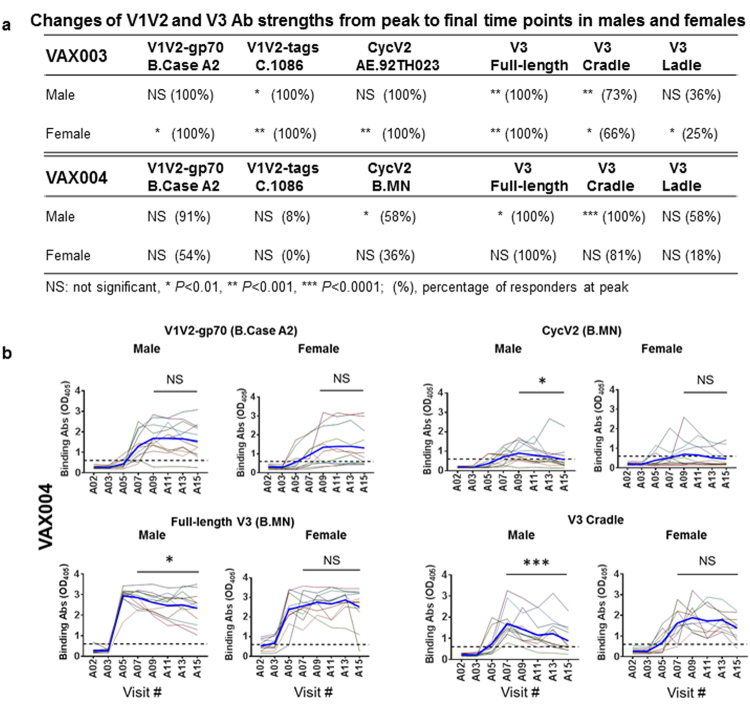
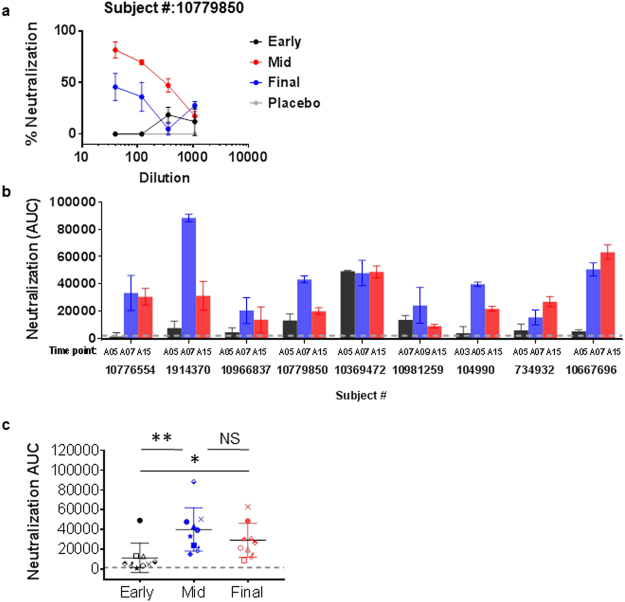
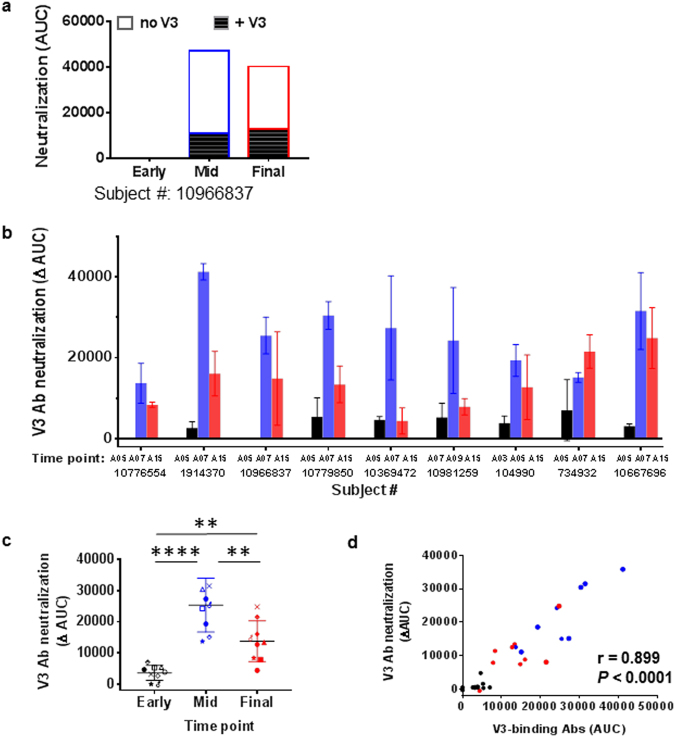
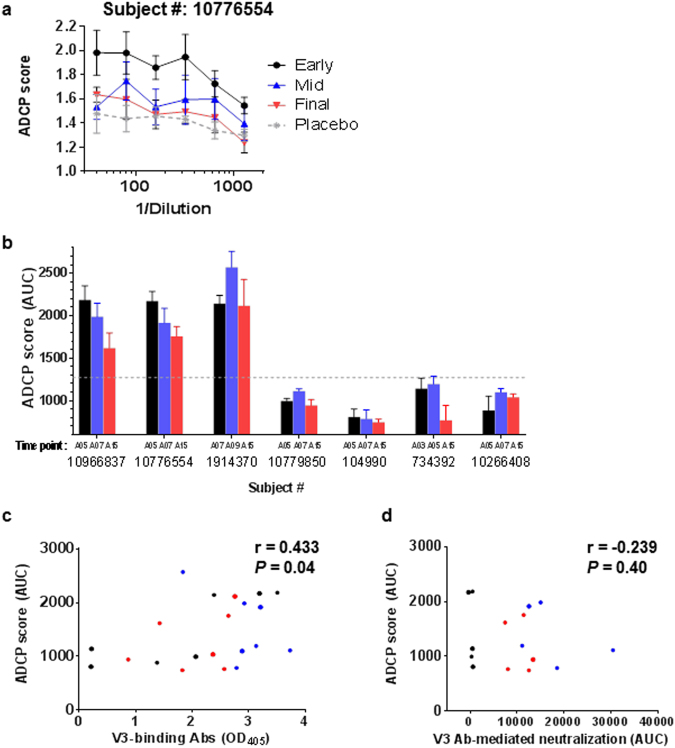
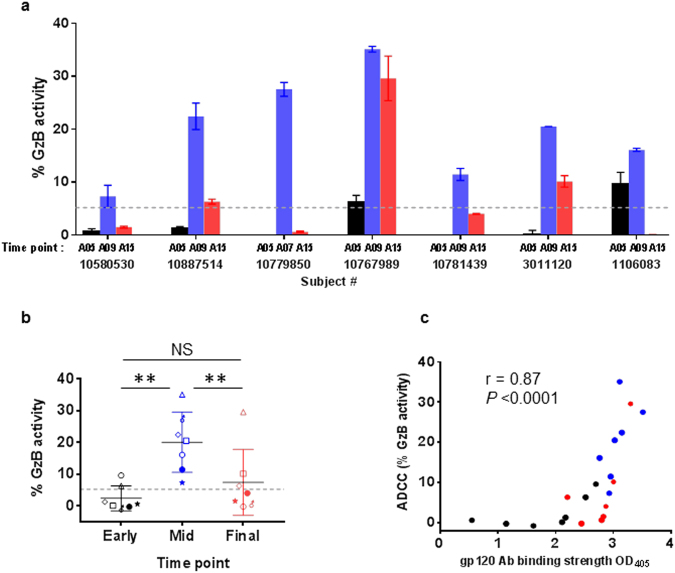
Immunization with HIV AIDSVAX gp120 vaccines in the phase III VAX003 and VAX004 trials did not confer protection. To understand the shortcomings in antibody (Ab) responses induced by these vaccines, we evaluated the kinetics of Ab responses to the V1V2 and V3 regions of gp120 and the induction of Ab-mediated antiviral functions during the course of 7 vaccinations over a 30.5-month period. Plasma samples from VAX003 and VAX004 vaccinees and placebo recipients were measured for ELISA-binding Abs and for virus neutralization, Ab-dependent cellular phagocytosis (ADCP), and Ab-dependent cellular cytotoxicity (ADCC). Ab responses to V1V2 and V3 peaked after 3 to 4 immunizations and declined after 5 to 7 immunizations. The deteriorating responses were most evident against epitopes in the underside of the V1V2 β-barrel and in the V3 crown. Correspondingly, vaccinees demonstrated higher neutralization against SF162 pseudovirus sensitive to anti-V1V2 and anti-V3 Abs after 3 or 4 immunizations than after 7 immunizations. Higher levels of ADCP and ADCC were also observed at early or mid-time points as compared with the final time point. Hence, VAX003 and VAX004 vaccinees generated V1V2- and V3-binding Abs and functional Abs after 3 to 4 immunizations, but subsequent boosts did not maintain these responses.


Conflict of interest statement

The authors declare that they have no competing interests.

Figures

Figure 1
Figure 1
Plasma IgG responses to gp120, V1V2, and V3 in vaccine recipients in the course of 7 immunization doses. Plasma samples from 23 VAX003 (AIDSVAX® B/E) and 23 VAX004 (AIDSVAX® B/B) vaccine recipients were tested at 1:100 dilution for ELISA IgG reactivity against gp120 protein (B.JRFL), V1V2-gp70 protein (B.Case A2), and cyclic full-length 35-mer V3 peptide (B.MN). Samples were tested in duplicate against each antigen in 1 or 2 independent experiments; averages from all experiments are shown. (a) Plasma samples collected before immunization (A02) and 2 weeks after each of 7 vaccine doses (A03, A05, A07, A09, A11, A13, A15) were tested. (b) Longitudinal analysis assessed gp120-, V1V2-, and V3-binding Ab strengths in VAX003 vaccinees. (c) Longitudinal analysis of gp120-, V1V2-, and V3- binding Ab strengths was also performed for VAX004 vaccinees. Comparison of Ab strengths between A15 (final) and A07 or A09 (peak) was done by t test (paired, 2-tailed). Average Ab levels are highlighted by bold black lines. Percentages of responders (% positive) are shown below each graph. Cutoff values (dotted lines) were based on mean and 3 standard deviations of placebo recipients. OD405, optical density at 405 nm. ****P < 0.0001; NS: not significant (P ≥ 0.05).
Figure 2
Figure 2
Anti-V1V2 plasma IgG responses in vaccine recipients over 7 immunization doses. Plasma samples from 23 VAX003 (AIDSVAX® B/E) and 23 VAX004 (AIDSVAX® B/B) trial participants were tested at 1:100 dilution for ELISA IgG reactivity against V1V2-tags (C.1086) expressing V2i and V2p epitopes and cyclic V2 peptides (AE.92TH023 or B.MN) bearing V2p epitopes only. Averages from 2 to 4 replicates tested in 1 or 2 independent experiments are shown. Plasma collection times are described in Fig. 1. (a) Longitudinal analysis compared induction of Ab responses to V1V2-tags (C.1086) and cyclic V2 peptide (AE.92TH023) in VAX003 vaccinees. (b) Similar analysis was performed on VAX004 samples to evaluate the kinetics of Ab responses to V1V2-tags (C.1086) and cyclic V2 peptide (B.MN). OD405, optical density at 405 nm. Percentages of responders (% positive) are shown below each graph. Cut-off values (black dotted lines) were calculated as mean and 3 standard deviations of placebo recipients. Mean antibody levels are highlighted by bold black lines. Comparison of Ab strengths at A15 and peak time points was done by t test (paired, 2-tailed). **P < 0.01, ***P < 0.001; ****P < 0.0001, NS: not significant. (c,d) Few VAX003 and VAX004 vaccinees had sustained Ab responses to V1V2-tags and V2 peptide. The majority of responses to one or both antigens decreased by > 30%. Data of 4 individual vaccine recipients (mean ± standard deviation) with sustained versus not sustained responses are shown.
Figure 3
Figure 3
Anti-V3 crown plasma Ab responses in VAX003 and VAX004 vaccine recipients over 7 immunization doses. ELISA reactivity of plasma IgG from 23 VAX003 and 23 VAX004 vaccinees was assessed against linear V3 crown peptide, cyclic V3 cradle peptide, and cyclic V3 ladle peptide. All peptides were biotinylated. Plasma was tested at prebleed (A02) and 2 weeks after each AIDSVAX B/E vaccine dose (A03-A15). Averages from 4 replicates tested in 2 independent experiments are shown. (a,b) Kinetics of Ab responses induced to V3 crown, V3 cradle, and V3 ladle peptides in VAX003 (a) and VAX004 vaccinees (b). OD405, optical density at 405 nm. Percentages of responders (% positive) are shown below each graph. Cutoff values (black dotted lines) were calculated as mean and 3 standard deviations of placebo recipients. Mean antibody levels are highlighted in bold black lines. *P < 0.05, **P < 0.01, ***P < 0.001; NS: not significant by t test (paired, 2-tailed). (c,d) In the vast majority of VAX003 (c) and VAX004 (d) vaccine recipients, Ab responses against V3 crown and V3 cradle arose after 2 to 3 doses and declined by > 30% with subsequent doses. Data from representative individuals (mean ± standard deviation) with sustained versus not sustained responses are shown.
Figure 4
Figure 4
Comparison of Ab responses to V1V2 and V3 in males and females at peak vs final time points. Plasma samples from 11 male and 12 female VAX003 vaccinees and 12 male and 11 female VAX004 vaccinees were tested at 1:100 dilution for ELISA IgG reactivity against V1V2-gp70 (B.Case A2), V1V2-tags (C.1086), Cyc V2 peptides (AE.92TH023 or B.MN), full-length V3 (B.MN), V3 cradle, and V3 ladle. Samples from A02 visit (prebleed) and 2 weeks after each vaccination (visits A03-A15) were tested. Each sample was tested in 2 to 4 replicates in 1 or 2 independent experiments. (a) Changes of Ab levels from peak (A07 or A09) vs final (A15) time points were evaluated for male vs female vaccinees by paired, 2-tailed t test. Percentages of responders at peak were also calculated. (b) Representative graphs show declining Ab responses to V1V2 and V3 in male but not in female participants of the VAX004 study. Average Ab levels are highlighted by bold blue lines. Cutoff values (dotted lines) were based on mean and 3 standard deviations of placebo recipients. Comparison of Ab strength between A15 (final) and A07 or A09 (peak) was done by t test (paired, 2 tailed). *P < 0.05, **P < 0.01, ***P < 0.001, NS: not significant (P ≥ 0.05). OD405, optical density at 405 nm.
Figure 5
Figure 5
Changes of virus-neutralizing activity detected in plasma of vaccinees during immunization. Plasma samples from VAX003 and VAX004 vaccinees (n = 9 total) were assessed for neutralization against SF162 pseudovirus. For each vaccinee, plasma from 3 time points was selected based on changes in ELISA anti-V3 Ab strength before peak, at peak, and at final A15 time point. Samples were tested in 2 to 4 replicates in 1 or 2 independent experiments. (a) Neutralization of titrated plasma from early, mid-, and last time points from 1 vaccinee. Averages and standard deviation are shown. Plasma was diluted 3-fold from 1:40 to 1:1080, and area under the curve (AUC) was calculated from the titration curve using Graphpad Prism version 7. (b,c) Neutralization activities (AUC ± standard error) at early, mid-, and final time points were compared. Most vaccinees displayed neutralization that peaked at mid-time points, coinciding with the peak of anti-V3 Ab responses, and declined after the final boost. Statistical comparison was performed using the ratio paired 2-tailed t test. *P < 0.05, **P < 0.01; NS: not significant.
Figure 6
Figure 6
Changes of anti-V3 Ab-mediated neutralization in vaccine recipients in the course of immunization. Samples from 6 VAX003 and 3 VAX004 participants were tested in duplicates. (a) Neutralization mediated by anti-V3 Abs was assessed by measuring neutralization activity of plasma treated with or without V3 peptide (20 µg/mL, B.MN sequence, cyclic and nonbiotinylated) against SF162. Areas under the curve (AUC) of untreated and V3-peptide-treated plasma from early, mid-, and final time points are shown for 1 vaccinee. ∆AUC (open bar) was calculated by subtracting AUC of untreated plasma (top bar) from that of treated plasma (solid bar). (b,c) Neutralization by V3 Abs was undetectable at early time points (black), arose at mid-time points (blue), and declined after the final boost (red). ∆AUC ± standard errors are shown. **P < 0.01, ****P < 0.0001by ratio paired 2-tailed t test. (d) ∆AUC values correlated with ELISA V3-binding Ab levels detected in corresponding plasma samples. Correlation analysis was performed using the nonparametric Spearman test.
Figure 7
Figure 7
Induction of anti-V3 Abs with phagocytic activity in vaccine recipients. The phagocytic activity of anti-V3 Abs in plasma of 7 vaccinees (4 VAX003 and 3 VAX004) was assessed using fluorophore Neutravidin™ beads coated with a biotinylated, cyclic, full-length V3 peptide (4 µg V3 peptide mixed with 2 µg scrambled peptide for 10 µL of beads/96 wells) for 2 h at 37 °C, washed, and resuspended in PBS with 0.1% BSA. Beads (9 × 105/10 µL/well) were incubated with serially diluted plasma, anti-V3 mAb, or irrelevant mAb for 2 h at 37 °C, washed, and added to THP-1 cells (2.5 × 104/well; ATCC®). After overnight incubation, phagocytosis was measured by flow cytometry. ADCP score was calculated by multiplying the percentage of bead-bearing cells with geometric mean intensity of the cells and subtracting background score. (a) Antibody-dependent cellular phagocytosis (ADCP) activities of plasma from 1 vaccinee were diluted 2-fold 6 times from 1:40. Plasma samples from early, mid-, and final time points were compared with plasma from a placebo recipient. Averages and standard error from 4 replicates tested in 2 independent experiments are shown. (b) ADCP activities were measured in plasma from 7 vaccinees collected at early, mid-, and final time points and shown as area under the curve (AUC ± standard error) of ADCP scores. Cutoff value (dotted lines) was determined based on mean plus 3 standard deviations of placebo ADCP scores. (c) Correlation between ADCP score and ELISA V3-binding Ab levels was analyzed by the Spearman test. (d) V3-specific ADCP and V3 Ab-mediated neutralization activities were correlated by the Spearman test.
Figure 8
Figure 8
Induction of ADCC activity in vaccine recipients. Antibody-dependent cellular cytolysis (ADCC) activity was measured using CEM.NKr-CCR5 target cells coated with SF162 gp140 (5 µg/100,000 cells/sample), labeled with TL4 dye, and treated with diluted plasma (1:200) and with rhesus CD16+ human NK KHYG-1 effector cells at an effector/target ratio of 5:1. The mixtures were then suspended in a granzyme B (GzB) substrate for 30 min at 37 oC. GzB delivered into target cells by effector cells was detected with the fluorogenic GzB substrate and visualized by flow cytometry. ADCC was calculated based on percentage of GzB+ target cells above negative control. Cut-off value (dotted line) was determined as the mean plus 3 standard deviations of % GzB+ cells in pooled prebleed plasma. (a) ADCC activities were measured in plasma of 5 VAX003 and 2 VAX004 vaccinees collected at early (A05, after 2 vaccine doses), mid- (A07 or A09, after 3 or 4 doses), and final (A15, after 7 doses) time points. Averages and standard deviation of duplicate wells from an experiment are shown. (b) ADCC activity was detected at mid-time points (A07 or A09) but declined at A15. **P > 0.01; by the paired 2-tailed t test. (c) ADCC activity strongly correlated with anti-gp120 Ab levels detected in ELISA. Correlation analysis was performed using the nonparametric Spearman test.

References

    1. Plotkin SA. Correlates of Protection Induced by Vaccination. Clin Vaccine Immunol. 2010;17:1055–1065. doi: 10.1128/CVI.00131-10. - DOI - PMC - PubMed
    1. Pitisuttithum P, et al. Randomized, double-blind, placebo-controlled efficacy trial of a bivalent recombinant glycoprotein 120 HIV-1 vaccine among injection drug users in Bangkok, Thailand. Journal of Infectious Diseases. 2006;194:1661–1671. doi: 10.1086/508748. - DOI - PubMed
    1. Flynn MN, et al. Placebo-controlled phase 3 trial of a recombinant glycoprotein 120 vaccine to prevent HIV-1 infection. Journal of Infectious Diseases. 2005;191:654–665. doi: 10.1086/428404. - DOI - PubMed
    1. Gilbert PB, et al. Correlation between immunologic responses to a recombinant glycoprotein 120 vaccine and incidence of HIV-1 infection in a phase 3 HIV-1 preventive vaccine trial. Journal of Infectious Diseases. 2005;191:666–677. doi: 10.1086/428405. - DOI - PubMed
    1. Haynes BF, et al. Immune-Correlates Analysis of an HIV-1 Vaccine Efficacy Trial. New Engl J Med. 2012;366:1275–1286. doi: 10.1056/NEJMoa1113425. - DOI - PMC - PubMed

Publication types

LinkOut - more resources