

The value of narrow band imaging in diagnosis of head and neck cancer: a meta-analysis
- PMID: 29323235
- PMCID: PMC5765024
- DOI: 10.1038/s41598-017-19069-0
The value of narrow band imaging in diagnosis of head and neck cancer: a meta-analysis
Abstract
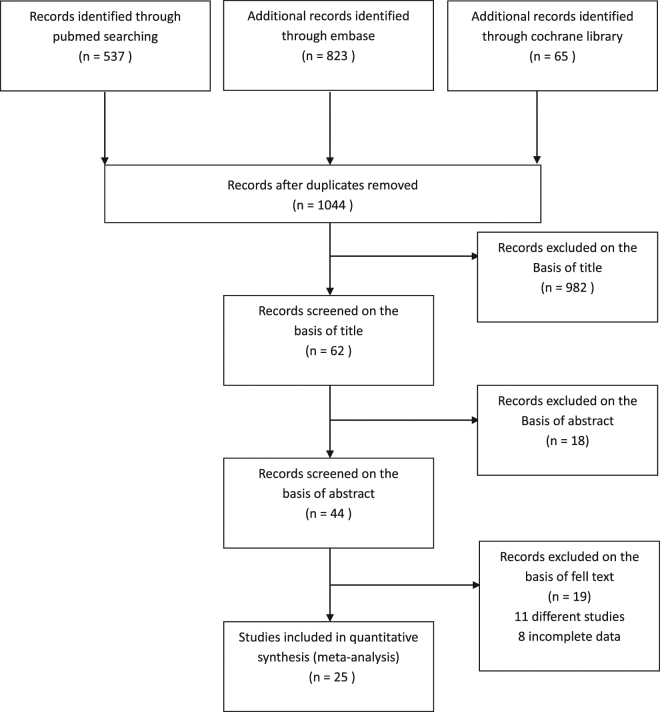
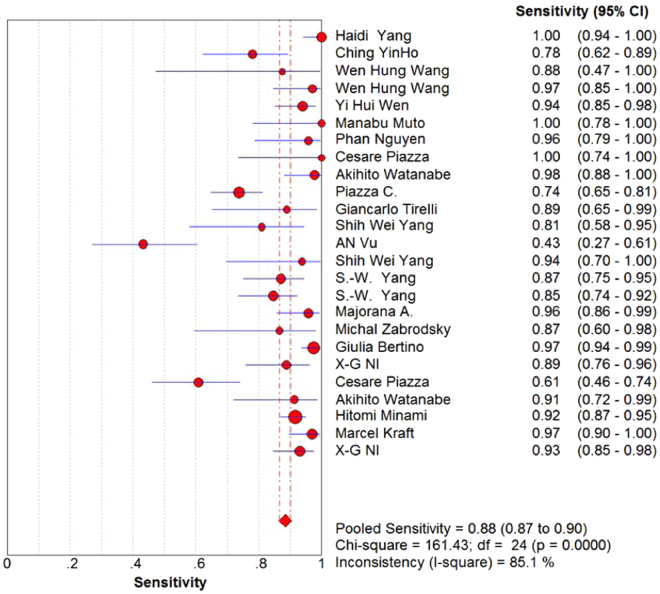
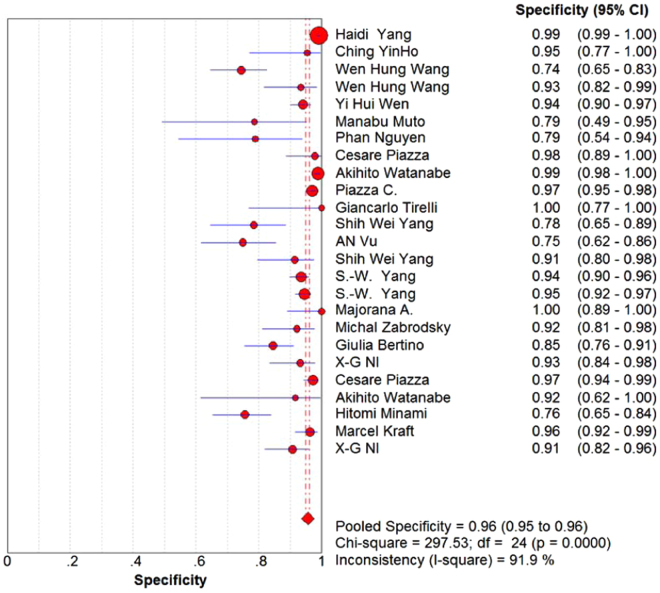
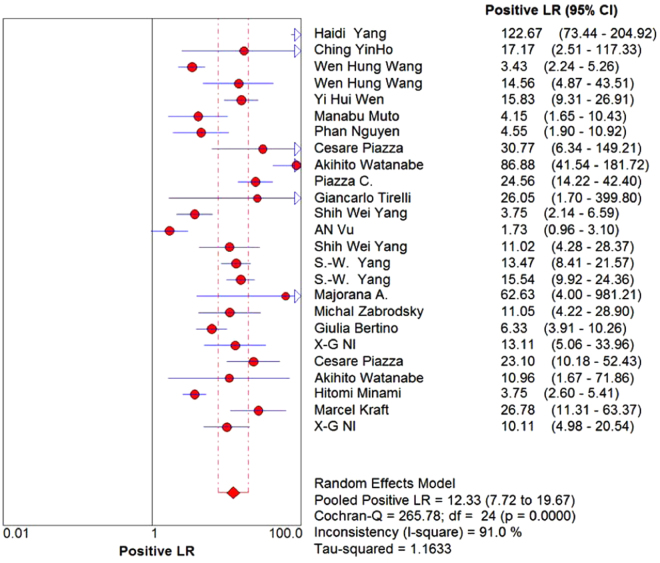
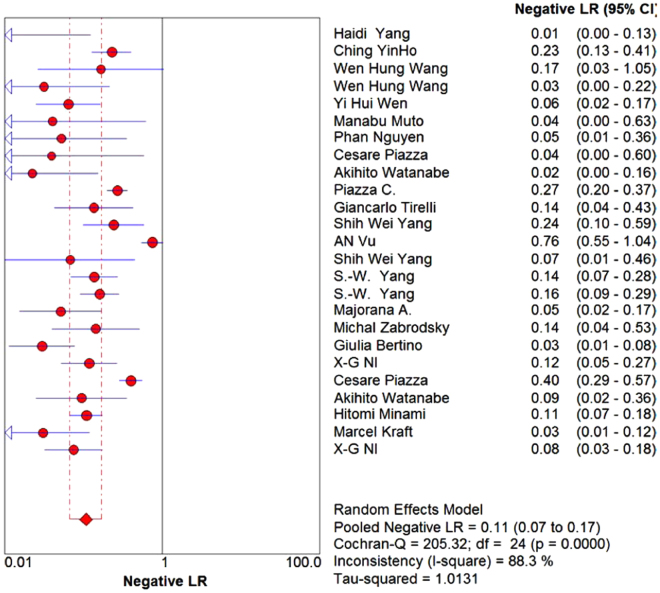
Head and neck cancer is difficult to diagnose early. We aimed to estimate the diagnosis value of narrow band imaging(NBI) in head and neck cancers. We identified relevant studies through a search of PubMed, Embase and the Cochrane Library. We used a random effect model. Subgroup analysis and meta-regression analysis were performed to estimate the factors which may influence the sensitivity and specificity of the NBI. We included 25 studies with total 6187 lesions. The pooled sensitivity, specificity, positive likelihood rate, negative likelihood rate and diagnostic odds ratios of NBI were 88.5%, 95.6%, 12.33, 0.11 and 121.26, respectively. The overall area under the curve of SROC was 96.94%. The location, type of assessment, type of endoscope system and high definition were not significant sources of heterogeneity (P > 0.05). However, magnification may be related to the source of heterogeneity (P = 0.0065). Therefore, NBI may be a promising endoscopic tool in the diagnosis of head and neck cancer.
Conflict of interest statement
The authors declare that they have no competing interests.
Figures
References
-
- Schuetz GM, Tackmann R, Hamm B, Dewey M. Quality of diagnostic accuracy studies: QUADAS (Quality Assessment of Diagnostic Accuracy Studies Included in Systematic Reviews) RoFo: Fortschritte auf dem Gebiete der Rontgenstrahlen und der Nuklearmedizin. 2010;182:939–942. doi: 10.1055/s-0029-1245723. - DOI - PubMed
-
- Jemal A, et al. Cancer statistics, 2008. CA: a cancer journal for clinicians. 2008;58:71–96. - PubMed
Publication types
MeSH terms
LinkOut - more resources
Full Text Sources
Other Literature Sources
Medical
