. 2018 Jan 11;553(7687):212-216.
doi: 10.1038/nature25168. Epub 2018 Jan 3.

Clonal analysis of lineage fate in native haematopoiesis

Affiliations

Clonal analysis of lineage fate in native haematopoiesis

Alejo E Rodriguez-Fraticelli et al. Nature. .

Abstract

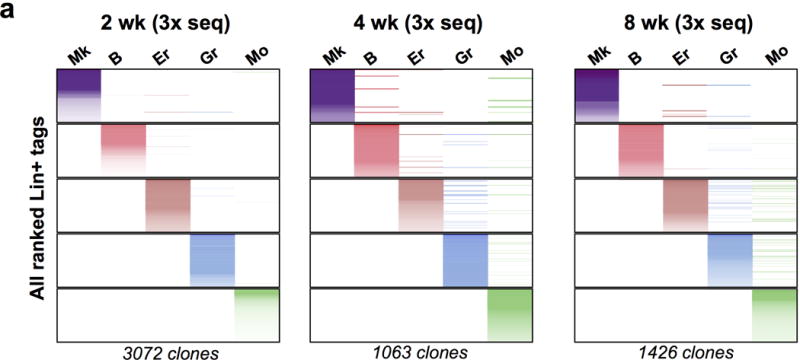
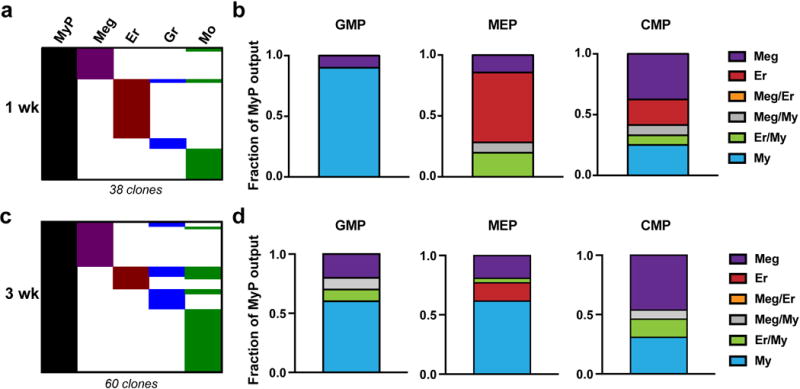
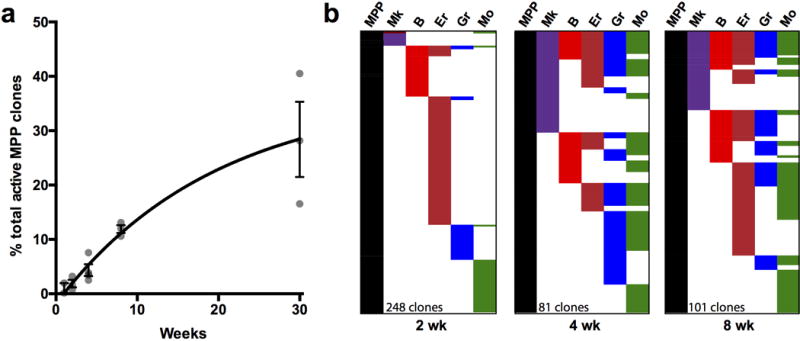
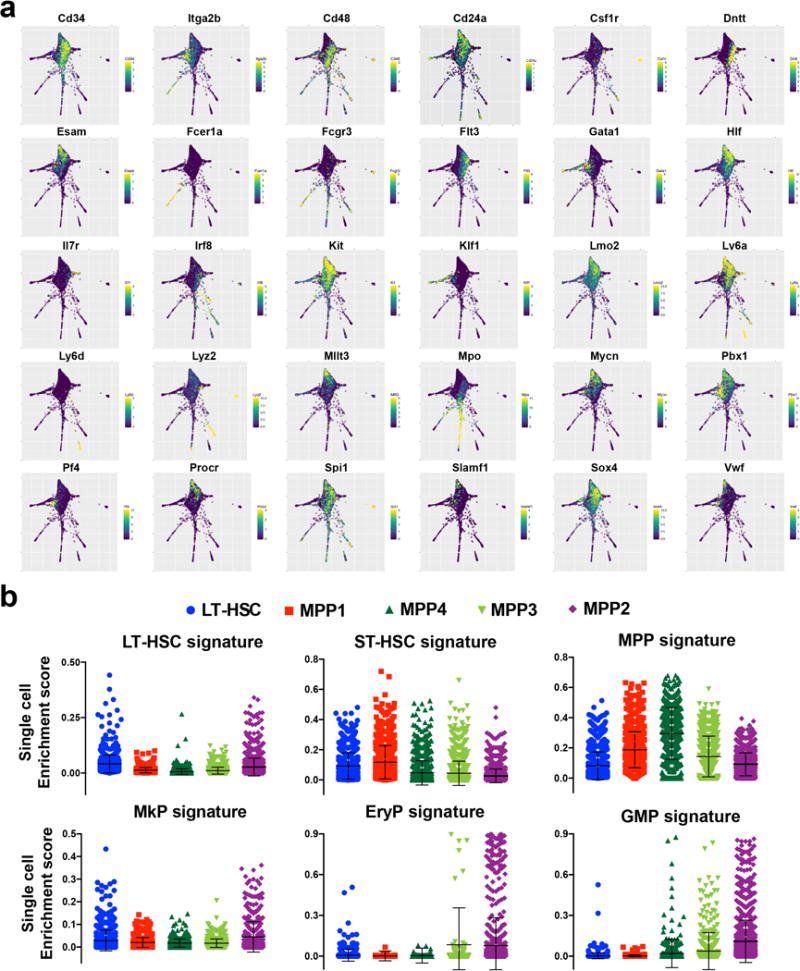
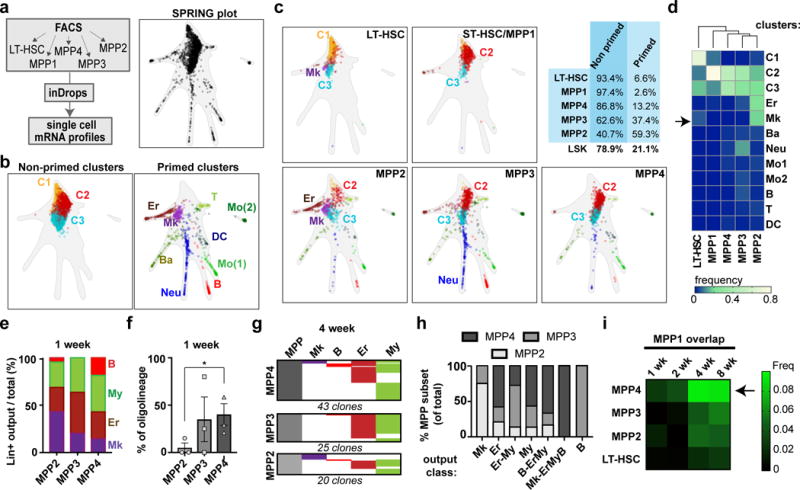
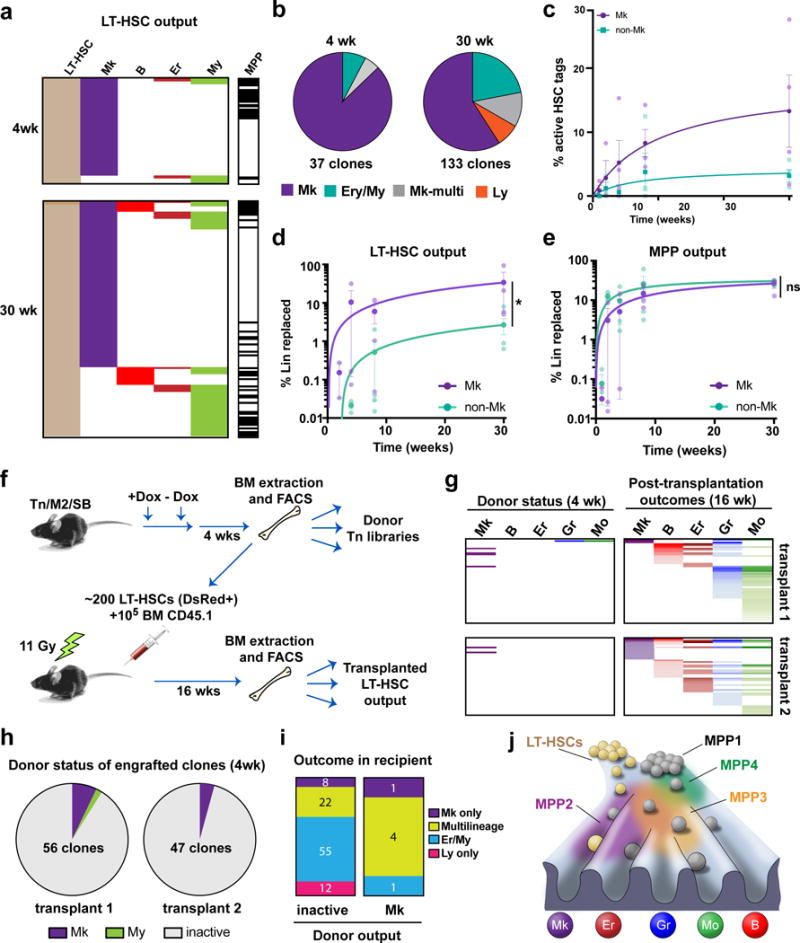
Haematopoiesis, the process of mature blood and immune cell production, is functionally organized as a hierarchy, with self-renewing haematopoietic stem cells and multipotent progenitor cells sitting at the very top. Multiple models have been proposed as to what the earliest lineage choices are in these primitive haematopoietic compartments, the cellular intermediates, and the resulting lineage trees that emerge from them. Given that the bulk of studies addressing lineage outcomes have been performed in the context of haematopoietic transplantation, current models of lineage branching are more likely to represent roadmaps of lineage potential than native fate. Here we use transposon tagging to clonally trace the fates of progenitors and stem cells in unperturbed haematopoiesis. Our results describe a distinct clonal roadmap in which the megakaryocyte lineage arises largely independently of other haematopoietic fates. Our data, combined with single-cell RNA sequencing, identify a functional hierarchy of unilineage- and oligolineage-producing clones within the multipotent progenitor population. Finally, our results demonstrate that traditionally defined long-term haematopoietic stem cells are a significant source of megakaryocyte-restricted progenitors, suggesting that the megakaryocyte lineage is the predominant native fate of long-term haematopoietic stem cells. Our study provides evidence for a substantially revised roadmap for unperturbed haematopoiesis, and highlights unique properties of multipotent progenitors and haematopoietic stem cells in situ.


Conflict of interest statement

The authors declare no competing financial interests.

Figures

Extended Data Fig. 1
Extended Data Fig. 1. TARIS
a, Illustration of the TARIS procedure. The procedure is described in detail in the Methods section of this manuscript.
Extended Data Fig. 2
Extended Data Fig. 2. Evaluation of the TARIS method
a, Design for the detection limit experiment. Spike-ins of a known number of HEK293 cells carrying unique Tn integration tags was used in a mix of 10,000 DsRed+ peripheral blood cells from a freshly induced HSB mouse. b, Detection limit chart. Values represent the read number for each clone and for each number of input cells. Both axes are in log10 scale. Values represent the sum of two independent experiments. c, Comparison of the average read number value between TARIS and the Ligation-mediated PCR (LM-PCR) method. Values represent mean +/− SD of 5 different Tn tag clones. d, Reproducibility analysis in a non-whole genome amplified sample with high complexity (2×10⁵ BM granulocytes 4 wk after pulse). e, Reproducibility in a whole-genome amplified sample with low complexity (863 LT-HSCs 4 wk after pulse). f, Venn diagram showing overlapping Tn tag reads between two TARIS replicates from the same sample high-complexity sample (2×10⁵ BM monocytes at 4 wk post-induction). g, Venn diagram showing overlapping Tn tag reads between two TARIS replicates from the same low-complexity sample (863 LT-HSCs at 4 wk post-induction). h, Contamination analysis between samples from two different mice. The plot represents the read numbers of tags from Lin+ populations from mouse 1, and their read number values in Lin+ populations in mouse 2. High confidence tags are selected as those tags with more than 25 reads, and at least 10-times higher read count compared to any of the samples from a separate mouse.
Extended Data Fig. 3
Extended Data Fig. 3. Analysis of residual HSB activity after doxycycline withdrawal
a, Experimental design. Residual HSB activity after Dox removal was assayed by transplantation into CD45.1 mice. Sub-lethally irradiated recipients were treated with Dox for 48h. Dox was removed 12h before transplantation. Ten million whole BM cells were transplanted and mice were allowed to recover for 2 weeks. As a positive control, mice were continuously treated with Dox until 48h after transplant. As a negative control, cells were transplanted into non-Dox treated mice. DsRed labelling was analysed as a proxy for HSB activity in Granulocytes, Erythroblasts, Monocytes and B cells. b, FACS plots showing the negligible labelling of CD45.2 M2/HSB/Tn cells in transplanted recipients 24h after Dox-removal.
Extended Data Fig. 4
Extended Data Fig. 4. Additional representations and analyses of Lin+ tags
a, Lin+ clones of the second and third mice used for quantifications in Fig. 1d–g. b, Scale-adjusted binary (presence/absence) representation of all detected Mk and Er tags in the experiments from Fig. 1d–g. c, Relative quantification of scale-normalized clone sizes for each lineage, comparing unilineage vs. oligo/multilineage clones. Values are interquartile range and median from 3 independent mice at 4 week and 8 week post-induction.
Extended Data Fig. 5
Extended Data Fig. 5. Validation of My/Er and Mk-restricted tags
a, Three independent Tn tag libraries were prepared and sequenced from 2wk, 4wk and 8wk-chased mice. Reads from the three libraries were then pooled together for each lineage.
Extended Data Fig. 6
Extended Data Fig. 6. Lineage fate of myeloid-progenitors
a, Two M2/HSB/Tn mice were induced and chased for 1 week, and then myeloid progenitors (GMP, MEP and CMP) and Lin+ cells were isolated from bone marrow and their Tn-tag content was analysed. Chart is a binary representation of all Lin+ tags overlapping with any myeloid progenitor tag ranked by lineage. b, Quantification of relative lineage contribution of GMPs, MEPs and CMPs as a fraction of lineage-specific/total lineage-overlapping clones for each MyP subset. Values are mean of the two analysed mice. c, An additional M2/HSB/Tn mouse was induced and chased for 3 weeks, and then processed as in (a). d, Quantification of relative lineage contribution of GMPs, MEPs and CMPs at 3 weeks post-labelling.
Extended Data Fig. 7
Extended Data Fig. 7. Additional analyses of MPP clonal outcomes
a, Quantification of the percentage of MPP clones that produced any Lin+ progeny at different time points. Values are average +/− SD from 3 mice. b, Three independent Tn tag libraries were prepared and sequenced for all the populations from one bone marrow at 2, 4 and 8 wk post-labeling. Each column in the charts represent the combined tags detected in any of the three libraries for each population.
Extended Data Fig. 8
Extended Data Fig. 8. Single cell heterogeneity of HSC/MPPs
a, SPRING plots showing selected differentially expressed markers. Scale represents amount of detected mRNA copies (normalized) of each marker gene. b, Enrichment score analysis for single cells in each FACS-sorted population compared to previously obtained bulk transcriptional signatures of BM populations sorted using traditional markers (from the Immgen database).
Extended Data Fig. 9
Extended Data Fig. 9. Differentially expressed markers for clusters C1, C2, C3, and Mk
a, FACS plots showing heterogeneity in expression of cluster markers within the analysed HSC/MPP subsets. b, FACS plots showing expression of different Mk-primed cluster markers (CD41, CD42 and CD9) within the LT-HSC gate. c, The table shows the expression value (nTrans) and percentage of expressing cells from each cluster (%Exp). The top 10 highest expressed genes that distinguish each cluster are shown.
Extended Data Fig. 10
Extended Data Fig. 10. Additional data on clonal origin of Mk progenitors
a, Three independent Tn tag libraries were prepared and sequenced for LT-HSC, MPP, and the five Lin+ populations, from one mouse at 4 weeks. Each column represents the combined tags detected from 3 amplicon libraries prepared for each population, to facilitate visualization of the smallest clones. Tags are coloured by frequency in each lineage, and organized by rank. b, Origin of Mk. Alignment of all Mk clones which had detectable tags in HSC/MPPs from a mixed library combining 3 independent sequencing reactions. Tags are coloured by frequency in each lineage (except for Mk), and organized by rank. Arrows indicate tags verified by clone-specific PCR. c, Alignment of Tn tags from all Lin+ populations, LT-HSCs and MPPs collected from 30 wk chased-mice. Tags are coloured by frequency in each lineage, and organized by rank. d, Experimental design for testing in vitro myeloid and lymphoid potential from sorted LT-HSCs. e, In vitro myeloid potential of LT-HSCs. Alignment of donor Lin+ tags with Tn tags obtained from myeloid and lymphoid cells derived from donor LT-HSCs after 2 weeks in culture. f, Clonal output of CD41hi and CD41lo LT-HSCs at 4 weeks post labeling. g, Quantification of Mk lineage replacement by CD41hi vs. CD41lo LT-HSCs (measured as % of overlapping/total Mk reads) at 4 weeks post labeling. Values are mean +/− s.e.m. of 3 independent mice.
Fig. 1
Fig. 1. Clonal analysis of hematopoietic lineage fates in the native bone marrow
a, M2/HSB/Tn mouse model. Addition of doxycycline (Dox) induces random transposition of the Tn, and concomitant cell labelling with DsRed. The Tn insertion site is stable after removal of Dox. b, Transposon lineage tracing paradigm. Shared tags can be detected between a self-renewing progenitor stem cell and its progeny, or between two different mature cell populations. c, Experimental design. M2/HSB/Tn mice were labelled with Dox for 2 days and 5 blood lineages were isolated from BM after different periods of time. Tn-insertion tag libraries were prepared and sequenced for each population. d, Alignment of Tn tags from different lineage-committed (Lin+) blood cell populations in the BM at 1–8 weeks. Tags are coloured by frequency in each lineage, and organized by rank. Each chart is representative from 3 independent experiments. e, Percentage of clonal overlap between designated lineage pairs (left), and quantification of total number of detected bi/tri-lineage clones at 1–8 weeks (right). My refers to either Gr or Mo lineage. Mean +/− s.d. from 3 independent mice. f, Spearman correlation coefficient (ρ) matrices for all Lin+ tags at 1–8 weeks. Each matrix is average from 3 independent experiments per time point. g, Hierarchical clustering of blood lineages using (1–ρ) as the distance measure (4 and 8 weeks post-labelling).
Fig. 2
Fig. 2. Functional heterogeneity of MPP lineage fates in steady state hematopoiesis
a, Chart shows the alignment of all active MPP tags together with the five analysed blood lineages at each time point (all tags collected from 3 mice per time point). LT-HSC tags were analysed in parallel and excluded from the analysis to represent only MPP behaviour. b, Fraction of active MPP tags that overlap with a single lineage (calculated independently for each lineage). Values are mean +/− s.e.m. from 3 mice. *pMk-Er=0.13, pMk-Gr=0.03, pMk-Mo=0.03, pMk-B=0.001 (8 wk). c, Distribution of Lin+ clone sizes comparing tags overlapping with MPP vs. non-overlapping at 8 wk. Values are median and interquartile ranges of all detected clones from 3 mice. *Kolmogorov-Smirnov pMk=0.03, pB=0.25, pEr=0.03, pGr=0.001, pMo=0.003. d, Fraction of each lineage replaced by MPPs calculated as the percentage of total MPP-overlapping lineage reads over time. Values are mean +/− s.e.m. from 3 independent mice. *pEr-Gr/Mo/B=0.04, pEr-Mk=0.03 (2 weeks) and pB-Er/Mk=0.03, pB-My=0.04 (8 weeks). e, Average number of detected active MPP clones per lineage per mouse at different time points (normalized for %DsRed labelling efficiency).
Fig. 3
Fig. 3. Transcriptional and functional hierarchy of HSC and MPP subsets
a, Experimental design for inDrops experiment (left). Transcriptional fate map of combined FACS-sorted subsets using the SPRING representation (subsampled in silico to represent proportions of the LinSca1+cKit+ gate. Points represent a single HSC/MPPs distributed according to their similarity using gene expression variation. b, In silico identification of different cell populations within all combined HSC and MPP subsets. Non-primed clusters 1-3 (C1-C3, left) and lineage-primed clusters (right) are presented separated and labelled according to their primed lineage signatures: Neu, neutrophils, DC, dendritic cells, T, T-cell progenitors, B, B-cell progenitors, Ery, erythroid progenitors, Mk, megakaryocyte progenitors: Mo1 and Mo2 represent two monocyte-like signatures. c, Plots showing localization of each sorted HSC/MPP subset within the combined SPRING plot. Top right, fraction of cells from each sorted HSC/MPP subtype (and LSKs) that group within primed or non-primed clusters. d, Hierarchical clustering (Ward) of sorted HSC/MPP subsets. For each FACS sorted population, the fraction of cells corresponding to each cluster was used to analyse the similarity between subsets. The arrow points out the Mk-primed cluster within the LT-HSC gate. e, Fraction of lineage-restricted MPP-overlapping clones corresponding to each lineage, for each MPP subset at 1 week. Values are mean of 3 independent mice. f, Fraction of oligolineage output of each MPP subset after 1 week. Values are mean +/− s.e.m. of three independent mice. *Paired two-tailed t-test (MPP2 vs. MPP4) p=0.033 g, Alignment of Lin+ progeny tags of different MPP subsets (excluding tags present in HSCs/MPP1s) at 4 weeks. h, Fraction corresponding to each MPP subset for each representative lineage fate (including restricted, oligo and multilineage output) at 4 weeks (all tags detected from 4 mice). i, Frequency of MPP2/3/4 tags (and LT-HSC tags) overlapping with MPP1 at 1-8 weeks (average of 3 mice per time point).
Fig. 4
Fig. 4. Steady state megakaryocyte output from bona fide LT-HSCs
a, LT-HSCs, MPPs and Lin+ cells were purified from bone marrow at 4 and 30 wk and their Tn-tag content was analysed. Only the LT-HSC tags overlapping with detectable Lin+ progeny are shown. b, Pie-chart distribution of types of progeny detected from LT-HSCs at 4 weeks and 30 weeks after labeling. Data are pooled from 4 independent M2/HSB/Tn mice per time point. c, Percentage of labelled LT-HSC clones producing progeny at 1-8 weeks. Values are mean +/− s.e.m of 3-4 independent mice. d, Dynamics of Mk vs. non-Mk lineage replacement by LT-HSCs (measured as % of overlapping/total Lin+ reads). Values are mean +/− s.e.m. of 3-4 independent mice. Ratio paired t-test p=0.014. e, Dynamics of Mk vs. Er/My lineage replacement by MPPs (measured as % of overlapping/total Lin+ reads). Values are mean +/− s.e.m. of 3-4 independent mice. Ratio paired t-test p=0.599. f, Experimental design for parallel analysis of native vs. transplant output of LT-HSC clones. g, Alignment of all post-transplantation LT-HSC-derived lineages with unperturbed donor lineage tags. h, Pie-chart distribution of successfully engrafted LT-HSC clones by donor behaviour. Only Mk-restricted and My-restricted output was observed. Inactive means non-detectable output in the donor. i, Post-transplantation outcomes comparing donor-inactive vs. Mk-producing LT-HSC clones. j, Lineage fate landscape of unperturbed hematopoiesis. Self-renewing LT-HSCs preferentially replace Mk under steady state, and principally contribute to other blood lineages during transplantation or after injury. In contrast, MPPs take care of the majority of steady-state Ly, Er and My blood production. Different MPP sorting gates enrich for heterogeneous collections of lineage-primed and unprimed cell states within a continuum of lineage commitment pathways.

References

    1. Morrison SJ, Wandycz AM, Hemmati HD, Wright DE, Weissman IL. Identification of a lineage of multipotent hematopoietic progenitors. Development. 1997;124:1929–1939. - PubMed
    1. Morrison SJ, Weissman IL. The long-term repopulating subset of hematopoietic stem cells is deterministic and isolatable by phenotype. Immunity. 1994;1:661–673. - PubMed
    1. Adolfsson J, et al. Identification of Flt3+ lympho-myeloid stem cells lacking erythro-megakaryocytic potential a revised road map for adult blood lineage commitment. Cell. 2005;121:295–306. doi: 10.1016/j.cell.2005.02.013. - DOI - PubMed
    1. Akashi K, Traver D, Miyamoto T, Weissman IL. A clonogenic common myeloid progenitor that gives rise to all myeloid lineages. Nature. 2000;404:193–197. doi: 10.1038/35004599. - DOI - PubMed
    1. Ceredig R, Rolink AG, Brown G. Models of haematopoiesis: seeing the wood for the trees. Nat Rev Immunol. 2009;9:293–300. doi: 10.1038/nri2525. - DOI - PubMed

Publication types