. 2018 Jan 11;553(7687):171-177.
doi: 10.1038/nature25154. Epub 2018 Jan 3.

Alcohol and endogenous aldehydes damage chromosomes and mutate stem cells

Affiliations

Alcohol and endogenous aldehydes damage chromosomes and mutate stem cells

Juan I Garaycoechea et al. Nature. .

Abstract

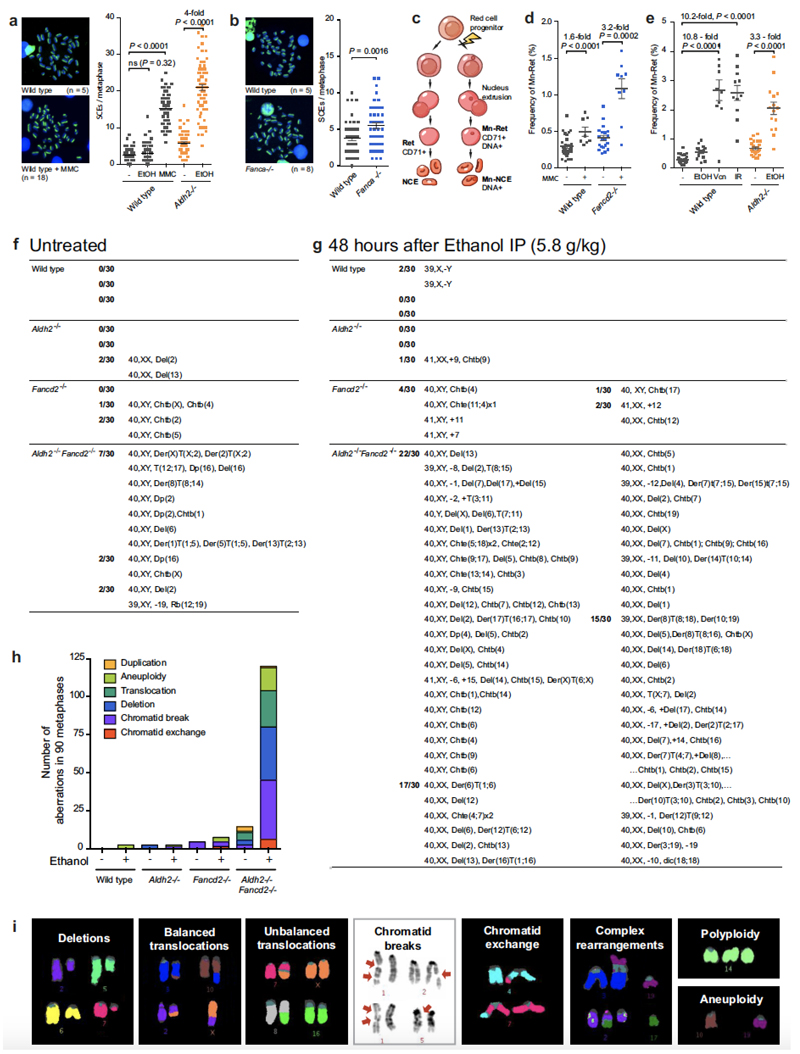
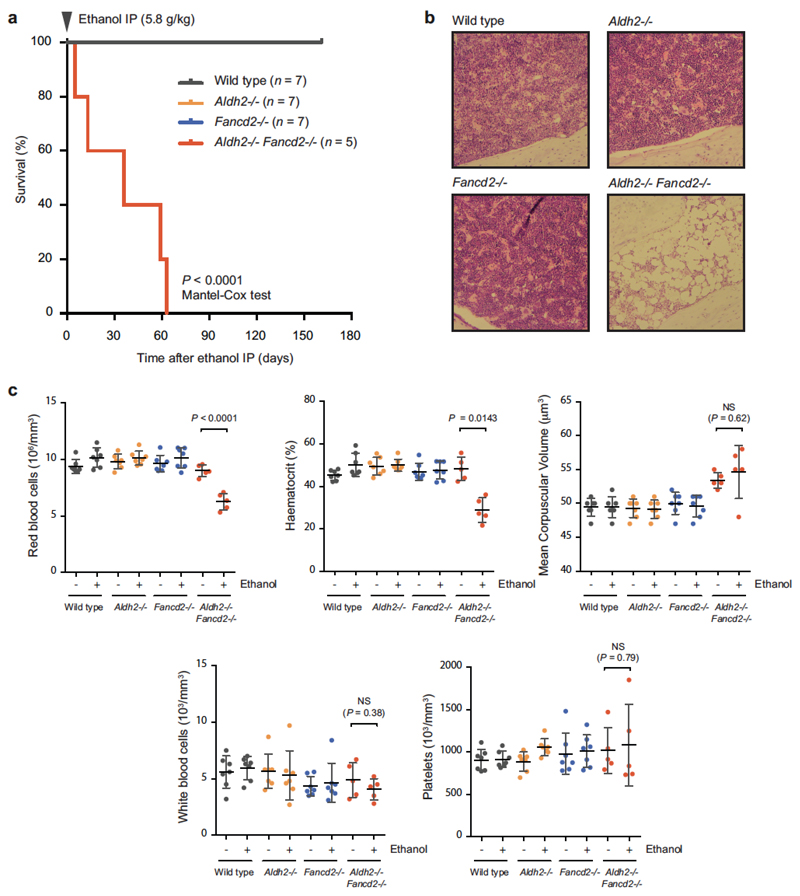
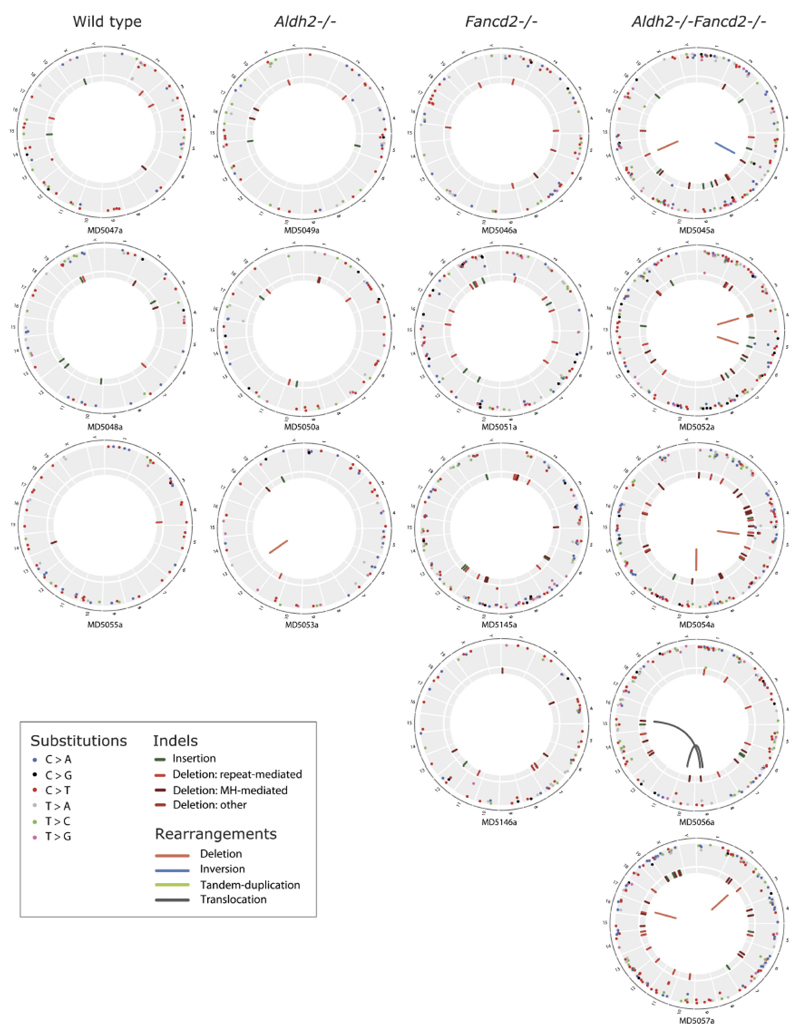
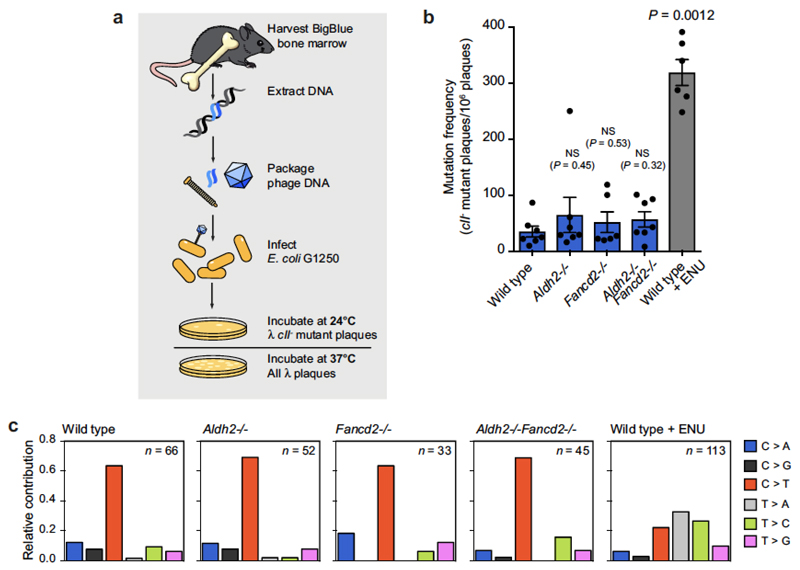
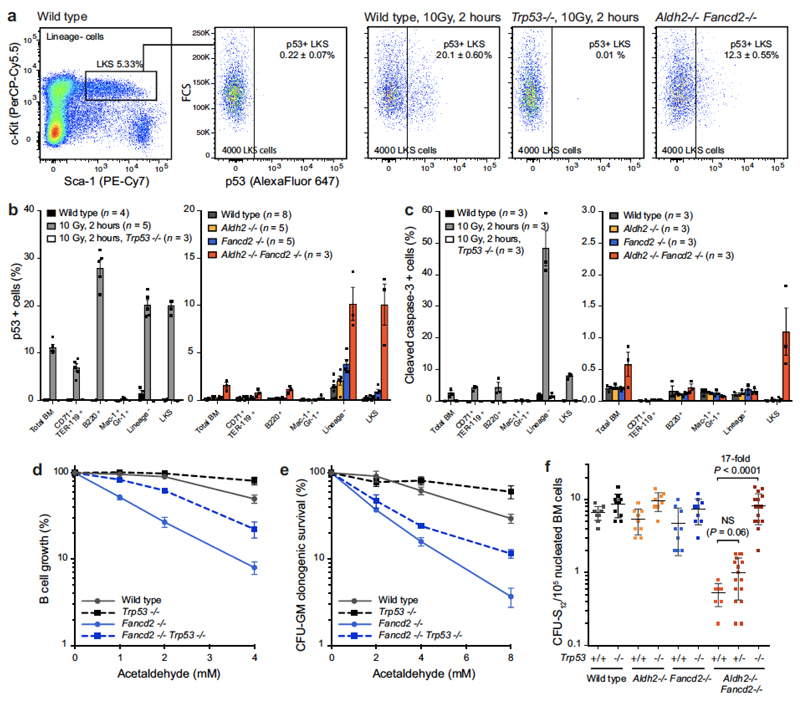
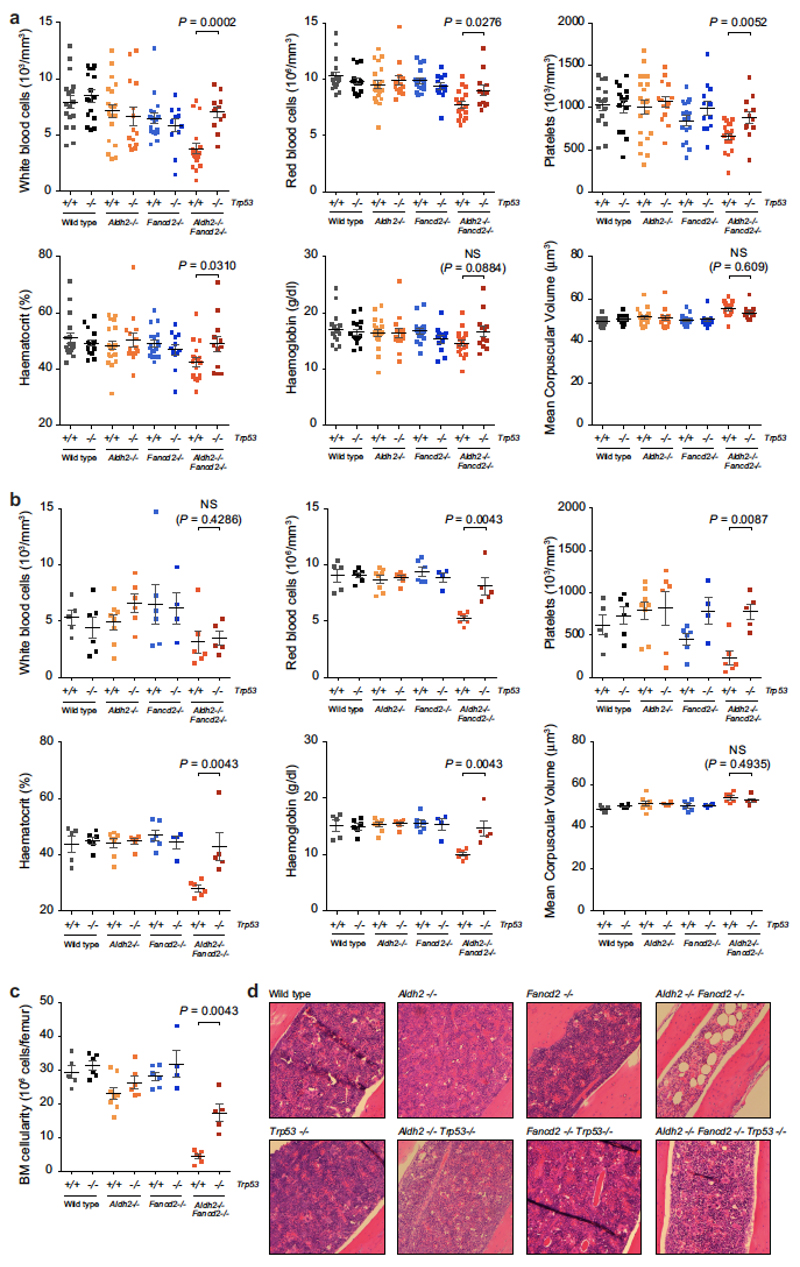
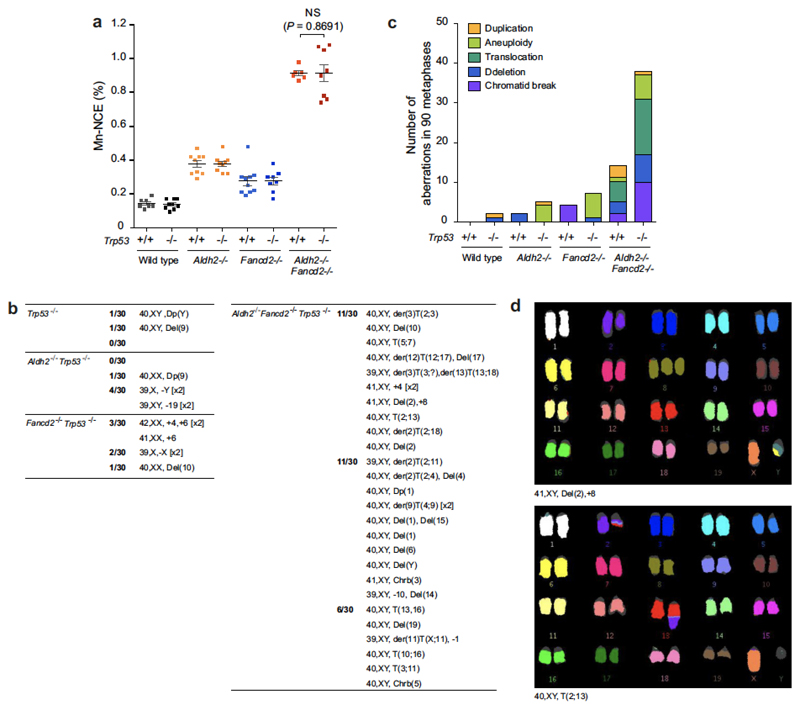
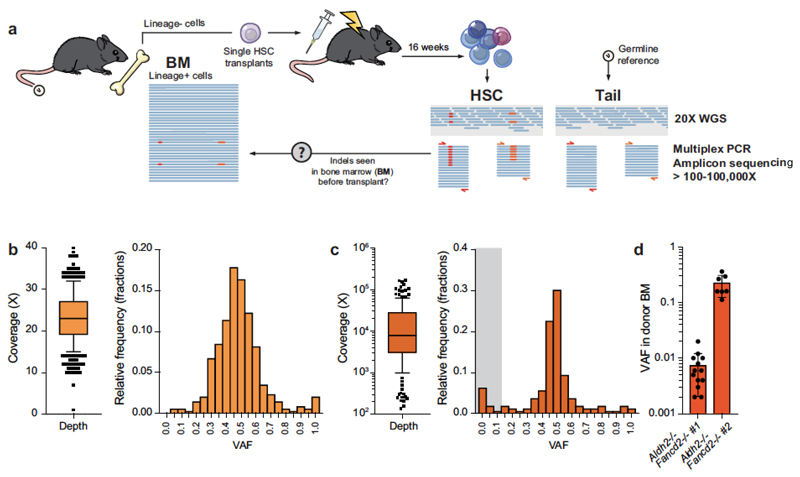
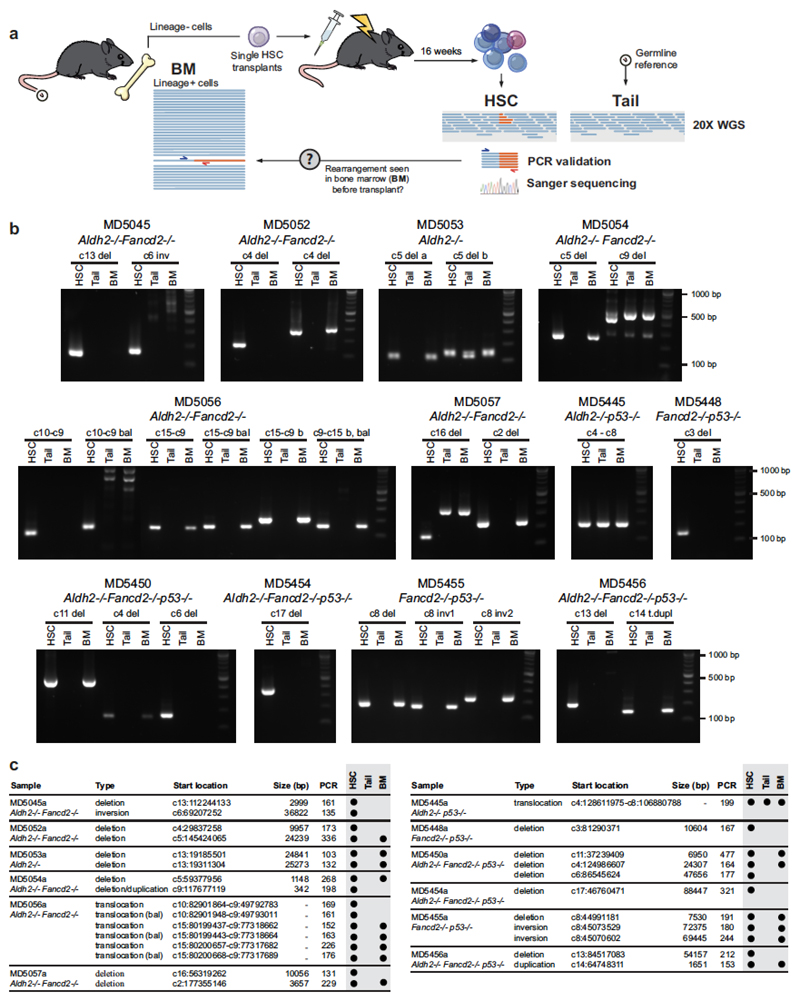
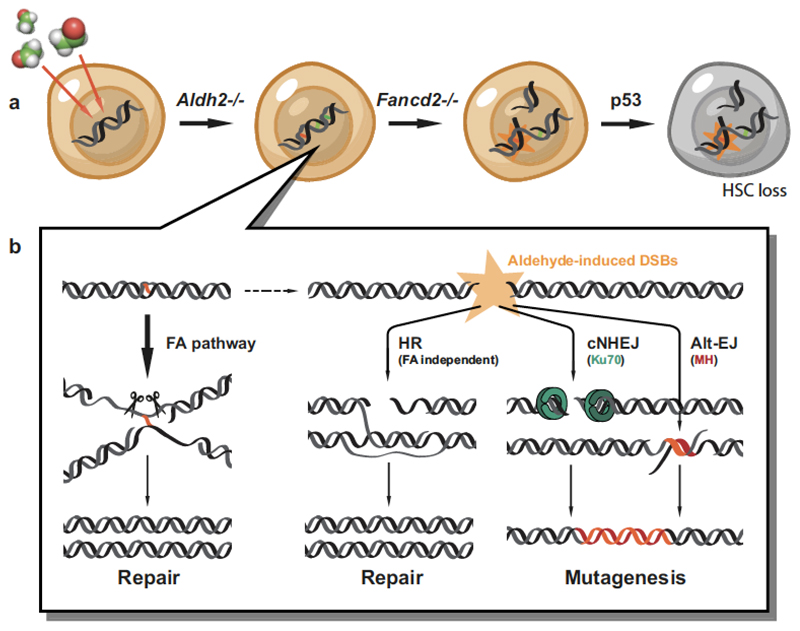
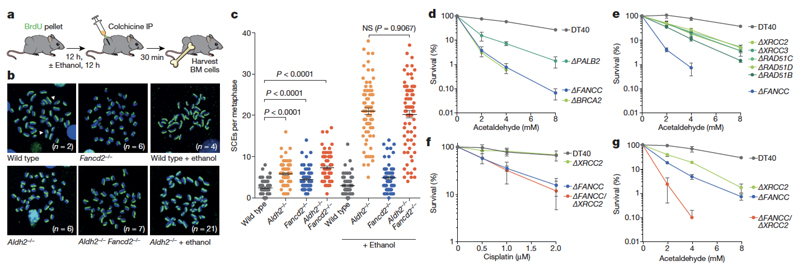
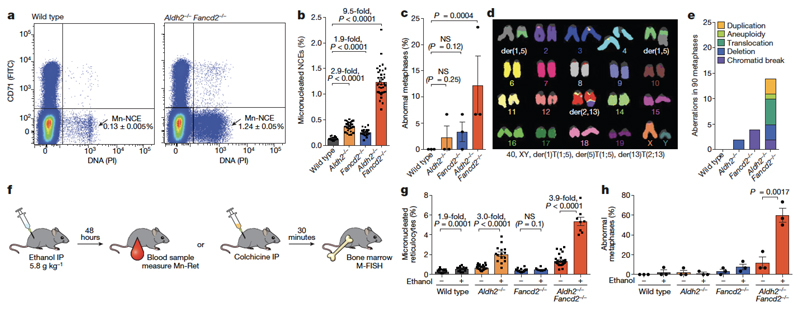
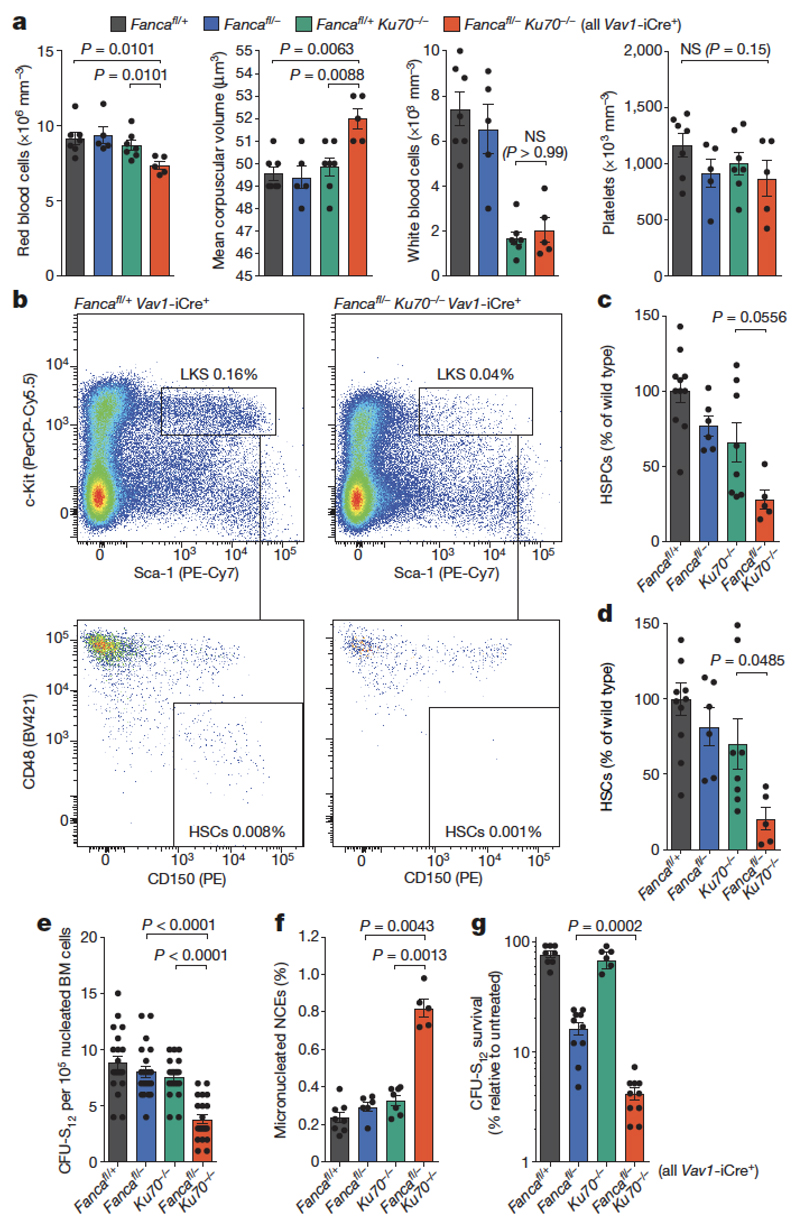
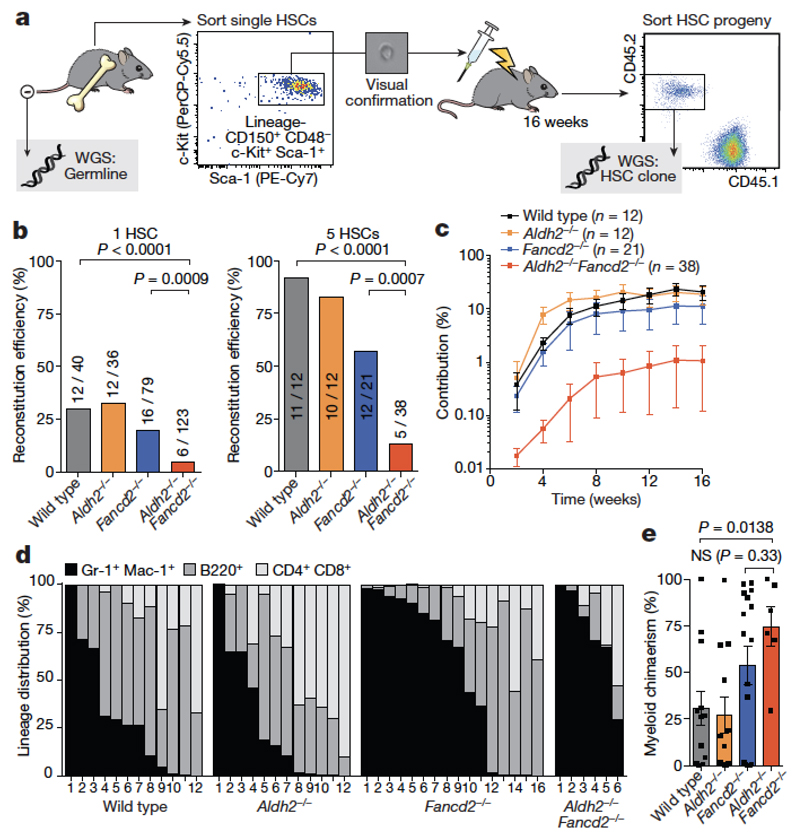
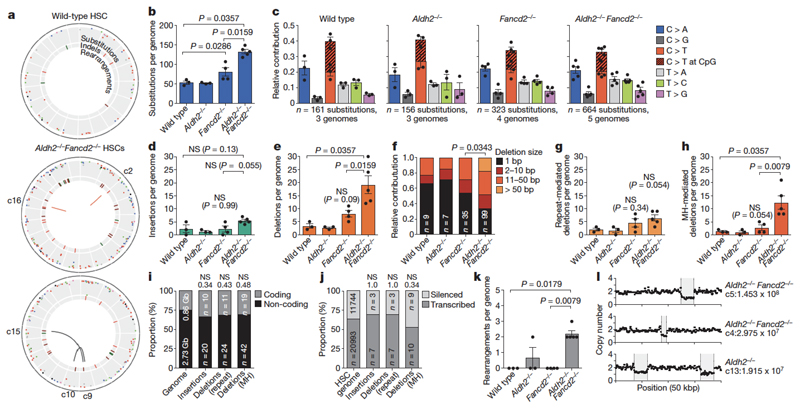
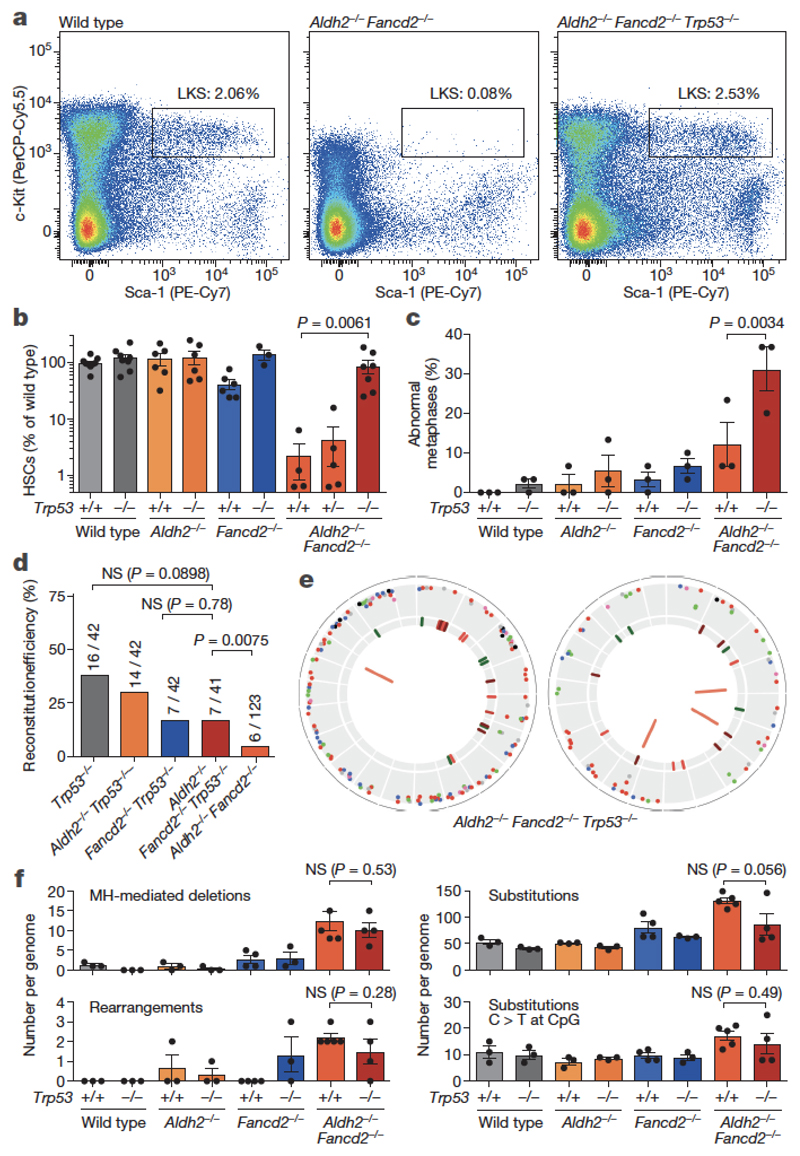
Haematopoietic stem cells renew blood. Accumulation of DNA damage in these cells promotes their decline, while misrepair of this damage initiates malignancies. Here we describe the features and mutational landscape of DNA damage caused by acetaldehyde, an endogenous and alcohol-derived metabolite. This damage results in DNA double-stranded breaks that, despite stimulating recombination repair, also cause chromosome rearrangements. We combined transplantation of single haematopoietic stem cells with whole-genome sequencing to show that this damage occurs in stem cells, leading to deletions and rearrangements that are indicative of microhomology-mediated end-joining repair. Moreover, deletion of p53 completely rescues the survival of aldehyde-stressed and mutated haematopoietic stem cells, but does not change the pattern or the intensity of genome instability within individual stem cells. These findings characterize the mutation of the stem-cell genome by an alcohol-derived and endogenous source of DNA damage. Furthermore, we identify how the choice of DNA-repair pathway and a stringent p53 response limit the transmission of aldehyde-induced mutations in stem cells.


Conflict of interest statement

The authors declare no competing financial interests.

Figures

Extended Data Figure 1
Extended Data Figure 1. Ethanol-induced genomic instability.
a, Left, representative images of bone marrow metaphase spreads from wild-type mice treated with mitomycin C (MMC); n shows the number of SCE events per metaphase. Right, comparison between number of SCEs in the bone marrow of wild-type and Aldh2−/− mice treated with ethanol (5.8 g kg−1) or MMC (1 mg kg−1). Triplicate experiments, 25 metaphases per mouse, n = 75; P calculated by two-sided Mann–Whitney test; data shown as mean and s.e.m. Ethanol causes a strong homologous recombination response in Aldh2−/− mice, comparable to that observed in wild-type mice exposed to MMC. b, Left, representative images of bone marrow metaphase spreads from wild-type and Fanca−/− mice; n shows the number of SCE events per metaphase. Right, quantification of SCEs (duplicate experiments, 25 metaphases per mouse, n = 50; P calculated by two-sided Mann–Whitney test; data shown as mean and s.e.m.). Mice deficient in cross-link repair (Fanca−/−, or Fancd2−/− in Fig. 1a) show a small but significant increase in the number of spontaneous SCE events, indicating that a homologous recombination repair response occurs in the absence of the Fanconi anaemia pathway. c, Scheme depicting the formation of micronucleated erythrocytes. Micronuclei (Mn) generated by fragmentation or mis-segregation of chromosomes during erythrocyte maturation remain in the erythrocyte after extrusion of the main nucleus. These fragments can be detected by a DNA stain (PI+). During maturation, red-cell progenitors lose CD71 expression. Therefore, peripheral CD71+ red cells represent immature, short-lived reticulocytes (Ret) and CD71 cells represent mature, long-lived normochromic erythrocytes (NCEs). d, Proof-of-principle experiment showing the induction of micronucleated reticulocytes 48 h after MMC treatment (1 mg kg−1). P calculated by two-sided Mann–Whitney test; data shown as mean and s.e.m.; n = 29, 8, 20 and 9 mice, left to right. e, Treatment of Aldh2−/− mice with ethanol (5.8 g kg−1) leads to potent micronucleus formation. This induction is comparable to that observed in wild-type mice that were treated with the aneugen vincristine (Vcn, 0.2 mg kg−1, 48 h) or clastogenic γ-irradiation (IR, 400 rad, 48 h). P calculated by two-sided Mann–Whitney test; data shown as mean and s.e.m.; n = 29, 15, 10, 11, 25 and 15 mice. f, List of chromosomal aberrations observed in the bone marrow of 8-to-12-week-old untreated Aldh2−/−Fancd2−/− and control mice. g, List of chromosomal aberrations observed in the bone marrow of 8-to-12-week-old Aldh2−/−Fancd2−/− and control mice 48 h after ethanol treatment (5.8 g kg−1, injected intraperitoneally, IP). In f and g, three mice and 30 metaphases per mouse were analysed per condition, and the numbers represent the fraction of abnormal metaphases per mouse. h, Bar chart classifying the type of aberrations for each genotype (90 metaphases per condition). i, Examples of different types of chromosomal aberrations.
Extended Data Figure 2
Extended Data Figure 2. A single dose of ethanol precipitates bone-marrow failure in Aldh2−/−Fancd2−/− mice.
a, A single dose of ethanol (5.8 g kg−1, injected intraperitoneally) leads to anaemia in Aldh2−/−Fancd2−/− mice one to two months after treatment (P calculated by Mantel-Cox test; n = number of mice). b, Haematoxylin and eosin staining of bone marrow sections 30 days after ethanol treatment (original magnification, ×100). c, Full blood-count analysis for Aldh2−/−Fancd2−/− and control mice, before injection and terminal bleeds after ethanol treatment (P calculated by paired t-test; data shown as mean and s.e.m.; n = number of mice, as in a).
Extended Data Figure 3
Extended Data Figure 3. Generation of a conditional Fanca allele.
a, Mice carrying the previously reported Fanca allele (Fancatm1a(EUCOMM)Wtsi) were crossed with mice carrying the FLP recombinase, yielding the Fancafl allele (Fancatm1c(EUCOMM)Wtsi). This allele restores FANCA expression as shown by western blot (Fig. 3). Cre-mediated recombination of Fancafl yields the FancaΔ allele (Fancatm1d(EUCOMM)Wtsi), which lacks exon 3 and leads to loss of FANCA protein (Fig. 3). b, Genotyping PCRs for the wild-type, Fanca and Fancafl alleles with primers FL033, FL040 and En2A; showing bands of the expected sizes. c, Western blot (single experiment) showing complete absence of FANCA protein in the spleens of Fanca−/− and Fancafl/− Vav1-iCre mice. For gel source data, see Supplementary Fig. 1. d, Determination of the number of exon 3 copies by quantitative (q)PCR. Wild-type, Fanca+/Δ and FancaΔ/Δ mice carry 2, 1 and 0 copies, respectively. Fancafl Vav1-iCre mice show tissue-specific deletion of exon 3 in white blood cells (WBCs) and bone marrow (n = 4 technical replicates; bars: mean, s.d.). e, Microscopic analysis of haematoxylin and eosin-stained sections of testes (original magnification, ×50) from wild-type, Fanca−/−, Fancafl/fl and FancaΔ/Δ males at 12 weeks, showing impaired spermatogenesis in testes of Fanca−/− and FancaΔ/Δ mice (one experiment). f, Sensitivity assay of transformed mouse-embryonic fibroblasts (MEFs) derived from Fanca−/−, Fancafl/fl and FancaΔ/Δ embryos, showing hypersensitivity of both Fanca−/− and FancaΔ/Δ cells to the cross-linking agent mitomycin C (n = number of experiments, each carried out in quadruplicate; bars: mean, s.e.m.).
Extended Data Figure 4
Extended Data Figure 4. Endogenous aldehydes mutate the HSC genome.
Circos plots showing the mutations observed in all sequenced HSC clones (wild type, n = 3; Aldh2−/−, n = 3; Fancd2−/−, n = 4; and Aldh2−/−Fancd2−/−, n = 5 HSC genomes). Substitutions, indels and rearrangements are plotted.
Extended Data Figure 5
Extended Data Figure 5. Detection of point mutations in mice with the BigBlue reporter system.
a, Chromosome 4 of the BigBlue reporter mouse harbours a λ-phage transgene that contains the mutational target. The phage DNA can be recovered from mouse tissues, packaged into phage and used to infect bacteria. Phage cII mutants can be detected by the ability of these phage to form plaques at 24 °C. b, Quantification of the frequency of cII -mutant phage recovered from the bone marrow of young Aldh2−/−Fancd2−/− and control mice carrying the BigBlue transgene. ENU-treated mice serve as positive controls for the assay (P calculated by two-sided Mann–Whitney test; data shown as mean and s.e.m.; n = 7, 7, 6, 7 and 6 mice, left to right). c, Relative contribution of the indicated mutation classes to the point-mutation spectra of cII-mutant phage isolated from the bone marrow. The ENU-mutation spectrum is characterized by T to A transversions and T to C transitions. n is the number of sequenced cII mutant phage.
Extended Data Figure 6
Extended Data Figure 6. Aldehyde-induced stress elicits a p53 response.
a, Representative flow cytometry plots for the quantification of p53+ LKS cells from 8-to-12-week-old Aldh2−/−Fancd2−/− and control mice. Cells were collected from wild-type and Trp53−/− mice 2 h after 10 Gy irradiation as positive and negative controls, respectively, for the assay. b, Quantification of the frequency of p53+ cells in different bone-marrow populations. c, Quantification of the frequency of cleaved-caspase-3+ cells in different bone marrow populations by flow cytometry. In b and c, irradiated wild-type and Trp53−/− mice were used as controls. Owing to the low numbers of LKS CD48 CD150+ cells in Aldh2−/−Fancd2−/− mice, the number of p53+ or cleaved-caspase-3+ HSCs could not be determined (data shown as mean and s.e.m.; n = number of mice). d, e, Survival of B cells and myeloid progenitors (CFU-GM) following exposure to acetaldehyde in vitro. Cells were obtained from Fancd2−/−Trp53−/− and control mice. Each point represents the mean of three independent experiments, each carried out in quadruplicate; data shown as mean and s.e.m. f, Frequency of CFU-S12 in the bone marrow of Aldh2−/−Fancd2−/−Trp53−/− and control mice. Each point represents the number of CFU-S12 in the spleen of a single recipient (P calculated by two-sided Mann–Whitney test; data shown as mean and s.e.m.; n = 10–15 mice).
Extended Data Figure 7
Extended Data Figure 7. p53 deficiency suppresses peripheral-blood cytopenias and ethanol-induced bone-marrow failure in Aldh2−/−Fancd2−/− mice.
a, Full blood count analysis of Aldh2−/−Fancd2−/−Trp53−/− and control mice (8-to-12 weeks old, on a C57BL/6 × 129S4S6/Sv F1 background). A significant increase in the number of white blood cells, red blood cells, platelets and haematocrit was observed in Aldh2−/−Fancd2−/−Trp53−/− mice compared to Aldh2−/−Fancd2−/− mice (P calculated by two-sided Mann–Whitney test; data shown as mean and s.e.m.; n = 17, 16, 21, 14, 18, 12, 18 and 12 mice, left to right). b, Aldh2−/−Fancd2−/−, Aldh2−/−Fancd2−/−Trp53−/− and control mice were treated with ethanol in their drinking water for 10 days as described previously. Full blood-count analyses were carried out after 10 days of ethanol treatment. c, Bone marrow cellularity after 10 days of ethanol treatment. In b, c, P calculated by two-sided Mann–Whitney test; data shown as mean and s.e.m.; n = 5, 6, 8, 6, 6, 4, 6 and 5 mice, left to right). d, Haematoxylin and eosin staining of bone-marrow sections 10 days after ethanol treatment (original magnification, ×100).
Extended Data Figure 8
Extended Data Figure 8. Genomic instability in Aldh2−/−Fancd2−/−Trp53−/− mice.
a, Quantification of micronucleated NCEs in the blood of Aldh2−/−Fancd2−/−Trp53−/− and control mice (P calculated by two-sided Mann–Whitney test; data shown as mean and s.e.m.; n = 8 mice). b, List of chromosomal aberrations observed in the bone marrow of 8-to-12 week-old untreated Aldh2−/−Fancd2−/−Trp53−/− and control mice. Three mice and 30 metaphases per mouse were analysed per genotype; the numbers represent the fraction of abnormal metaphases per mouse. c, Bar chart classifying the types of aberrations for each genotype (90 metaphases per condition). d, Examples of two metaphases from an Aldh2−/−Fancd2−/−Trp53−/− mouse.
Extended Data Figure 9
Extended Data Figure 9. Validation of indels by targeted deep sequencing.
a, Scheme depicting the generation of HSC clones by transplantation of single stem cells, subsequent whole-genome sequencing and validation of indel calls by amplicon deep sequencing. On the basis of the indel location from 20× whole-genome sequencing, we designed multiplex PCRs and deep sequenced the PCR products to higher coverage (100–100,000×) to confirm that the calls were not sequencing artefacts. In addition, we attempted to detect indels in DNA samples of bone-marrow cells from the mice that provided the transplanted HSCs. b, Coverage depth and VAF of the filtered set of indel calls from whole-genome sequencing (n = 342 indels; box plot shows the mean, box edges represent the first and third quartiles, whiskers extend over 10–90% of data). c, Coverage depth and VAF of the indel calls from deep sequencing validation (n = 159 locations; box plot shows the mean, box edges represent the first and third quartiles, whiskers extend over 10–90% of data). One hundred and fifty-nine locations had coverage greater than 100× and were used for the analysis. We could validate the presence of 91.2% of the initial calls; 14/159 (8.8%) calls had VAF <0.1 and were deemed false positives (indicated by grey shading). Note that the VAF distribution is centred tightly around 0.5, confirming the clonal nature of most indels. d, We used targeted deep sequencing to look for indel calls in bone-marrow samples from the mice that provided the transplanted HSCs. In most cases, the calls were below the detection limit of the assay (VAF <0.0001). However, we could detect indels from two Aldh2−/−Fancd2−/− HSCs, indicative of ‘clonal haematopoiesis’ in these mice (accounting for 0.7 and 21.4% of blood production, respectively). Data shown as mean and s.e.m.; n = 13 and 7 indels.
Extended Data Figure 10
Extended Data Figure 10. Validation of rearrangements by PCR.
a, Scheme depicting the generation of HSC clones by transplantation of single stem cells, subsequent whole-genome sequencing and validation of rearrangement calls by PCR. We designed primers for nested PCRs flanking the breakpoints calculated by the BRASS algorithm, and the identity of the products was confirmed by Sanger sequencing. In addition, we attempted to detect the rearrangements in DNA samples of bone-marrow cells from the mice that provided the transplanted HSCs, demonstrating that these changes did not arise during clonal expansion and were present in the stem cell at the time of transplantation. b, Agarose gels (one experiment) showing presence of specific PCR amplification from DNA of HSC clones, absence in matched germline samples from the tail of the same mouse and, in some cases, detection in bone-marrow tissue that predates the transplants. PCR amplification in these samples is dependent on the contribution of the transplanted HSC to blood production, and the sensitivity of each PCR. Gel source data is shown in Supplementary Fig. 1. c, List summarizing the rearrangements found in 28 HSC clones and the results from b. All 27 rearrangements could be detected by PCR and confirmed by Sanger sequencing. 16/27 (59%) rearrangements could be detected before transplantation.
Extended Data Figure 11
Extended Data Figure 11. Mechanisms to maintain genetic integrity and suppress mutagenesis by endogenous aldehydes in HSCs.
a, Aldehyde catabolism and FA-pathway-mediated DNA repair constitute two distinct tiers of protection against aldehyde damage. Loss of this protection leads to the accumulation of DNA damage and mutagenesis. Passage of mutated genetic information is prevented by the activation of p53, leading to HSC loss. b, In the absence of a functional Fanconi anaemia pathway, aldehyde lesions degenerate into DNA double-strand breaks that can be repaired through error-free recombination. However, this mechanism is not sufficient to fully compensate for Fanconi anaemia inactivation, leading to the engagement of both classical and alternative end-joining, and subsequent mutagenic repair.
Figure 1
Figure 1. Ethanol induces potent homologous recombination in vivo.
a, Treatment of mice with BrdU for differential labelling of sister chromatids of bone marrow cells in vivo. Some mice were also treated with ethanol, a precursor of acetaldehyde. IP, intraperitoneal injection; BM, bone marrow. b, Representative images of bone-marrow metaphase spreads (n, number of SCEs per metaphase). c, Number of SCEs in the bone marrow of Aldh2−/−Fancd2−/− and control mice (triplicate experiments, 25 metaphases per mouse, n = 75; P calculated by two-sided Mann–Whitney test; data shown as mean and s.e.m.). NS, not significant. dg, Clonogenic survival of DT40 DNA-repair mutants (triplicate experiments; data shown as mean and s.e.m.).
Figure 2
Figure 2. Spontaneous and ethanol-induced genomic instability in Aldh2−/−Fancd2−/− mice.
a, Quantification of micronucleated normochromic erythrocytes (Mn-NCE, CD71 PI+) by flow cytometry. b, Percentage of micronucleated normochromic erythrocytes (P calculated by two-sided Mann–Whitney test; data shown as mean and s.e.m.; n = 28, 28, 25 and 37 mice, left to right). c, Percentage of abnormal metaphases in bone marrow cells (P calculated by one-sided Fisher’s exact test; data shown as mean and s.e.m.; three mice per genotype, 30 metaphases per mouse). d, A Aldh2−/−Fancd2−/− metaphase, showing two translocations, see Extended Data Fig. 1f-i for the complete list of aberrations. e, Types of chromosomal aberrations (90 metaphases per genotype). fh, Treatment of mice with ethanol to assess genomic instability (f) with the micronucleus assay (g) or M-FISH karyotyping (h). Percentage of micronucleated reticulocytes (Mn-Ret, CD71+ PI+) after ethanol treatment (g, P calculated by two-sided Mann–Whitney test; data shown as mean and s.e.m.; n = 29, 15, 25, 15, 20, 10, 28 and 9 mice, left to right). Abnormal metaphases in bone marrow cells after ethanol treatment (h, P calculated by one-sided Fisher’s exact test; data shown as mean and s.e.m.; 3 mice per genotype, 30 metaphases per mouse).
Figure 3
Figure 3. NHEJ cooperates with the Fanconi anaemia pathway to maintain HSC integrity, genomic stability and cellular resistance to aldehydes.
a, Blood parameters of 8- to 12-week old mice (P calculated by two-sided Mann–Whitney test; data shown as mean and s.e.m.; n = 8, 6, 7 and 5 mice, left to right). RBC, red blood cells; MCV, mean corpuscular volume; WBC, white blood cells. b, Representative flow cytometry plot of HSPCs of Fancafl/-Ku70−/− Vav1-iCre mice and control. LKS, LinKit+Sca-1+. c, d, Quantification of HSPCs (LinKit+Sca-1+) and HSCs (LinKit+Sca-1+CD48CD150+) by flow cytometry (P calculated by two-tailed Student’s t-test; data shown as mean and s.e.m.; n as in a). e, Counts from colony-forming unit-spleen (CFU-S) assays in the bone marrow of Fancafl/-Ku70−/− Vav1-iCre and control mice. Each point represents the number of CFU-S12 in a single recipient (P calculated by two-sided Mann–Whitney test; data shown as mean and s.e.m.; n = 20 mice). f, Frequency of Mn-NCE (P calculated by two-sided Mann–Whitney test; data shown as mean and s.e.m.; n as in a). g, Survival of CFU-S12 after treatment with 4 mM acetaldehyde for 4 h, relative to untreated samples (P calculated by two-sided Mann–Whitney test; data shown as mean and s.e.m.; n = 10 mice).
Figure 4
Figure 4. Single HSC transplantation reveals that Aldh2−/−Fancd2−/− HSCs are functionally compromised.
a, Transplantation of a single HSC for the generation of HSC clones in vivo. The HSC progeny (CD45.2+) were recovered after four months and analysed by whole-genome sequencing, alongside a germline reference. b, Percentage and number of irradiated recipients that were positive for reconstitution by one or five transplanted HSCs (P calculated by two-sided Fisher’s exact test). c, Contribution to blood production over time by five transplanted HSCs (data shown as mean and s.e.m.). d, Lineage composition of single-HSC clones four months after transplant; columns represent individual recipients or clones. e, Proportion of myeloid (Gr-1+Mac-1+) HSC-derived white blood cells (P calculated by two-sided Mann–Whitney test; data shown as mean and s.e.m.; n = 12, 12, 16 and 6 HSC clones, left to right).
Figure 5
Figure 5. Endogenous aldehydes mutate the HSC genome.
a, Circos plots showing mutations in three HSCs. All HSCs are shown in Extended Data Fig. 4. b, d, e, g, h, k, Mutations of different classes per genome (b, number of substitutions; P calculated by two-sided Mann–Whitney test; data shown as mean and s.e.m.; n = 3, 3, 4 and 5 HSC genomes, left to right). c, Point mutation classes in HSC genotypes. d, Number of insertions per genome. e, Number of deletions per genome. f, Distribution of the size of deletions (χ2 test, n shows number of deletions). g, Number of repeat-mediated deletions per genome. h, Number of microhomology (MH)-mediated deletions per genome. i, j, Indels in Aldh2−/−Fancd2−/− HSCs are randomly distributed: within or outside genes (i) (P calculated by hypergeometric distribution, n is number of indels), or between expressed or silenced genes (j) (P calculated by binomial distribution, n is number of indels). Numbers above columns, P values. k, Number of rearrangements per genome. l, Large copy-number losses in Aldh2−/−Fancd2−/− and Aldh2−/− HSCs at the indicated locations.
Figure 6
Figure 6. A p53 response depletes aldehyde-damaged HSCs.
a, Representative flow cytometry plot of HSPCs (LKS). b, Quantification of HSCs as determined by flow cytometry (P calculated by two-sided Mann–Whitney test; data shown as mean and s.e.m.; n = 9, 8, 6, 6, 6, 3, 4, 5 and 7 mice, left to right). c, Frequency of abnormal metaphases in bone marrow cells (P calculated by two-sided Fisher’s exact test; data shown as mean and s.e.m.; 3 mice per genotype, 30 metaphases per mouse). See Extended Data Fig. 8b-d for a complete list of rearrangements. d, Proportion and number of irradiated recipients that were positive for reconstitution by transplantation of single HSCs (P calculated by two-sided Fisher’s exact test). e, Mutations in two Aldh2−/−Fancd2−/−Trp53−/− HSCs. f, Number of microhomology-mediated deletions, rearrangements, substitutions and clock substitutions per genome (P calculated by two-sided Mann–Whitney test; data shown as mean and s.e.m.; n = 3, 3, 3, 3, 4, 3, 5 and 4 HSC genomes, left to right).

References

    1. Roswall N, Weiderpass E. Alcohol as a risk factor for cancer: existing evidence in a global perspective. J Prev Med Public Health. 2015;48:1–9. - PMC - PubMed
    1. Wang M, et al. Identification of DNA adducts of acetaldehyde. Chem Res Toxicol. 2000;13:1149–1157. doi: 10.1021/tx000118t. - DOI - PubMed
    1. Lai CL, et al. Dominance of the inactive Asian variant over activity and protein contents of mitochondrial aldehyde dehydrogenase 2 in human liver. Alcohol Clin Exp Res. 2014;38:44–50. doi: 10.1111/acer.12215. - DOI - PubMed
    1. Yokoyama A, Omori T. Genetic polymorphisms of alcohol and aldehyde dehydrogenases and risk for esophageal and head and neck cancers. Jpn J Clin Oncol. 2003;33:111–121. doi: 10.1093/jjco/hyg026. - DOI - PubMed
    1. Garaycoechea JI, et al. Genotoxic consequences of endogenous aldehydes on mouse haematopoietic stem cell function. Nature. 2012;489:571–575. doi: 10.1038/nature11368. - DOI - PubMed

Publication types

MeSH terms