. 2018 Mar 1;197(5):611-620.
doi: 10.1164/rccm.201709-1861OC.

Association between Household Air Pollution Exposure and Chronic Obstructive Pulmonary Disease Outcomes in 13 Low- and Middle-Income Country Settings

Affiliations

Association between Household Air Pollution Exposure and Chronic Obstructive Pulmonary Disease Outcomes in 13 Low- and Middle-Income Country Settings

Trishul Siddharthan et al. Am J Respir Crit Care Med. .

Abstract

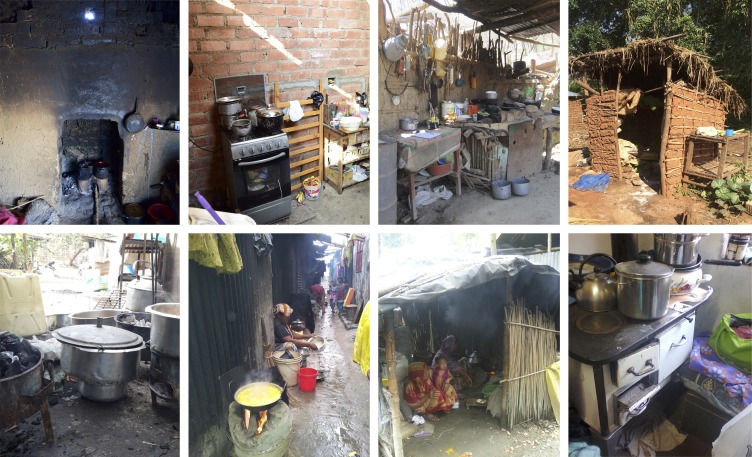
Rationale: Forty percent of households worldwide burn biomass fuels for energy, which may be the most important contributor to household air pollution.

Objectives: To examine the association between household air pollution exposure and chronic obstructive pulmonary disease (COPD) outcomes in 13 resource-poor settings.

Methods: We analyzed data from 12,396 adult participants living in 13 resource-poor, population-based settings. Household air pollution exposure was defined as using biomass materials as the primary fuel source in the home. We used multivariable regressions to assess the relationship between household air pollution exposure and COPD outcomes, evaluated for interactions, and conducted sensitivity analyses to test the robustness of our findings.

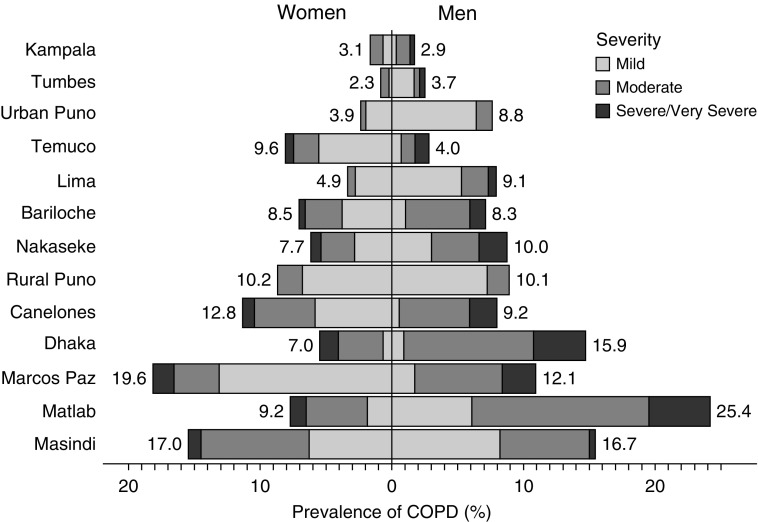
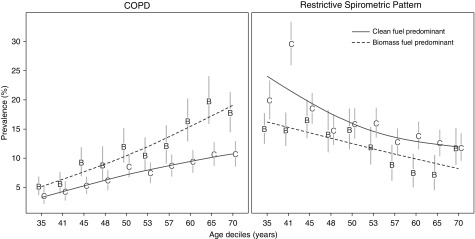
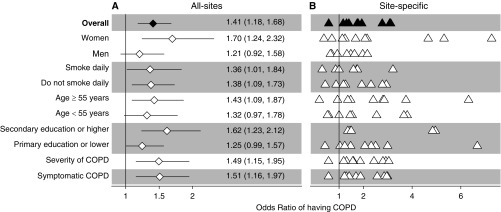
Measurements and main results: Average age was 54.9 years (44.2-59.6 yr across settings), 48.5% were women (38.3-54.5%), prevalence of household air pollution exposure was 38% (0.5-99.6%), and 8.8% (1.7-15.5%) had COPD. Participants with household air pollution exposure were 41% more likely to have COPD (adjusted odds ratio, 1.41; 95% confidence interval, 1.18-1.68) than those without the exposure, and 13.5% (6.4-20.6%) of COPD prevalence may be caused by household air pollution exposure, compared with 12.4% caused by cigarette smoking. The association between household air pollution exposure and COPD was stronger in women (1.70; 1.24-2.32) than in men (1.21; 0.92-1.58).

Conclusions: Household air pollution exposure was associated with a higher prevalence of COPD, particularly among women, and it is likely a leading population-attributable risk factor for COPD in resource-poor settings.

Keywords: COPD; air pollution; biomass; indoor/adverse effects.


Figures

Figure 1.
Figure 1.
Typical kitchens and stoves in selected sites. Top, left to right: Puno, Peru; Lima, Peru; Tumbes, Peru; and Nakaseke, Uganda. Bottom, left to right: Kampala, Uganda; Dhaka, Bangladesh; Matlab, Bangladesh; and Temuco, Chile.
Figure 2.
Figure 2.
Sex-, site-, and severity-stratified prevalences of chronic obstructive pulmonary disease (COPD). The prevalence of COPD was stratified by sex (women on the left, men on the right) and severity as defined by lung function (in shades of gray) across the 13 low- and middle-income country sites. Sites were ordered according to the overall prevalence of COPD from lowest (top) to highest (bottom). Overall sex-stratified site-specific prevalences are given next to each bar.
Figure 3.
Figure 3.
Prevalence and corresponding 95% confidence intervals of chronic obstructive pulmonary disease (COPD) and restricted spirometric pattern by deciles of age stratified by household air pollution (HAP) exposure. We calculated point prevalences of COPD (left) and restricted spirometric pattern (right) at each age decile and by HAP exposure status. Values on the x-axis represent the starting age for each decile. HAP exposure status was stratified according to participants who reported using biomass as the predominant fuel (B) and those who did not use biomass as the predominant fuel (C). We used smoothing splines to describe the relationship between HAP exposure status and COPD or restricted spirometry pattern prevalence across age deciles. The dashed lines summarize trends for participants with HAP exposure (B), and solid lines summarize trends for those without the exposure (C).
Figure 4.
Figure 4.
Associations between household air pollution (HAP) exposure and chronic obstructive pulmonary disease (COPD) outcomes obtained from multivariable regression models, and interaction effects with sex, smoking status, age, and educational attainment. (A) Estimates using data from all sites. (B) Site-specific estimates. In A, odds ratios and the corresponding 95% confidence intervals are represented by diamonds and lines, respectively. We also tabulated numerical values for the odds ratios and the corresponding 95% confidence intervals. In B, site-specific odds ratios are presented by triangles. In the overall model, we evaluated the association between HAP exposure and COPD prevalence adjusted for age, sex, daily cigarette smoking, body mass index, post-treatment pulmonary tuberculosis, and secondary education. We then evaluated for interaction effects between HAP exposure and either sex, smoking status, age, or educational attainment on COPD outcomes. Models stratified by sex were adjusted for age, daily cigarette smoking, body mass index, post-treatment pulmonary tuberculosis, and secondary education. Models stratified by smoking status were adjusted for age, sex, body mass index, post-treatment pulmonary tuberculosis, and secondary education. Models stratified by age were adjusted for sex, daily cigarette smoking, body mass index, post-treatment pulmonary tuberculosis, and secondary education. Models stratified by educational attainment were adjusted for age, sex, daily cigarette smoking, body mass index, and post-treatment pulmonary tuberculosis. Models with severity and symptom status of COPD as outcomes were adjusted for age, sex, daily cigarette smoking, body mass index, post-treatment pulmonary tuberculosis, and secondary education.
Figure 5.
Figure 5.
Mean prebronchodilator FEV1, FVC, and FEV1/FVC z-scores with corresponding 95% confidence intervals, stratified by deciles of age and by household air pollution exposure status. We calculated average z-scores for FEV1 (left), FVC (middle), or FEV1/FVC (right) at each age decile and by household air pollution exposure status. Values on the x-axis represent the starting age for each decile. Household air pollution exposure status was stratified according to participants who reported using biomass as the predominant fuel (B) and those who did not use biomass as the predominant fuel (C). The dashed lines summarize trends for participants with household air pollution exposure (B), and the solid lines summarize trends for those without the exposure (C).

Comment in

References

    1. Bonjour S, Adair-Rohani H, Wolf J, Bruce NG, Mehta S, Prüss-Ustün A, et al. Solid fuel use for household cooking: country and regional estimates for 1980-2010. Environ Health Perspect. 2013;121:784–790. - PMC - PubMed
    1. Torres-Duque C, Maldonado D, Pérez-Padilla R, Ezzati M, Viegi G Forum of International Respiratory Studies (FIRS) Task Force on Health Effects of Biomass Exposure. Biomass fuels and respiratory diseases: a review of the evidence. Proc Am Thorac Soc. 2008;5:577–590. - PubMed
    1. GBD 2015 Risk Factors Collaborators. Global, regional, and national comparative risk assessment of 79 behavioural, environmental and occupational, and metabolic risks or clusters of risks, 1990-2015: a systematic analysis for the Global Burden of Disease Study 2015. Lancet. 2016;388:1659–1724. - PMC - PubMed
    1. Hosgood HD, III, Wei H, Sapkota A, Choudhury I, Bruce N, Smith KR, et al. Household coal use and lung cancer: systematic review and meta-analysis of case-control studies, with an emphasis on geographic variation. Int J Epidemiol. 2011;40:719–728. - PMC - PubMed
    1. Jary H, Simpson H, Havens D, Manda G, Pope D, Bruce N, et al. Household air pollution and acute lower respiratory infections in adults: a systematic review. PLoS One. 2016;11:e0167656. - PMC - PubMed

Publication types