. 2018 Jan 11;13(1):e0190558.
doi: 10.1371/journal.pone.0190558. eCollection 2018.

Fast, quantitative, murine cardiac 19F MRI/MRS of PFCE-labeled progenitor stem cells and macrophages at 9.4T

Affiliations

Fast, quantitative, murine cardiac 19F MRI/MRS of PFCE-labeled progenitor stem cells and macrophages at 9.4T

Christakis Constantinides et al. PLoS One. .

Erratum in

Abstract

Purpose: To a) achieve cardiac 19F-Magnetic Resonance Imaging (MRI) of perfluoro-crown-ether (PFCE) labeled cardiac progenitor stem cells (CPCs) and bone-derived bone marrow macrophages, b) determine label concentration and cellular load limits, and c) achieve spectroscopic and image-based quantification.

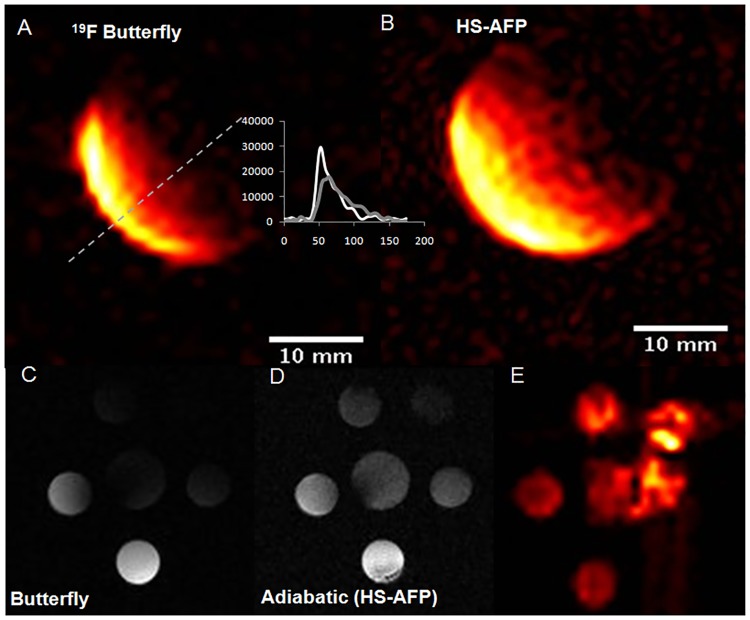
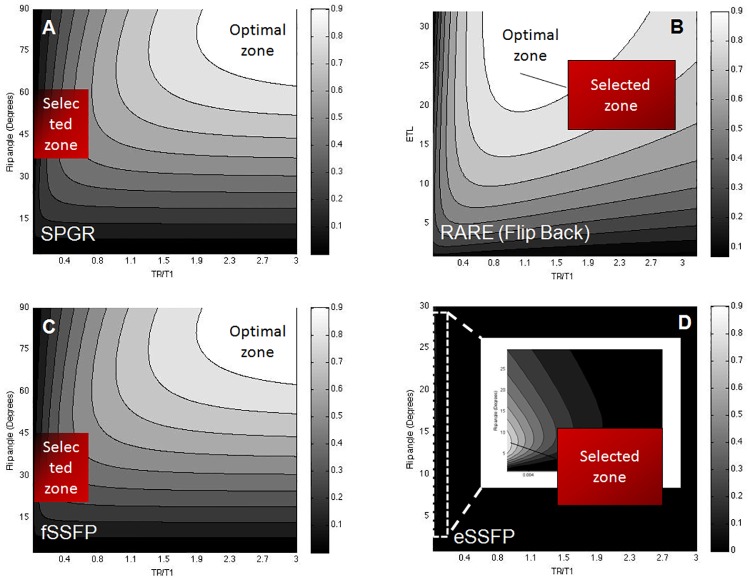
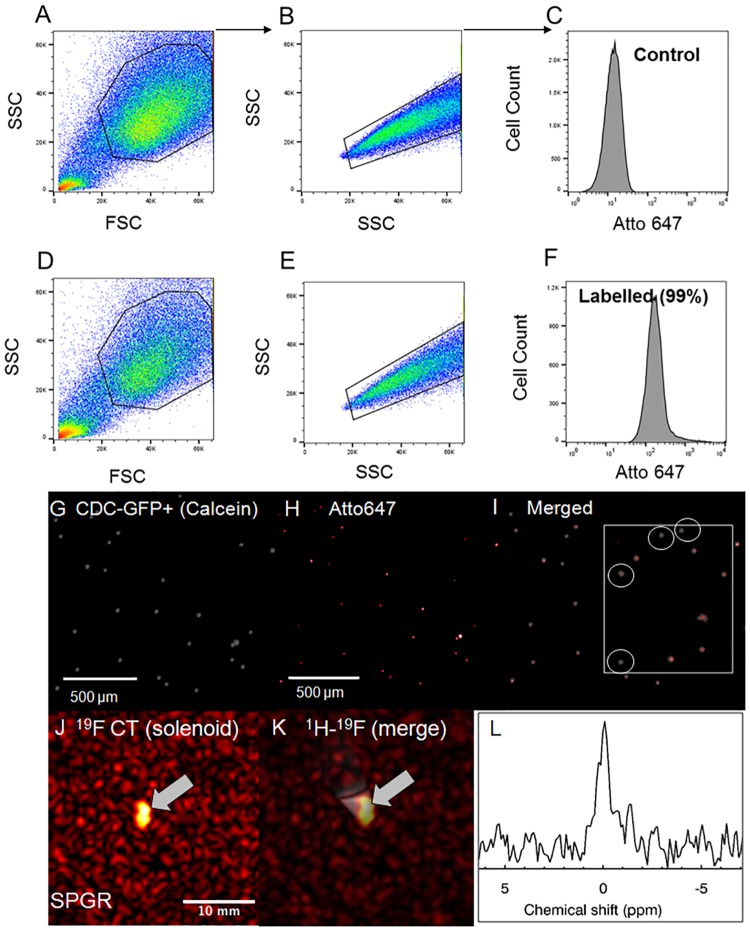
Methods: Theoretical simulations and experimental comparisons of spoiled-gradient echo (SPGR), rapid acquisition with relaxation enhancement (RARE), and steady state at free precession (SSFP) pulse sequences, and phantom validations, were conducted using 19F MRI/Magnetic Resonance Spectroscopy (MRS) at 9.4 T. Successful cell labeling was confirmed using flow cytometry and confocal microscopy. For CPC and macrophage concentration quantification, in vitro and post-mortem cardiac validations were pursued with the use of the transfection agent FuGENE. Feasibility of fast imaging is demonstrated in murine cardiac acquisitions in vivo, and in post-mortem murine skeletal and cardiac applications.

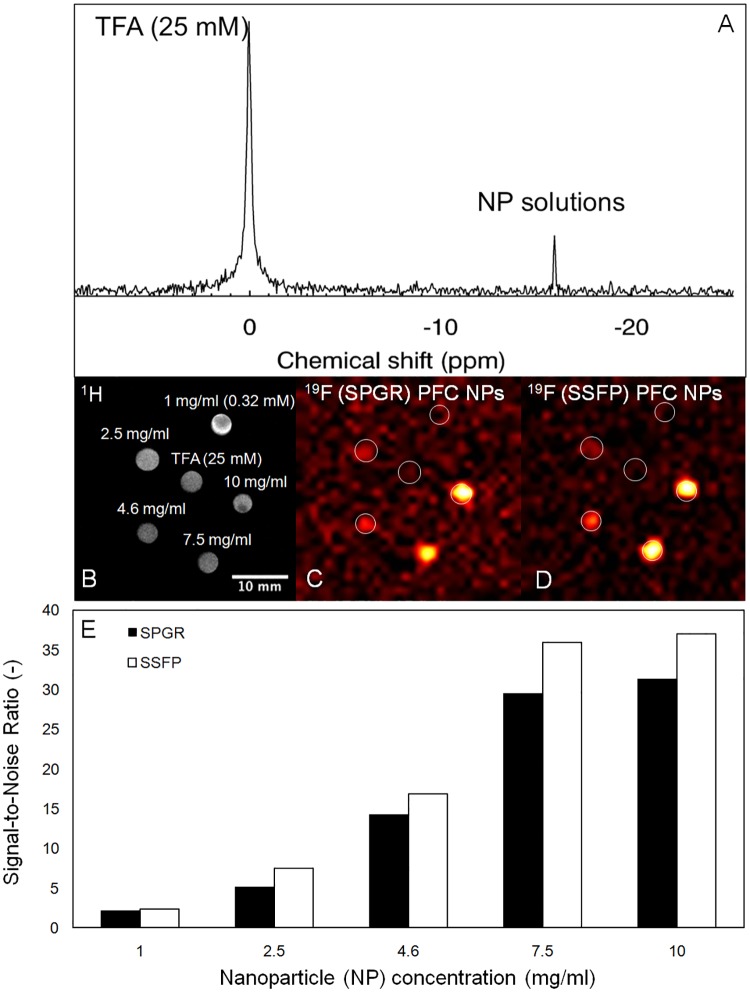
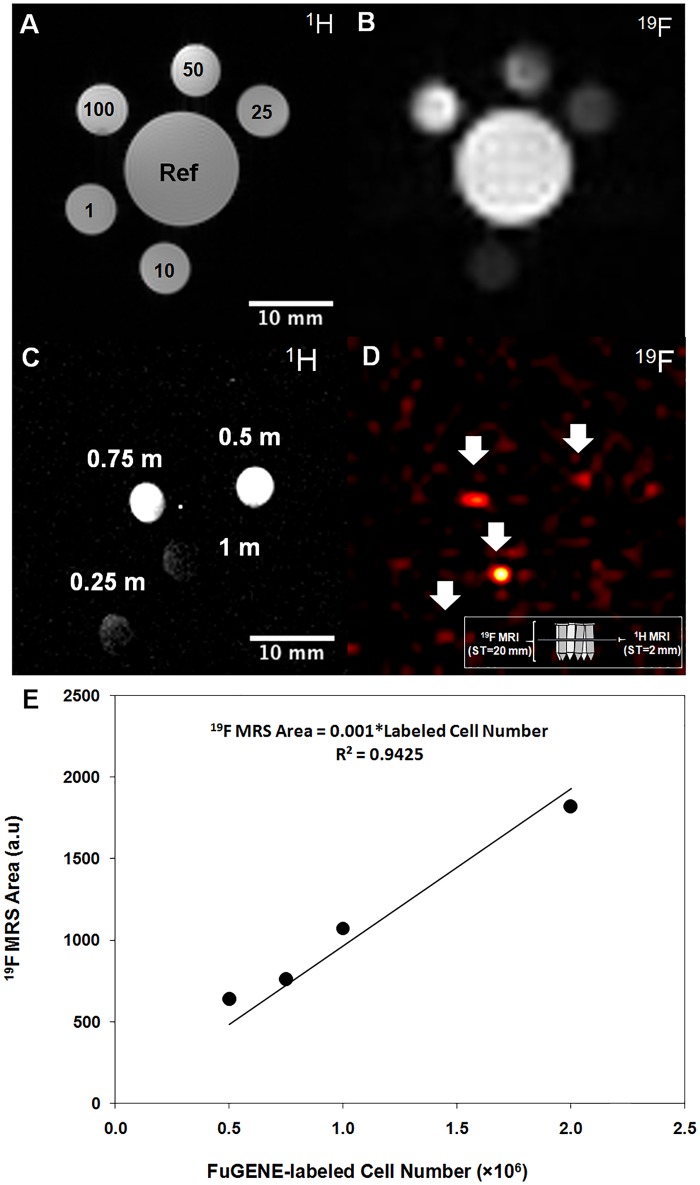
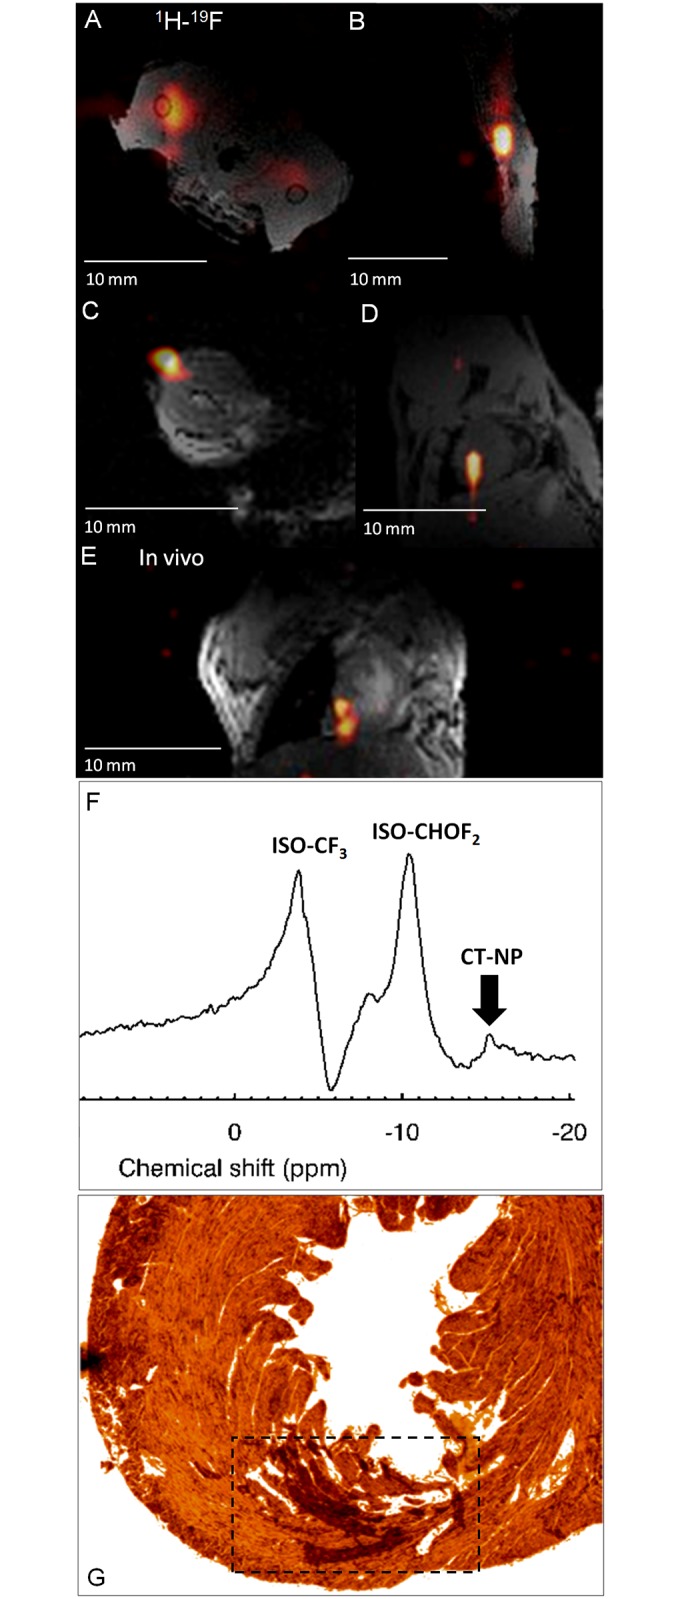
Results: SPGR/SSFP proved favorable imaging sequences yielding good signal-to-noise ratio values. Confocal microscopy confirmed heterogeneity of cellular label uptake in CPCs. 19F MRI indicated lack of additional benefits upon label concentrations above 7.5-10 mg/ml/million cells. The minimum detectable CPC load was ~500k (~10k/voxel) in two-dimensional (2D) acquisitions (3-5 min) using the butterfly coil. Additionally, absolute 19F based concentration and intensity estimates (trifluoroacetic-acid solutions, macrophages, and labeled CPCs in vitro and post-CPC injections in the post-mortem state) scaled linearly with fluorine concentrations. Fast, quantitative cardiac 19F-MRI was demonstrated with SPGR/SSFP and MRS acquisitions spanning 3-5 min, using a butterfly coil.

Conclusion: The developed methodologies achieved in vivo cardiac 19F of exogenously injected labeled CPCs for the first time, accelerating imaging to a total acquisition of a few minutes, providing evidence for their potential for possible translational work.


Conflict of interest statement

Competing Interests: I would also like to respectfully indicate that I am currently affiliated with Chi Biomedical Ltd. (since my departure from U. Oxford and UK on 7/8/17). However, the presented work in this manuscript was completed during the period of July 2015-June 2017 at the U. Oxford during my employment at U. Oxford as a Marie-Sklodowska Curie fellow. Correspondingly, there are no issues relevant to funding or competing interests. Chi Biomedical has been in a financial dormant status for a number of years and despite its viable legal status, it has been financially inactive. Correspondingly, there was no salary contributed by Chi Biomedical directors/staff, and for this submitted work there are no declarations pertaining to employment, consultancy, patents, products in development, or marketed products. The current commercial affiliation of the lead author [CC] commercial affiliation does not alter the adherence of all the authors/coauthors of this work to PLOS ONE policies on sharing data and materials.

Figures

Fig 1
Fig 1. Axial 19F MRI images of phantoms using a surface coil.
(A) butterfly without, and (B) with the use of adiabatic hyperbolic secant adiabatic full passage (HS-AFP) using the spoiled gradient echo sequence (SPGR) and a 100 mM TFA phantom. Profiles depict signal intensities versus pixel values along the oblique orientation defined in A. (C-E) Corresponding axial images of a multivial TFA phantom containing 5 mM TFA solutions. (C) Axial 1H image using the butterfly coil without, and (D) with HS-AFP adiabatic excitation, and (E) axial 19F with adiabatic excitation. The artifact observed in the right part of the phantom is attributed to fact that the adiabatic condition is not fully met owing to the butterfly’s B1 assymetry (driving cables).
Fig 2
Fig 2. Pulse sequence simulations in parametric space.
(A) Theoretical normalized parametric signal-to-noise (SNR) plots for labeled CT cells (T1 = 1.32 s and T2 = 0.05 s) for a: (A) SPGR sequence (flip angle versus TR/T1), (B) a rapid acquisition with relaxation enhancement (RARE) sequence [echo train length (ETL) versus TR/T1 with flip-back], (C, D) balanced steady state free precession [free induction decay (fSSFP) and echo-SSFP (eSSFP)] (flip angle versus TR/T1 without sign alteration). Optimal and selected acquisition zones are indicated. Optimized labeled cell imaging was based on the generation of the respective plots that used the estimated relaxation values as listed in Table 1. All simulations assumed a total imaging acquisition of 4.5 min, NEX = 256, an acquisition matrix of 32×32, and an acquisition bandwidth of 4 kHz.
Fig 3
Fig 3. Experimental pulse sequence comparison in phantoms.
Pulse sequence SNR comparison using the birdcage coil based on two-dimensional (2D) acquisitions using a 100 mM TFA phantom in the same total imaging acquisition time. SNR values lied within the set scale bar shown on the right.
Fig 4
Fig 4. 19F MRI validation in NP solution phantoms.
(A) Non-selective 19F magnitude spectrum of NP solutions in the presence of a 25 mM TFA phantom (as shown in B). (B) 1H and 19F MRI of NP phantoms using (C) the SPGR, and (D) the echo-SSFP sequences. The TFA phantom does not appear in 19F MRI (C, D) since broadband excitation/narrowband receiver detection was used centered at the NP resonance. (E) Variation of the mean 19F SNR from phantom solutions in (C, D) above for the SPGR and SSFP sequences for different NP concentrations.
Fig 5
Fig 5. CPC label confirmation using flow cytometry and in vitro 19F MRI/MRS validation.
(A, B, D, E) Ungated scatter plots of forward (FSC) and side scatter (SSC, singlets vs. doublets) and (C, F) gated, overlapped flow cytometry histograms of control (C) and labeled CT cells (F) confirming cellular uptake. Applied gates are indicated in the scatter plots as highlighted regions-of-interest. (G, H) Confocal microscopy images of PFCE labelled (G) CDC GFP+ (calcein [gray]), (H) Atto647 (red), and (I) merged calcein/Atto647 with a zoomed inlet indicating the heterogenous distribution of cellular label uptake. (J, K) Corresponding 19F and 1H-19F merged MRI of labeled CT cells (~4.5 million) obtained using the solenoid coil showing excellent 19F signal localization. (L) 19F magnitude spectrum in labeled CTs using the solenoid coil (line broadening = 30 Hz, zero reference frequency set to the NP-labeled CT cell resonance).
Fig 6
Fig 6. 19F MRI-based quantification in solutions and CPCs and determination of cellular detectability limit.
19F MR spectroscopy, image-based quantification, and sensitivity detection limits: (A, B) Axial 1H and 19F images from TFA phantoms of different concentrations (25–100 mM), and images of a multivial sensitivity phantom containing 0.25, 0.5, 0.75, and 1 million labeled/transfected CT cells suspended in media for sensitivity limit detection (cell pellets resided at the bottom of the Eppendorf tubes) using the butterfly coil. (C) 1H imaging indicates spatial B1 fall off-effects (laterally and with depth, non-adiabatic excitation). 19F imaging indicates a minimum detectable cellular load of approximately 500k cells in a total acquisition of 4.4 min (white arrows). The 19F MRI in (D) shows cells over a slice thickness of 20 mm. As shown by the inserted schematic, the 1H MRI in (C) shows cross-sections (from the middle of the Eppendorf tubes), while the 19F MRI in (D) shows the hyperintense cell pellets that were sometimes slightly displaced spatially given the tilting of some of the tubes and the dispersion of the cells on the walls of the tubes in instances where the acquisitions were prolonged. (E) Quantification of labelled CPCs using 19F MRS (solenoid). The linearity of the evoked fully relaxed spectral area versus cell number was independently confirmed using fast, direct, image-based SPGR using CPCs (butterfly coil) (results not shown).
Fig 7
Fig 7. Post-mortem and in vivo murine cardiac 19F MRI following intramyocardial CPC injections.
Post-mortem (A-D) and in vivo (E-F), merged 1H-19F images of approximately 1.5–2.5 million labeled CT cells administered in the (A, B) femoral skeletal (axial, sagittal views; both legs were injected), (C, D) post-mortem cardiac (pseudo-short and short-axis views, without (C) and with the anterior thorax (D)) from PHD3f/f, PHD2flox/flox, (E) ungated in vivo cardiac (coronal) views from a C57BL/6 mouse using the butterfly coil. (F) Corresponding ungated, unlocalized 19F MRS from the upper thorax showing the two isoflurane (ISO) and the labelled CT cell peaks. All 1H images were acquired when the coil was tuned/matched at the 19F resonance. (G) Indicative optical bright field histological image from the mouse heart in (D) above. The dotted square box indicates the area where cells were localized within the left ventricular myocardium.

References

    1. Feyen DA, Gaetani R, Doevendans PA, Sluijter JP. Stem cell-based therapy: Improving myocardial cell delivery. Advanced Drug Delivery Reviews 2016; 106(PtA):104–115. doi: 10.1016/j.addr.2016.04.023 - DOI - PubMed
    1. Michalet X, Pinaud FF, Bentolila LA, Tsay JM, Doose S, Li JJ, et al. Quantum dots for live cells, in vivo imaging, and diagnostics. Science 2005; 307(5709):538–544. doi: 10.1126/science.1104274 - DOI - PMC - PubMed
    1. Chen IY, Wu JC. Cardiovascular molecular imaging: focus on clinical translation. Circulation. 2011;123(4):425–43. doi: 10.1161/CIRCULATIONAHA.109.916338 - DOI - PMC - PubMed
    1. Stuckey DJ, Carr CA, Martin-Rendon E, Tyler DJ, Willmott C, Cassidy PJ, et al. Iron particles for noninvasive monitoring of bone marrow stromal cell engraftment into, and isolation of viable engrafted donor cells from, the heart. Stem Cells 2006; 24(8):1968–75. doi: 10.1634/stemcells.2006-0074 - DOI - PubMed
    1. Ahrens ET, Flores R, Xu H, Morel PA. In vivo imaging platform for tracking immunotherapeutic cells. Nature Biotechnology 2005; 23(8):983–987. doi: 10.1038/nbt1121 - DOI - PubMed

Publication types