. 2018 Apr 1;98(4):449-464.
doi: 10.1093/biolre/ioy004.

Mediator complex component MED13 regulates zygotic genome activation and is required for postimplantation development in the mouse

Affiliations

Mediator complex component MED13 regulates zygotic genome activation and is required for postimplantation development in the mouse

Yi-Liang Miao et al. Biol Reprod. .

Abstract

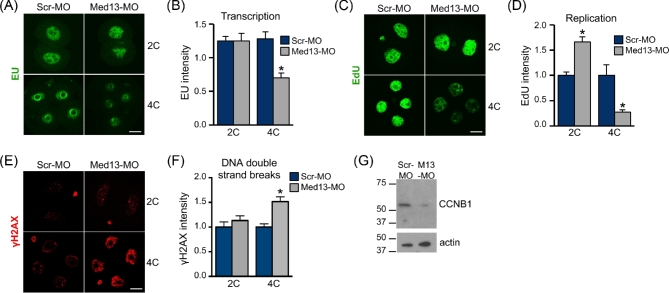
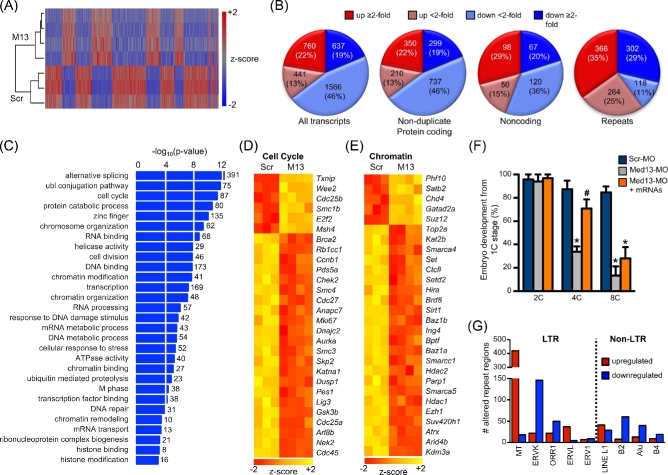
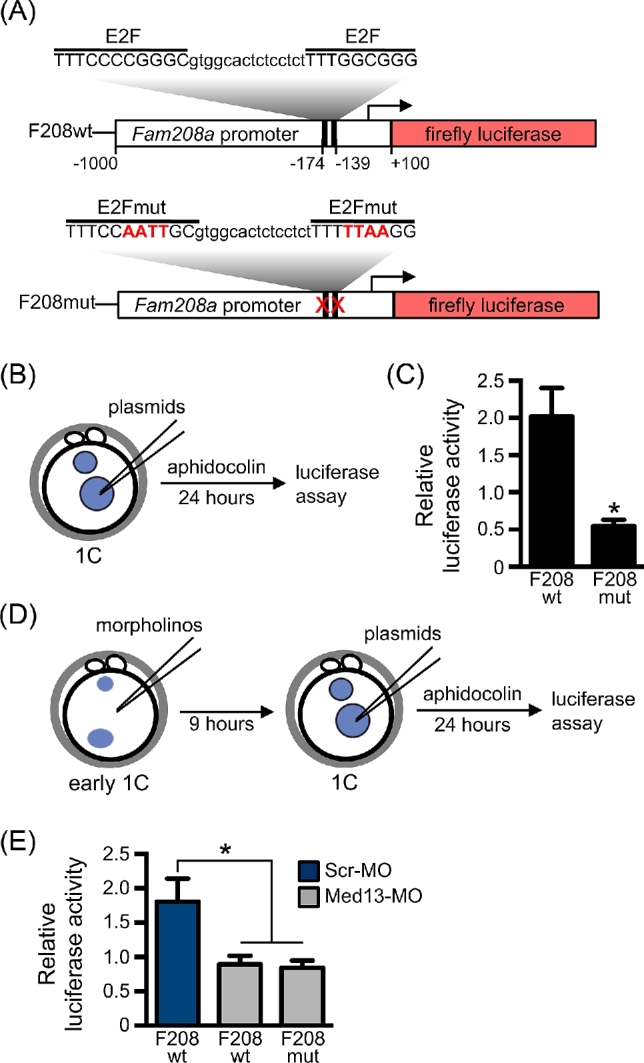
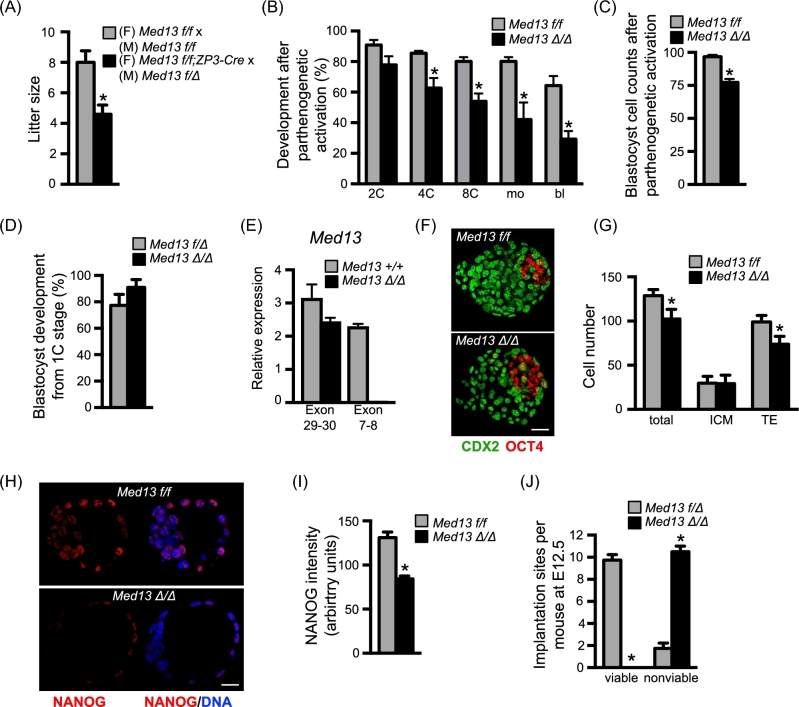
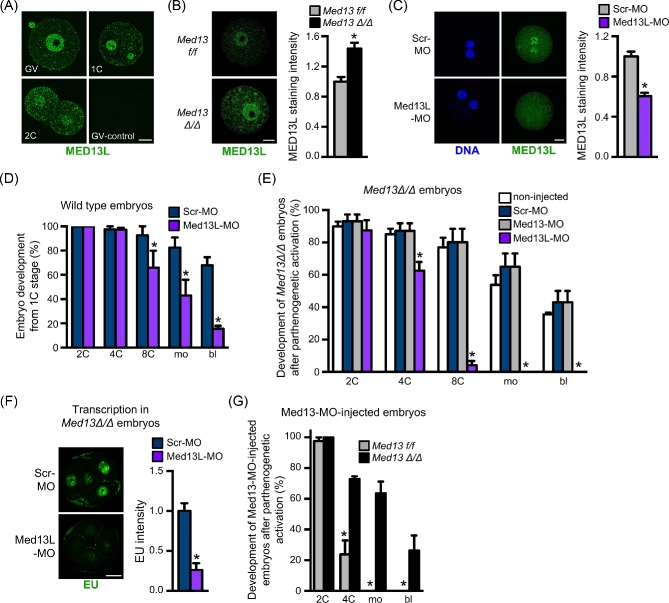
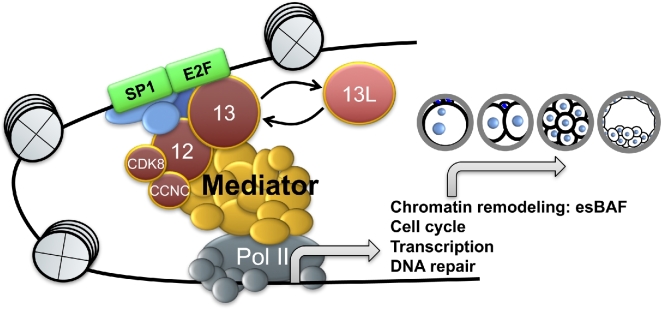
Understanding factors that regulate zygotic genome activation (ZGA) is critical for determining how cells are reprogrammed to become totipotent or pluripotent. There is limited information regarding how this process occurs physiologically in early mammalian embryos. Here, we identify a mediator complex subunit, MED13, as translated during mouse oocyte maturation and transcribed early from the zygotic genome. Knockdown and conditional knockout approaches demonstrate that MED13 is essential for ZGA in the mouse, in part by regulating expression of the embryo-specific chromatin remodeling complex, esBAF. The role of MED13 in ZGA is mediated in part by interactions with E2F transcription factors. In addition to MED13, its paralog, MED13L, is required for successful preimplantation embryo development. MED13L partially compensates for loss of MED13 function in preimplantation knockout embryos, but postimplantation development is not rescued by MED13L. Our data demonstrate an essential role for MED13 in supporting chromatin reprogramming and directed transcription of essential genes during ZGA.


Figures

Figure 1.
Figure 1.
MED13 knockdown inhibits preimplantation embryo development. (A) Expression of Med13 mRNA in oocytes and preimplantation embryos relative to that in GV oocytes. N = 3. (B) Expression of Med13 mRNA in late 2C embryos cultured without (C, control) or with α-amanitin (α-am) starting at the 1C stage to block zygotic transcription. N = 3; *P ≤ 0.05, T-test. (C) MED13 protein in oocytes, eggs, and 1C, 2C, and 4C-stage embryos. Bar = 20 μm. N = 3, total of 11–25/group. (D) MED13 protein in 4C-stage embryos following microinjection at the 1C stage using the indicated morpholino. Bar = 20 μm. Graph indicates relative signal intensity in nuclei. N = 3, total of 47–53/group; *P < 0.05, T-test. (E) Representative DIC images of embryos 3 days following microinjection at the 1C stage using the indicated morpholino. (F) Percentage of embryos to reach the various preimplantation embryo stages following microinjection at the 1C stage with the indicated morpholino. Bar = 80 μm. N = 4, 16–37 1C embryos/group for each replicate; *P ≤ 0.05 compared to Scr-MO control at the same time point, ANOVA with Holm-Sidak multiple comparisons test. All graphs show mean ± s.e.m. Abbreviations used in this and all subsequent figures: ooc, GV-intact oocyte; egg, MII-arrested egg; 1C, one-cell embryo; 2C, two-cell embryo; 4C, four-cell embryo; 8C, eight-cell embryo; mo, morula; bl, blastocyst.
Figure 2.
Figure 2.
MED13 knockdown inhibits embryo transcription and cell cycle progression. One-cell stage embryos were microinjected with the indicated morpholino, then cultured to the 2C or 4C stage. (A) EU staining as an indicator of transcription levels. (B) Quantification of EU staining. N = 3, total of 23–24 embryos/group; *P ≤ 0.05, T-test. (C) EdU staining as an indicator of DNA replication. (D) Quantification of EdU staining. N = 3, total of 20–24 embryos/group; *P ≤ 0.05, T-test. (E) Gamma H2AX staining as an indicator of DNA double strand breaks. (F) Quantification of γH2AX staining. N = 4, total of 14–36 embryos/group; *P ≤ 0.05, T-test. (G) Immunoblot analysis of cyclin B1 in late 2C-stage embryos (upper panel). Actin was used as a loading control (lower panel). Numbers indicate apparent Mr × 10−3. Lysate of 20 embryos in each lane. Blot is representative of N = 3 independent replicates. All graphs show mean ± s.e.m. All bars = 20 μm.
Figure 3.
Figure 3.
MED13 knockdown impairs transcription of genes required for the OET, including cell cycle and chromatin-remodeling proteins. One-cell stage embryos were microinjected with the indicated morpholino, then cultured to the late 2C stage. RNA sequencing was performed on independent pools of 40 embryos per group. (A) Unsupervised hierarchical clustering of gene expression differences in Scr-MO (Scr)- and Med13-MO (M13)-injected embryos. (B) Numbers of altered transcripts of the indicated types in Med13-MO-injected embryos relative to Scr-MO-injected embryos. (C) Highly significant GO biological categories of genes downregulated in Med13-knockdown embryos. Numbers to right of bars indicate number of genes in category. (D) Selected GO cell cycle genes significantly altered in Med13-knockdown embryos. (E) Selected GO chromatin modification genes significantly altered in Med13-knockdown embryos. (F) Percentage of embryos to reach the indicated preimplantation embryo stages following microinjection at the 1C stage with the either Scr-MO, Med13-MO, or Med13-MO and both Smarca4 and Smarcc1 mRNAs. N = 3, 8–12 1C embryos/group for each replicate; *P ≤ 0.05 compared to Scr-MO control at the same time point, #P ≤ 0.05 compared to MED13-MO at the same time point, ANOVA with Holm-Sidak multiple comparisons test. Graph shows mean ± s.e.m. (G) Graph showing total number of chromosomal regions either up- or downregulated for each of the indicated repetitive element classes.
Figure 4.
Figure 4.
E2F transcription factor binding motif mediates MED13-dependent gene transcription. (A) Schematic diagram of luciferase plasmids showing wild-type and mutated E2F-binding motifs in the Fam208a promoter. Numbers indicate position relative to TSS (arrow). (B) Schematic of experimental design for plasmid injections. (C) Relative luciferase activity following plasmid injection alone using F208wt or F208mut plasmids. N = 4, total of 23–26 embryos/group; *P ≤ 0.05, T-test. (D) Schematic of experimental design for morpholino and plasmid injections. (E) Relative luciferase activity in embryos first injected with the indicated morpholino and then 9 h later with the indicated plasmid. N = 6, total of 21–22 embryos/group; *P ≤ 0.05 compared to F208wt plasmid/Scr-MO group, ANOVA with Holm-Sidak multiple comparisons test. All graphs show mean ± s.e.m.
Figure 5.
Figure 5.
Postimplantation developmental arrest of Med13 knockout embryos. (A) Average litter size from breeding pairs of indicated genotypes. N = 10 litters/group, *P < 0.05, T-test. (B) Metaphase II eggs of the indicated genotype were parthenogenetically activated and allowed to develop in vitro. Graph represents average percentage of embryos to develop to the indicated stages. N = 3, total of 51–55 1C embryos/group; P < 0.05 compared to same stage, ANOVA with Holm-Sidak multiple comparisons test. (C) Total cell numbers in parthenogenetically activated embryos of each genotype that reached the blastocyst stage. N = 27 embryos/group, *P < 0.0001, T-test. (D) In vivo fertilized, 1C-stage embryos of the indicated genotypes were collected and allowed to develop in vitro. Graph represents percentage of embryos to develop to the blastocyst stage. N = 3 breeding pairs per group, 8–13 1C embryos collected per female. (E) Relative expression of Med13 mRNA encoding exons 29–30 and 7–8. Graph shows median ± range. N = 2 replicates. (F) Representative immunofluorescent staining of blastocyst stage embryos of the indicated genotypes that developed from the 1C stage in vitro. (G) Graph of cell numbers in the blastocysts from (E). Inner cell mass (ICM), trophectoderm (TE). N = 3, total of 13–16 embryos/group; *P < 0.05, T-test. (H) Representative immunofluorescent staining of blastocyst stage embryos of the indicated genotypes that developed from the 1C stage in vitro. Red channel on left, merged image on right. (I) Graph of NANOG staining intensity in the blastocysts from (G). N = 3, total of 23–31 embryos/group; *P < 0.0001, T-test with Welch correction. (J) Females carrying oocytes with normal amounts of MED13 (Med13f/f) or lacking MED13 (Med13f/f;ZP3-Cre) were mated to males carrying sperm lacking MED13 (Med13f/Δ;Hspa2-Cre) to generate either Med13f/Δ or Med13Δ/Δ embryos. Graph shows numbers of viable and nonviable implantation sites on E12.5. N = 4 females/group; *P < 0.0001, Fisher exact test. All graphs except panel E show mean ± s.e.m. All bars = 20 μm.
Figure 6.
Figure 6.
MED13L compensates for lack of MED13 during preimplantation embryo development. (A) Immunofluorescent staining of MED13L protein in wild-type GV oocytes, 1C- and 2C-stage embryos. GV-control staining done with no primary antibody. (B) Immunofluorescent staining and quantification (arbitrary units) of MED13L in GV oocytes of the indicated genotype. N = 3, total of 30/group; *P < 0.05, T-test. (C) Immunofluorescent staining and quantification (arbitrary units) of MED13L in parthenogenetically activated 1C embryos following microinjection of the indicated morpholino at the GV stage. N = 3, total of 18/group; *P < 0.05, T-test. (D) Percentage of wild-type embryos to reach the various preimplantation embryo stages following microinjection at the 1C stage with the indicated morpholino. N = 3, total of 61–70 1C embryos/group; *P < 0.05 compared to Scr-MO control at same time point, ANOVA with Holm-Sidak multiple comparisons test. (E) Percentage of embryos derived from parthenogenetically activated eggs to reach the various preimplantation embryo stages following microinjection at the 1C stage with the indicated morpholino. N = 4, 15–24 1C embryos/group for each replicate; *P < 0.05 compared to Scr-MO control at same time point, ANOVA with Holm-Sidak multiple comparisons test. (F) Representative images of Med13Δ/Δ embryos microinjected with the indicated morpholino and stained with EU at the 4C stage as an indicator of transcription levels. Graph shows quantification of staining intensity. N = 3–6 embryos/group; *P < 0.05, T-test. (G) Percentage of embryos derived from parthenogenetically activated eggs of the indicated genotypes to reach the various preimplantation embryo stages following microinjection at the 1C stage with Med13-MO. Graph represents average percentage of embryos to develop to the indicated stages. N = 3, total of 56–59 1C embryos/group; *P < 0.05 compared to same stage, ANOVA with Holm-Sidak multiple comparisons test. All graphs show mean ± s.e.m. All bars = 20 μm.
Figure 7.
Figure 7.
Schematic illustrating function of MED13 and MED13L during the OET. MED13 serves as a crucial link between transcription factors (e.g., E2F family and SP1), coactivators, and the main mediator complex. The mediator complex recruits RNA polymerase II and its accessory factors, resulting in transcription of specific gene classes required for preimplantation embryo development. In the absence of MED13, its paralog MED13L partially compensates for this function.

References

    1. Chen J, Melton C, Suh N, Oh JS, Horner K, Xie F, Sette C, Blelloch R, Conti M. Genome-wide analysis of translation reveals a critical role for deleted in azoospermia-like (Dazl) at the oocyte-to-zygote transition. Genes Dev 2011; 25(7):755–766. - PMC - PubMed
    1. Potireddy S, Vassena R, Patel BG, Latham KE. Analysis of polysomal mRNA populations of mouse oocytes and zygotes: dynamic changes in maternal mRNA utilization and function. Dev Biol 2006; 298(1):155–166. - PubMed
    1. Ma J, Flemr M, Strnad H, Svoboda P, Schultz RM. Maternally recruited DCP1A and DCP2 contribute to messenger RNA degradation during oocyte maturation and genome activation in mouse. Biol Reprod 2013; 88(1):11. - PMC - PubMed
    1. Shao GB, Chen JC, Zhang LP, Huang P, Lu HY, Jin J, Gong AH, Sang JR. Dynamic patterns of histone H3 lysine 4 methyltransferases and demethylases during mouse preimplantation development. In Vitro Cell Dev Biol Anim 2014; 50(7):603–613. - PubMed
    1. Lemaitre JM, Bocquet S, Terret ME, Namdar M, Ait-Ahmed O, Kearsey S, Verlhac MH, Mechali M. The regulation of competence to replicate in meiosis by Cdc6 is conserved during evolution. Mol Reprod Dev 2004; 69(1):94–100. - PubMed

Publication types