

Tumor purity quantification by clonal DNA methylation signatures
- PMID: 29325057
- PMCID: PMC5946863
- DOI: 10.1093/bioinformatics/bty011
Tumor purity quantification by clonal DNA methylation signatures
Abstract
Motivation: Controlling for tumor purity in molecular analyses is essential to allow for reliable genomic aberration calls, for inter-sample comparison and to monitor heterogeneity of cancer cell populations. In genome wide screening studies, the assessment of tumor purity is typically performed by means of computational methods that exploit somatic copy number aberrations.
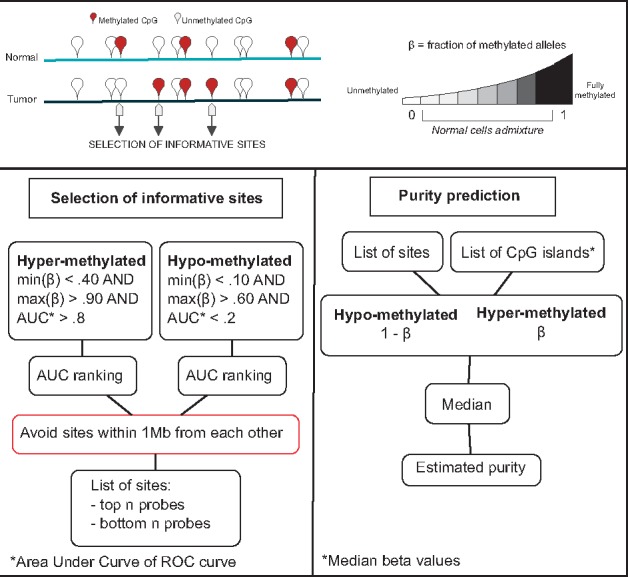
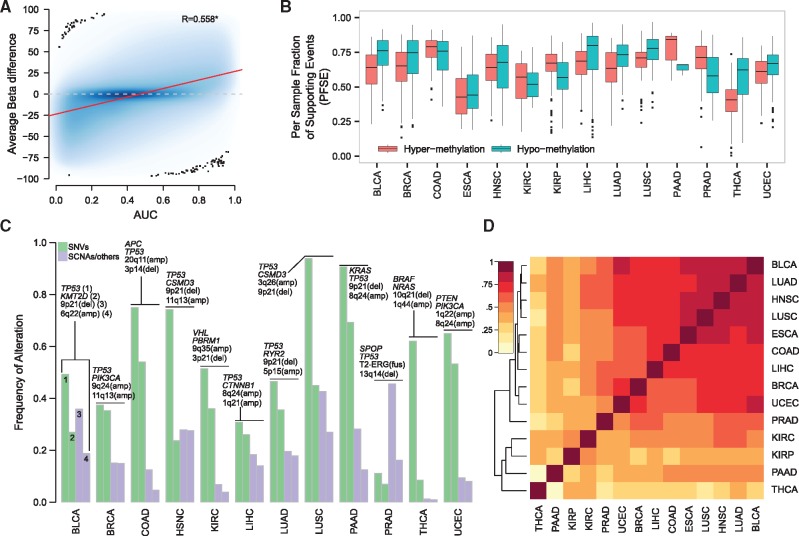
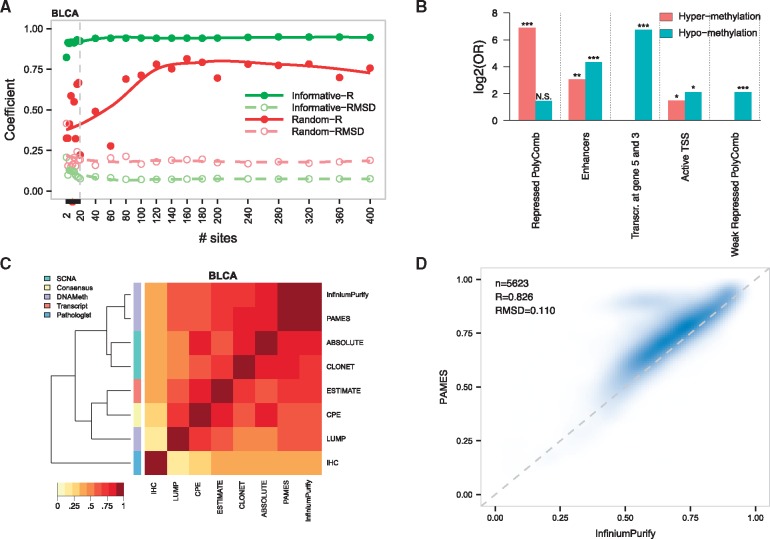
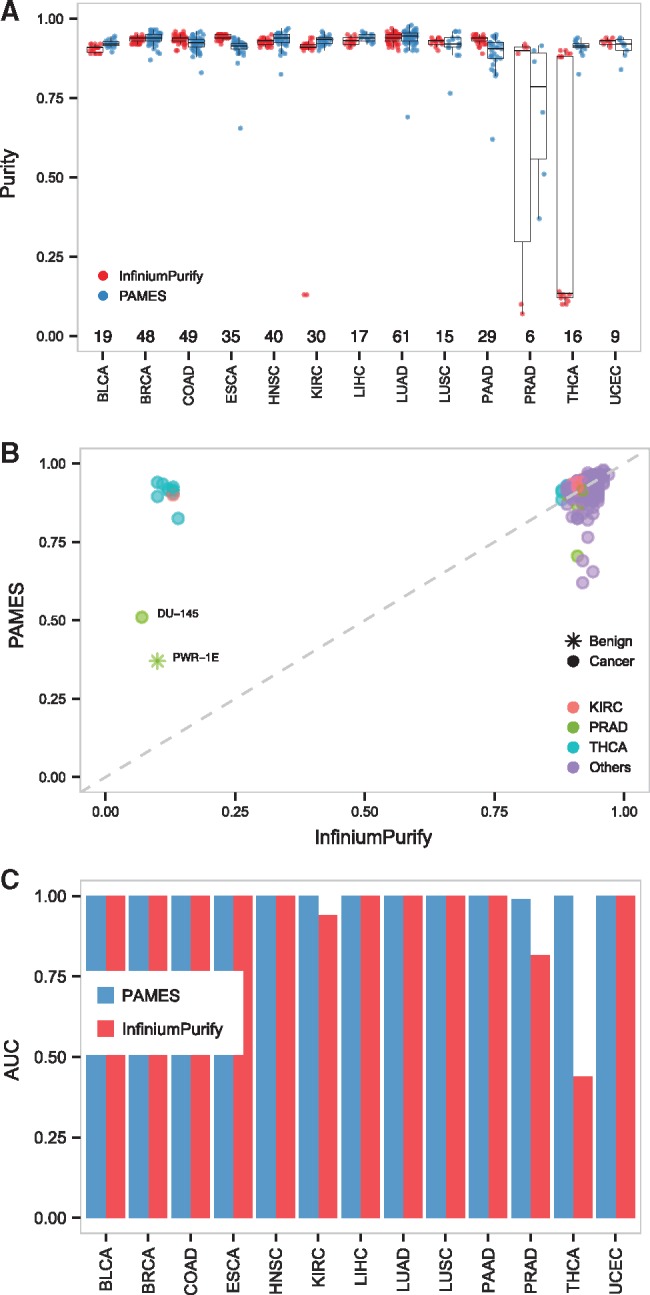
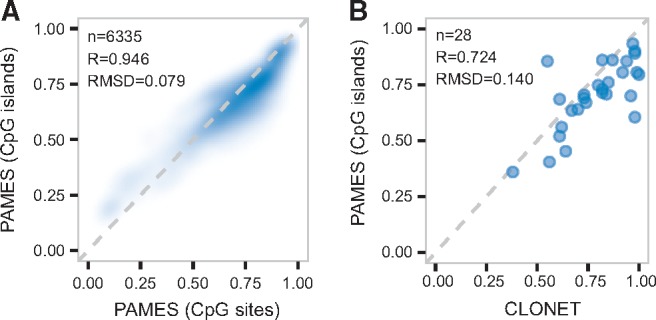
Results: We present a strategy, called Purity Assessment from clonal MEthylation Sites (PAMES), which uses the methylation level of a few dozen, highly clonal, tumor type specific CpG sites to estimate the purity of tumor samples, without the need of a matched benign control. We trained and validated our method in more than 6000 samples from different datasets. Purity estimates by PAMES were highly concordant with other state-of-the-art tools and its evaluation in a cancer cell line dataset highlights its reliability to accurately estimate tumor admixtures. We extended the capability of PAMES to the analysis of CpG islands instead of the more platform-specific CpG sites and demonstrated its accuracy in a set of advanced tumors profiled by high throughput DNA methylation sequencing. These analyses show that PAMES is a valuable tool to assess the purity of tumor samples in the settings of clinical research and diagnostics.
Availability and implementation: https://github.com/cgplab/PAMES.
Contact: matteo.benelli@uslcentro.toscana.it or f.demichelis@unitn.it.
Supplementary information: Supplementary data are available at Bioinformatics online.
Figures
Similar articles
-
A comprehensive evaluation of alignment software for reduced representation bisulfite sequencing data.Bioinformatics. 2018 Aug 15;34(16):2715-2723. doi: 10.1093/bioinformatics/bty174. Bioinformatics. 2018. PMID: 29579198
-
methylFlow: cell-specific methylation pattern reconstruction from high-throughput bisulfite-converted DNA sequencing.Bioinformatics. 2016 Jun 1;32(11):1618-24. doi: 10.1093/bioinformatics/btw287. Bioinformatics. 2016. PMID: 27246923 Free PMC article.
-
Estimating and accounting for tumor purity in the analysis of DNA methylation data from cancer studies.Genome Biol. 2017 Jan 25;18(1):17. doi: 10.1186/s13059-016-1143-5. Genome Biol. 2017. PMID: 28122605 Free PMC article.
-
Tumor purity and differential methylation in cancer epigenomics.Brief Funct Genomics. 2016 Nov;15(6):408-419. doi: 10.1093/bfgp/elw016. Epub 2016 May 19. Brief Funct Genomics. 2016. PMID: 27199459 Review.
-
Tools and Strategies for Analysis of Genome-Wide and Gene-Specific DNA Methylation Patterns.Methods Mol Biol. 2017;1537:249-277. doi: 10.1007/978-1-4939-6685-1_15. Methods Mol Biol. 2017. PMID: 27924599 Review.
Cited by
-
Circulating tumor DNA profile recognizes transformation to castration-resistant neuroendocrine prostate cancer.J Clin Invest. 2020 Apr 1;130(4):1653-1668. doi: 10.1172/JCI131041. J Clin Invest. 2020. PMID: 32091413 Free PMC article. Clinical Trial.
-
Spatial concordance of DNA methylation classification in diffuse glioma.Neuro Oncol. 2021 Dec 1;23(12):2054-2065. doi: 10.1093/neuonc/noab134. Neuro Oncol. 2021. PMID: 34049406 Free PMC article.
-
PEIS: a novel approach of tumor purity estimation by identifying information sites through integrating signal based on DNA methylation data.BMC Bioinformatics. 2019 Dec 30;20(Suppl 22):714. doi: 10.1186/s12859-019-3227-1. BMC Bioinformatics. 2019. PMID: 31888435 Free PMC article.
-
A new method for constructing tumor specific gene co-expression networks based on samples with tumor purity heterogeneity.Bioinformatics. 2018 Jul 1;34(13):i528-i536. doi: 10.1093/bioinformatics/bty280. Bioinformatics. 2018. PMID: 29949994 Free PMC article.
-
Genome-wide plasma DNA methylation features of metastatic prostate cancer.J Clin Invest. 2020 Apr 1;130(4):1991-2000. doi: 10.1172/JCI130887. J Clin Invest. 2020. PMID: 32149736 Free PMC article.
References
Publication types
MeSH terms
Grants and funding
LinkOut - more resources
Full Text Sources
Other Literature Sources
