. 2018 Apr 6;46(6):e34.
doi: 10.1093/nar/gkx1314.

Network perturbation analysis of gene transcriptional profiles reveals protein targets and mechanism of action of drugs and influenza A viral infection

Affiliations

Network perturbation analysis of gene transcriptional profiles reveals protein targets and mechanism of action of drugs and influenza A viral infection

Heeju Noh et al. Nucleic Acids Res. .

Abstract

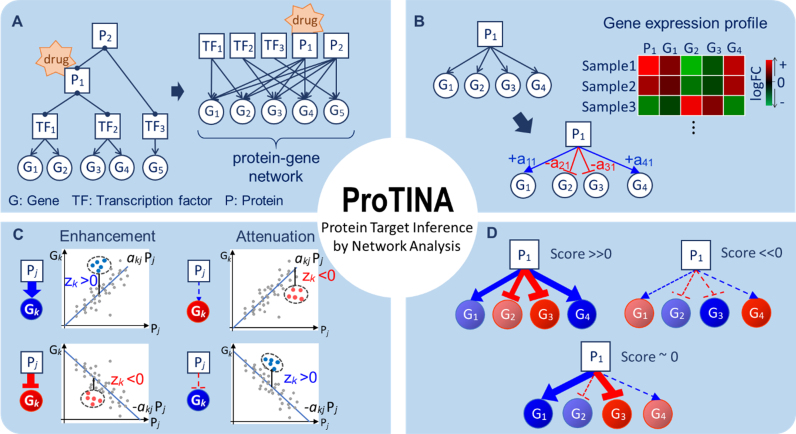
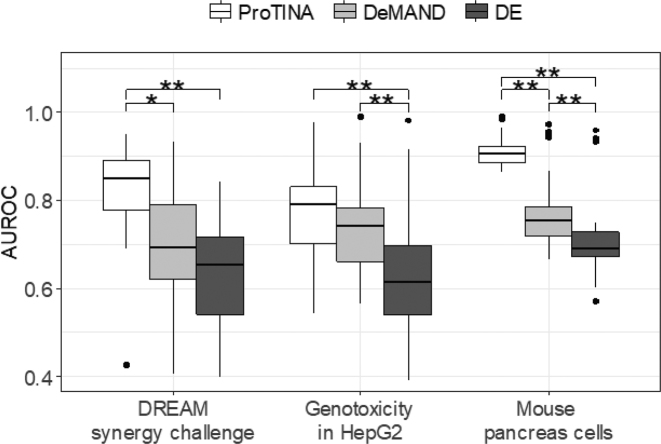
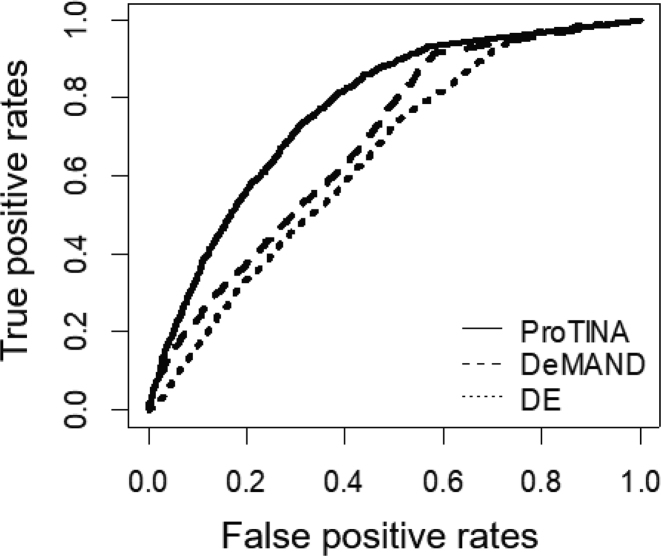
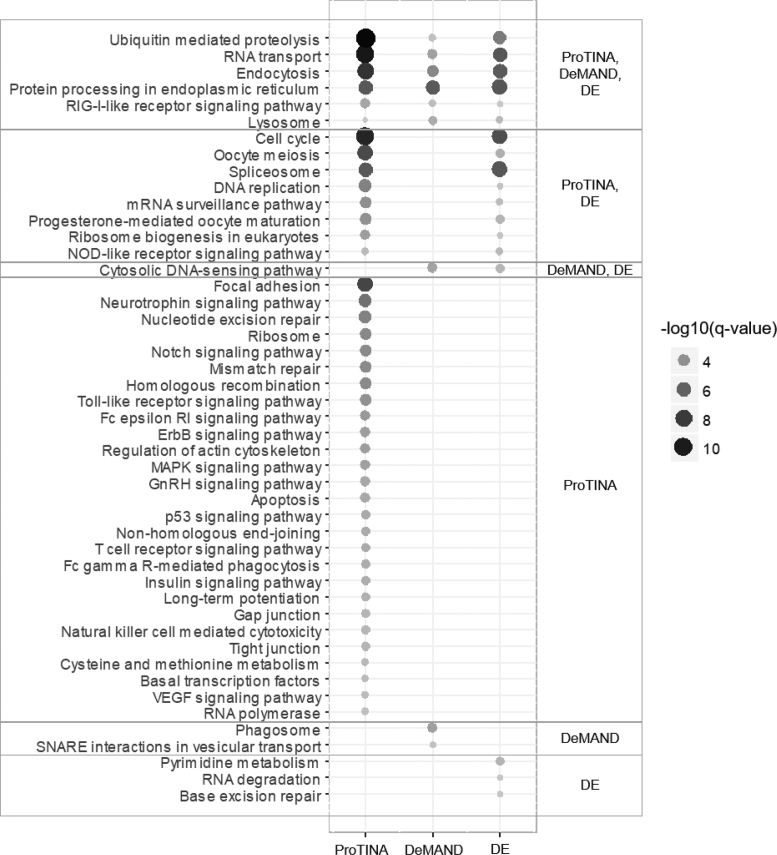
Genome-wide transcriptional profiling provides a global view of cellular state and how this state changes under different treatments (e.g. drugs) or conditions (e.g. healthy and diseased). Here, we present ProTINA (Protein Target Inference by Network Analysis), a network perturbation analysis method for inferring protein targets of compounds from gene transcriptional profiles. ProTINA uses a dynamic model of the cell-type specific protein-gene transcriptional regulation to infer network perturbations from steady state and time-series differential gene expression profiles. A candidate protein target is scored based on the gene network's dysregulation, including enhancement and attenuation of transcriptional regulatory activity of the protein on its downstream genes, caused by drug treatments. For benchmark datasets from three drug treatment studies, ProTINA was able to provide highly accurate protein target predictions and to reveal the mechanism of action of compounds with high sensitivity and specificity. Further, an application of ProTINA to gene expression profiles of influenza A viral infection led to new insights of the early events in the infection.


Figures

Figure 1.
Figure 1.
Protein target prediction by ProTINA. (A) The protein–gene network describes direct and indirect regulations of gene expression by transcription factors (TF) and their protein partners (P), respectively. A drug interaction with a protein is expected to cause differential expression of the downstream genes in the PGN. (B) Based on a kinetic model of gene transcriptional process, ProTINA infers the weights of the protein–gene regulatory edges, denoted by akj, using gene expression data. The variable akj describes the regulation of protein j on gene k, where the magnitude and sign of akj indicate the strength and mode (+akj: activation, –akj: repression) of the regulatory interaction, respectively. (C) A candidate protein target is scored based on the deviations in the expression of downstream genes from the PGN model prediction (Pj: log2FC expression of protein j, Gk: log2FC expression of gene k). The colored dots in the plots illustrate the log2FC data of a particular drug treatment, while the lines show the predicted expression of gene k by the (linear) PGN model. The variable zk denotes the z-score of the deviation of the expression of gene k from the PGN model prediction. A drug-induced enhancement of protein–gene regulatory interactions is indicated by a positive (negative) zk in the expression of genes that are activated (repressed) by the protein (i.e. akjzk > 0). Vice versa, a drug-induced attenuation is indicated by a negative (positive) zk in the expression of genes that are activated (repressed) by the protein (i.e. akjzk < 0). (D) The score of a candidate protein target is determined by combining the z-scores of the set of regulatory edges associated with the protein in the PGN. A positive (negative) score indicates a drug-induced enhancement (attenuation). The larger the magnitude of the score, the more consistent is the drug induced perturbations (enhancement/attenuation) on the protein–gene regulatory edges.
Figure 2.
Figure 2.
Prediction of known targets of drugs. AUROCs of protein target predictions from ProTINA, DeMAND and DE methods for the NCI-DREAM drug synergy (human B-cell lymphoma), the compound genotoxicity (human HepG2) and the chromatin targeting study (mouse pancreatic cell) datasets (*P-value < 0.01, **P-value < 0.001 by paired t-test).
Figure 3.
Figure 3.
Canonical p53 DNA damage response pathway. In response to DNA damage, GADD45A, CDKN1A, PCNA are activated, while AURKA, CCNB1 and PLK1 proteins are inhibited (23).
Figure 4.
Figure 4.
Mechanism of action of compounds based on target predictions by ProTINA. (A) The rank distribution of the canonical p53 DNA damage response proteins in the drug target predictions of ProTINA, DeMAND and DE for the NCI-DREAM drug synergy dataset. (B) The rank distribution of proteins involved in the core DNA-damage repair (DDR) and DDR-associated pathways (56) in the target predictions of ProTINA, DeMAND and DE for the DNA damaging compounds in the NCI-DREAM drug synergy study (**P-value < 0.001 by Wilcoxon signed rank tests).
Figure 5.
Figure 5.
Prediction of targets of influenza A virus. The receiver operative characteristic curves give the true positive rate versus the false positive rate relationship of the protein target predictions from ProTINA, DeMAND and DE against proteins that co-immunoprecipitate with influenza A viral proteins. The AUROCs for ProTINA, DeMAND and DE analysis are 0.77, 0.69 and 0.65, respectively.
Figure 6.
Figure 6.
Gene set enrichment analysis for KEGG pathways for the influenza A protein target predictions from ProTINA, DeMAND and DE. The size of the circles corresponds to –log10 scale of the q-values. Only pathways with q-value < 0.01 are shown.

References

    1. Imming P., Sinning C., Meyer A.. Drugs, their targets and the nature and number of drug targets. Nat. Rev. Drug Discov. 2006; 5:821–834. - PubMed
    1. Schenone M., Dančík V., Wagner B.K., Clemons P.A.. Target identification and mechanism of action in chemical biology and drug discovery. Nat. Chem. Biol. 2013; 9:232–240. - PMC - PubMed
    1. Isik Z., Baldow C., Cannistraci C.V., Schroeder M.. Drug target prioritization by perturbed gene expression and network information. Sci. Rep. 2015; 5:17417. - PMC - PubMed
    1. Chua H.N., Roth F.P.. Discovering the targets of drugs via computational systems biology. J. Biol. Chem. 2011; 286:23653–23658. - PMC - PubMed
    1. Lamb J. The connectivity map: A new tool for biomedical research. Nat. Rev. Cancer. 2007; 7:54–60. - PubMed

Publication types

MeSH terms

Substances