. 2018 Feb;29(1):60-74.
doi: 10.1089/hgtb.2017.190.

Rapid and Sensitive Assessment of Globin Chains for Gene and Cell Therapy of Hemoglobinopathies

Affiliations

Rapid and Sensitive Assessment of Globin Chains for Gene and Cell Therapy of Hemoglobinopathies

Constantinos C Loucari et al. Hum Gene Ther Methods. 2018 Feb.

Abstract

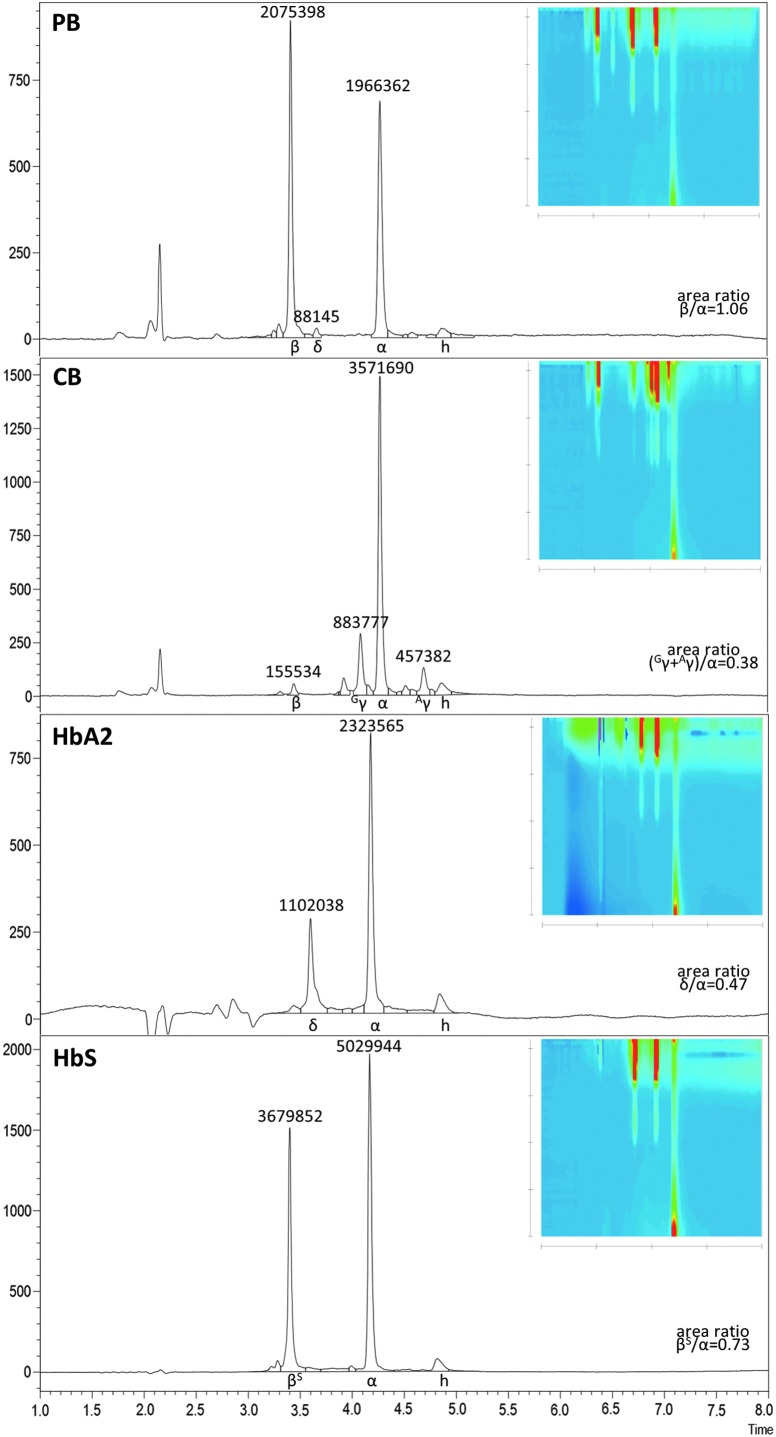
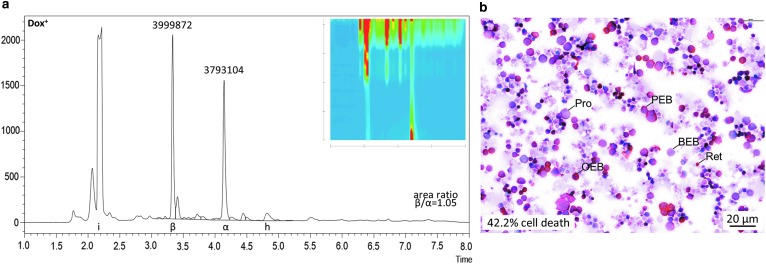
The β-hemoglobinopathies sickle cell anemia and β-thalassemia are the focus of many gene-therapy studies. A key disease parameter is the abundance of globin chains because it indicates the level of anemia, likely toxicity of excess or aberrant globins, and therapeutic potential of induced or exogenous β-like globins. Reversed-phase high-performance liquid chromatography (HPLC) allows versatile and inexpensive globin quantification, but commonly applied protocols suffer from long run times, high sample requirements, or inability to separate murine from human β-globin chains. The latter point is problematic for in vivo studies with gene-addition vectors in murine disease models and mouse/human chimeras. This study demonstrates HPLC-based measurements of globin expression (1) after differentiation of the commonly applied human umbilical cord blood-derived erythroid progenitor-2 cell line, (2) in erythroid progeny of CD34+ cells for the analysis of clustered regularly interspaced short palindromic repeats/Cas9-mediated disruption of the globin regulator BCL11A, and (3) of transgenic mice holding the human β-globin locus. At run times of 8 min for separation of murine and human β-globin chains as well as of human γ-globin chains, and with routine measurement of globin-chain ratios for 12 nL of blood (tested for down to 0.75 nL) or of 300,000 in vitro differentiated cells, the methods presented here and any variant-specific adaptations thereof will greatly facilitate evaluation of novel therapy applications for β-hemoglobinopathies.

Keywords: CRISPR/Cas9; fetal hemoglobin; gene addition; high-performance liquid chromatography; thalassemia; β-hemoglobinopathy.


Conflict of interest statement

No competing financial interests exist for any of the authors.

Figures

<b>Figure 1.</b>
Figure 1.
Reversed-phase high-performance liquid chromatography (RP-HPLC) separation of human control samples. Chromatograms of human samples with readout at 190 nm (1 nm bandwidth) for injection of 12 nL peripheral blood (in panels PB, CB, and HbS) in a volume of 3 μL, background-subtracted for a 3 μL water-only sample. Analyses are shown for peripheral blood (PB), cord blood (CB), purified HbA2 (an α2δ2 heterotetramer), and HbS. Injection is visible as a peak at 2.2 min. Other relevant peaks are identified underneath each chromatogram as β-globin (β), sickling β-globin (βS), δ-globin (δ), Gγ-globin (Gγ), α-globin (α), Aγ-globin (Aγ), and heme (h). Differing absorbance ratios for the total of β-like globins compared to α-globin are in part caused by differential molar absorption of different globin chains. Colored insets show contour plots for the PDA detector from 190 to 400 nm (on the vertical axis; tick marks indicate 200 nm and 50-nm increments from top to bottom) and 0 to 8 min (on the horizontal axis; tick marks indicate 0 min and 2-min increments from left to right). Heme can readily be discerned from other peaks by a local absorbance maximum close to 400 nm. Measurements and ratios for this figure are summarized in Supplementary Table S1.
<b>Figure 2.</b>
Figure 2.
Analysis of human umbilical cord blood–derived erythroid progenitor-2 (HUDEP-2) differentiation. (a) High-performance liquid chromatography (HPLC) analysis of HUDEP-2 cells differentiated for 4 days at half the doxycycline concentration employed during expansion phase. Injection is visible as a peak at 2.2 min. Other relevant peaks are identified underneath the chromatogram as β-globin (β), α-globin (α), and heme (h); δ-globin expression is below the detection limit. Numbers above peaks give the corresponding peak area measurement and thus the relative level of globin chain expression. The colored inset shows the contour plot for the PDA detector from 190 to 400 nm (on the vertical axis; tick marks indicate 200 nm and 50-nm increments from top to bottom) and from 0 to 8 min (on the horizontal axis; tick marks indicate 0 min and 2-min increments from left to right). (b) Microscopy image after cytocentrifugation and histochemical staining (scale bar 20 μm), brown indicating hemoglobinization, and decreased cell size and nuclear condensation indicating more advanced differentiation, as labeled for representative cells, Pro denoting proerythroblast, BEB basophilic erythroblast, PEB polychromatophilic erythroblast, OEB orthochromatophilic erythroblast, and Ret reticulocyte. Same-sample measurement of cell death was based on independent trypan blue staining. Measurements and ratios for this figure are summarized in Supplementary Table S1.
<b>Figure 3.</b>
Figure 3.
Assessment of globin chain expression in primary human HSPCs after clustered regularly interspaced short palindromic repeats (CRISPR)/Cas9-mediated BCL11A knockout. (a) T7 endonuclease I (T7EI) assay performed 48 h after transduction for primary cells from a β-thalassemia carrier treated with buffer only (untransduced), Cas9-only vector (Cas9-only), CRISPR/Cas9 targeting the BCL11A start codon (start codon), and the BCL11A exon 1 (exon 1), as indicated. Cells were incubated for an additional 96 h without puromycin enrichment of nuclease-bearing cells before protein-based analyses. (b) Same-sample immunoblot analysis for detection of γ-globin, α-globin, and same-gel, same-membrane β-actin loading control. For clarity, lanes shown for immunoblots have been excised digitally from larger membrane images comprising additional samples. Quantifications are based on the volume plots shown and α-globin normalization for differentiation, with same-membrane, same-lane β-actin (as indicated by a black bar lining same-membrane samples) normalization for loading of each globin blot. (c) Same-sample HPLC analysis using the standard protocol given in Table 1. Colored insets show contour plots for the PDA detector from 190 to 400 nm (on the vertical axis; tick marks indicate 200 nm and 50-nm increments from top to bottom) and from 0 to 8 min (on the horizontal axis; tick marks indicate 0 min and 2-min increments from left to right). (d) Bar chart showing an alignment of immunoblot (IB) data and RP-HPLC data for changes in the ratio of γ-globin to α-globin (γ/α) relative to Cas9-only control, additionally displaying also the differential effect on Gγ and Aγ and the therapeutically most relevant ratio of β-like globins (combining β-, δ-, and γ-globin peaks) to α-globin for the RP-HPLC analysis. For clarity, only data without normalization for disruption efficiencies are shown. β, β-globin; Gγ, Gγ-globin, Aγ, Aγ-globin; α, α-globin; h, heme; act, β-actin. Measurements and ratios for this figure are summarized in Supplementary Table S2.
<b>Figure 4.</b>
Figure 4.
Detection of murine and human β-globin chains. Chromatogram of sample readout at 190 nm (1 nm bandwidth) for injection of 12 nL peripheral blood in a volume of 3 μL, background-subtracted for a 3 μL water-only sample. Analyses are shown for murine peripheral blood (Mm), human peripheral blood (Hs), a mixture of murine and human peripheral blood at a volume ratio 3:1 (Mm:Hs 3:1), and peripheral blood of a transgenic mouse harboring the human β-globin locus. Injection is visible as a peak at 3.1 min. Other relevant peaks are identified underneath each chromatogram as murine α-globin (Mα), murine β-globin (Mβ), human β-globin (Hβ), and human α-globin (Hα). Colored insets show contour plots for the PDA detector from 190 to 400 nm (on the vertical axis; tick marks indicate 200 nm and 50-nm increments from top to bottom) and from 0 to 8 min (on the horizontal axis; tick marks indicate 0 min and 2-min increments from left to right). Heme elutes between injections at approximately 9 min (not shown).

References

    1. Rees DC, Williams TN, Gladwin MT. Sickle-cell disease. Lancet 2010;376:2018–2031 - PubMed
    1. Thein SL. The molecular basis of β-thalassemia. Cold Spring Harb Perspect Med 2013;3:a011700. - PMC - PubMed
    1. Galanello R, Cao A. Alpha-thalassemia. Genet Med 2011;13:83–88 - PubMed
    1. Aguilar Martinez P, Angastiniotis M, Eleftheriou A, et al. . Haemoglobinopathies in Europe: health and migration policy perspectives. Orphanet J Rare Dis 2014;9:97. - PMC - PubMed
    1. Kauf TL, Coates TD, Huazhi L, et al. . The cost of health care for children and adults with sickle cell disease. Am J Hematol 2009;84:323–327 - PubMed

Publication types