. 2018 Jan 11;6(1):10.
doi: 10.1186/s40168-017-0395-y.

Haemophilus is overrepresented in the nasopharynx of infants hospitalized with RSV infection and associated with increased viral load and enhanced mucosal CXCL8 responses

Affiliations

Haemophilus is overrepresented in the nasopharynx of infants hospitalized with RSV infection and associated with increased viral load and enhanced mucosal CXCL8 responses

Thomas H A Ederveen et al. Microbiome. .

Abstract

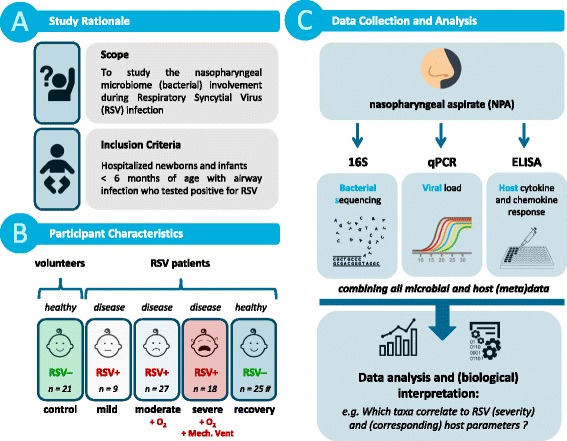
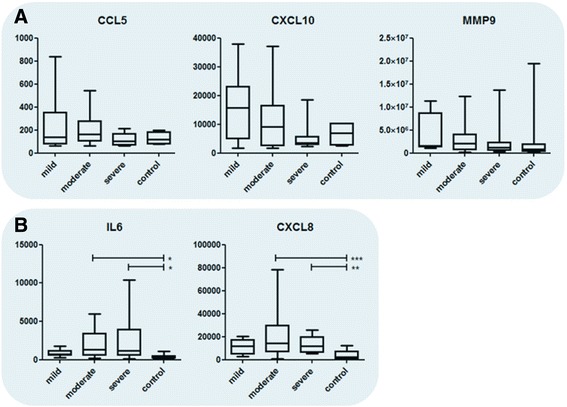
Background: While almost all infants are infected with respiratory syncytial virus (RSV) before the age of 2 years, only a small percentage develops severe disease. Previous studies suggest that the nasopharyngeal microbiome affects disease development. We therefore studied the effect of the nasopharyngeal microbiome on viral load and mucosal cytokine responses, two important factors influencing the pathophysiology of RSV disease. To determine the relation between (i) the microbiome of the upper respiratory tract, (ii) viral load, and (iii) host mucosal inflammation during an RSV infection, nasopharyngeal microbiota profiles of RSV infected infants (< 6 months) with different levels of disease severity and age-matched healthy controls were determined by 16S rRNA marker gene sequencing. The viral load was measured using qPCR. Nasopharyngeal CCL5, CXCL10, MMP9, IL6, and CXCL8 levels were determined with ELISA.

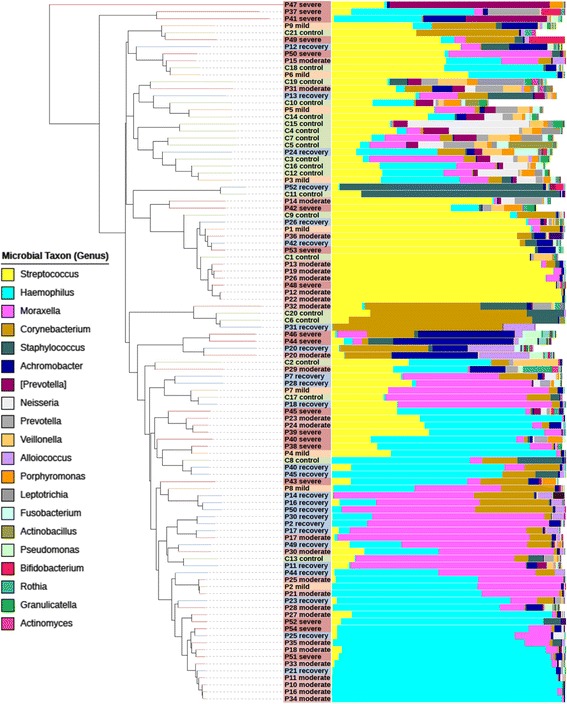
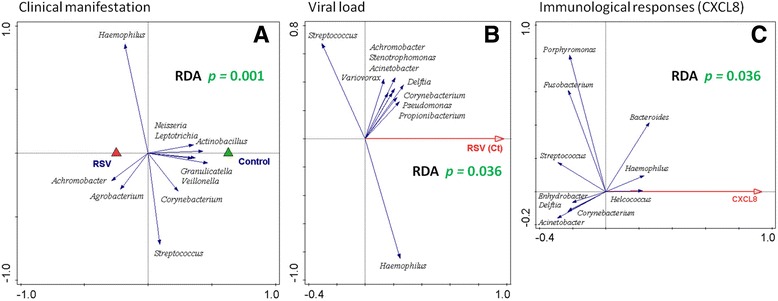
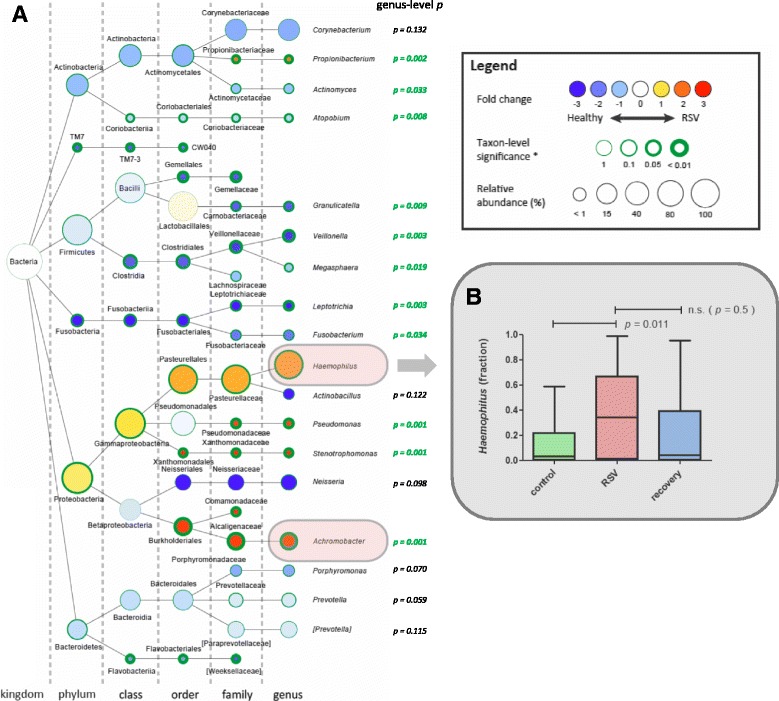
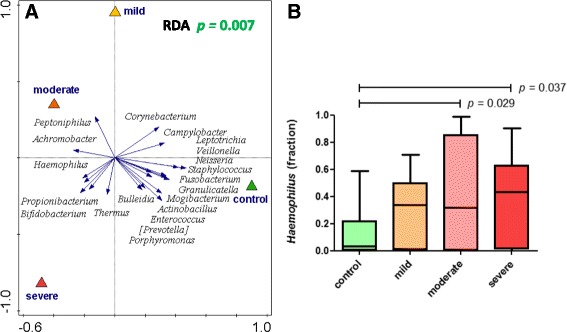
Results: Viral load in nasopharyngeal aspirates of patients associates significantly to total nasopharyngeal microbiota composition. Healthy infants (n = 21) and RSV patients (n = 54) display very distinct microbial patterns, primarily characterized by a loss in commensals like Veillonella and overrepresentation of opportunistic organisms like Haemophilus and Achromobacter in RSV-infected individuals. Furthermore, nasopharyngeal microbiota profiles are significantly different based on CXCL8 levels. CXCL8 is a chemokine that was previously found to be indicative for disease severity and for which we find Haemophilus abundance as the strongest predictor for CXCL8 levels.

Conclusions: The nasopharyngeal microbiota in young infants with RSV infection is marked by an overrepresentation of the genus Haemophilus. We present that this bacterium is associated with viral load and mucosal CXCL8 responses, both which are involved in RSV disease pathogenesis.

Keywords: Chemokine; Microbiome; Mucosal inflammation; RSV; Viral load.


Conflict of interest statement

Ethics approval and consent to participate

The study was approved by the Central Committee on Research Involving Human Subjects of the Radboud University Medical Center.

Consent for publication

Not applicable.

Competing interests

The authors declare that they have no competing interests. The funding sources had no role in the design of the study, nor in collection, management, analysis, and interpretation of the data; did not partake in preparation, review, or approval of the manuscript; and had no decision in submitting the manuscript for publication.

Publisher’s Note

Springer Nature remains neutral with regard to jurisdictional claims in published maps and institutional affiliations.

Figures

Fig. 1
Fig. 1
Study design. Graphical summary of the study focus, design, and analysis, as adopted in this manuscript
Fig. 2
Fig. 2
Nasopharyngeal microbiota composition in healthy and RSV-infected infants. Each leaf of the tree represents a single sample. Samples were clustered based on beta diversity (‘between-sample distance’), using weighted UniFrac as a distance measure and hierarchical UPGMA as a clustering method. Vertical bars show the relative abundance microbiota composition on the genus level (reads that could not be classified up to this level are in white). The 20 most dominant genera are shown in the legend. Colored sample labels represent sample classes: mild (orange), moderate (light red), or severe (dark red) disease; healthy control (green); and recovery (blue) samples. The figure was generated with the interactive tree of life (iTOL) program
Fig. 3
Fig. 3
RSV disease, viral load, and CXCL8 levels in healthy and RSV-infected individuals can be explained by nasopharyngeal microbial makeup (genus-level). Redundancy analysis (RDA) biplots are shown. Nasopharyngeal genus-level microbiota from healthy and RSV-infected individuals are significantly different, irrespective of disease severity (a) (according to a permutation test; p value = 0.001). Triangles are the centroids of the study sample groups: RSV (red) and healthy control (green). RDA of RSV-infected individuals (healthy and recovery samples were excluded from analysis) shows that nasopharyngeal genus-level microbiota can significantly be separated based on viral load (b) (Ct threshold plotted: higher Ct number corresponds to higher number of PCR cycles before confident virus detection, hence lower viral load; p value = 0.036). For a and b, the blue arrows are the 10 best-fitting genera (names in italic), which are the genera best explaining microbiota compositional differences between disease status (a) or different levels of RSV virus (b) as plotted on the horizontal axis. RDA of healthy and RSV-infected individuals shows that nasopharyngeal genus-level microbiota can significantly be separated based on levels of CXCL8 (c) (p value = 0.036; log transformation was set to 1000). The first component (horizontal axis) is optimized to explain CXCL8 level based on microbiota relative abundances (concentration of CXCL8 in pg/μl). Correspondingly, the blue arrows are the genera (names in italic) explaining at least 5% of this variation. RDA was corrected for age, gender, and birth weight. See Additional file 2: Figure S2 for similar analysis on the OTU level
Fig. 4
Fig. 4
Difference in nasopharyngeal microbial community composition between healthy and RSV-infected individuals is strongly characterized by an overrepresentation of Haemophilus. The strongest differentially abundant microbial taxa for healthy versus RSV-infected individuals are shown in a graphical Cytoscape visualization (a) [51]. Nodes represent taxa (node size represents average relative abundance (i.e., dominance) for both experimental groups combined); edges (dashed lines) link the different taxonomic levels. The weighed fold-change (node color) is calculated as the 2log of the ratio of the relative abundance between healthy and RSV (0 = no difference between disease state, 1 = twice as abundant in RSV, etc.). So, yellow to red indicates an overrepresentation during RSV infection, hence an underrepresentation in healthy infants and vice versa for light to dark blue. The significance (node border width) is expressed as the p value of a Mann–Whitney U test, FDR-corrected for multiple testing. The genus-level p values are listed on the right of the genera nodes. We observe a strong and significant overrepresentation of Haemophilus genus during RSV infection (p = 0.011) (b) and of Achromobacter (p = 0.001) (Additional file 2: Figure S4A). For recovery versus RSV samples, significance was determined using Wilcoxon signed rank test
Fig. 5
Fig. 5
Chemokine and cytokine levels during RSV infection. Chemokine and cytokine levels in nasopharyngeal aspirates of healthy, RSV-infected individuals with different disease severities (a, b). In general, host responses are observed to be negatively (a) or positively (b) correlated with RSV severity. Data is presented in pg/ml. Statistics in these plots were obtained by Kruskal–Wallis one-way ANOVA, with Dunn’s correction for multiple testing. Significances are as follows: *p < 0.05, **p < 0.01, ***p < 0.001
Fig. 6
Fig. 6
Nasopharyngeal microbiota composition allows for separation of healthy and RSV-infected individuals. Nasopharyngeal genus-level microbiota from healthy and RSV-infected individuals are significantly different (a). The figure shows a redundancy analysis (RDA) biplot. Triangles are the centroids of the study sample groups: mild (yellow), moderate (orange), and severe (red) RSV and healthy control (green). The blue arrows are the 20 best-fitting bacterial genera (names in italic), i.e., taxa that best explain the differences between the sample groups. The horizontal axis maximizes the variation in sample groups (in contrast to a principal component analysis plot, where the variation between individual samples is maximized). In RDA, samples (also) separated in the vertical direction indicate that this separation is (also) driven by other factors than the primary contrast, such as by individuality. The difference in microbiota is significant (according to a permutation test; p = 0.007). We observe a strong and significant overrepresentation of Haemophilus genus in RSV (p = 0.011; MWU, FDR-corrected) especially in moderate and severe RSV infections (b) and of Achromobacter (p = 0.001) (Additional file 2: Figure S4A)

References

    1. Nair H, et al. Global burden of acute lower respiratory infections due to respiratory syncytial virus in young children: a systematic review and meta-analysis. Lancet. 2010;375(9725):1545–1555. - PMC - PubMed
    1. Hall CB, et al. The burden of respiratory syncytial virus infection in young children. N Engl J Med. 2009;360(6):588–598. - PMC - PubMed
    1. Meissner HC. Viral bronchiolitis in children. N Engl J Med. 2016;374(1):62–72. - PubMed
    1. Openshaw PJ, Tregoning JS. Immune responses and disease enhancement during respiratory syncytial virus infection. Clin Microbiol Rev. 2005;18(3):541–555. - PMC - PubMed
    1. Simoes EA. Environmental and demographic risk factors for respiratory syncytial virus lower respiratory tract disease. J Pediatr. 2003;143(5 Suppl):S118–S126. - PubMed

Publication types

MeSH terms