

TCF7L2 Genetic Variation Augments Incretin Resistance and Influences Response to a Sulfonylurea and Metformin: The Study to Understand the Genetics of the Acute Response to Metformin and Glipizide in Humans (SUGAR-MGH)
- PMID: 29326107
- PMCID: PMC5829963
- DOI: 10.2337/dc17-1386
TCF7L2 Genetic Variation Augments Incretin Resistance and Influences Response to a Sulfonylurea and Metformin: The Study to Understand the Genetics of the Acute Response to Metformin and Glipizide in Humans (SUGAR-MGH)
Abstract
Objective: The rs7903146 T allele in transcription factor 7 like 2 (TCF7L2) is strongly associated with type 2 diabetes (T2D), but the mechanisms for increased risk remain unclear. We evaluated the physiologic and hormonal effects of TCF7L2 genotype before and after interventions that influence glucose physiology.
Research design and methods: We genotyped rs7903146 in 608 individuals without diabetes and recorded biochemical data before and after 1) one dose of glipizide (5 mg) on visit 1 and 2) a 75-g oral glucose tolerance test (OGTT) performed after administration of metformin 500 mg twice daily over 2 days. Incretin levels were measured in 150 of the 608 participants.
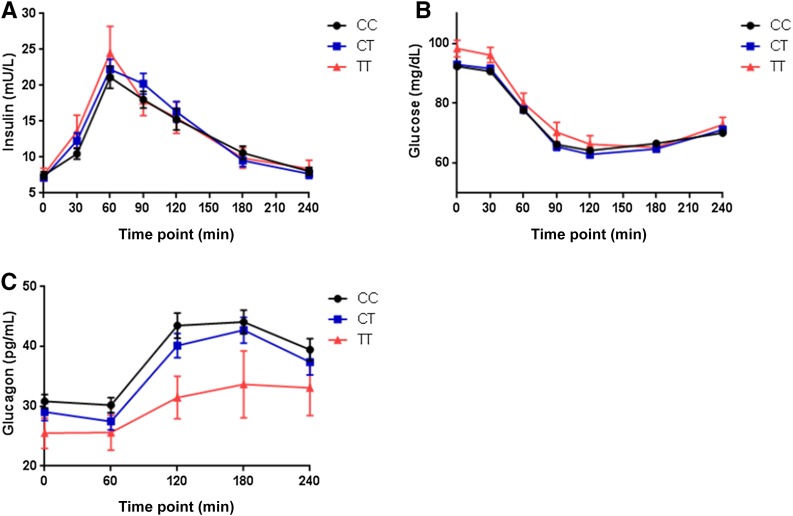
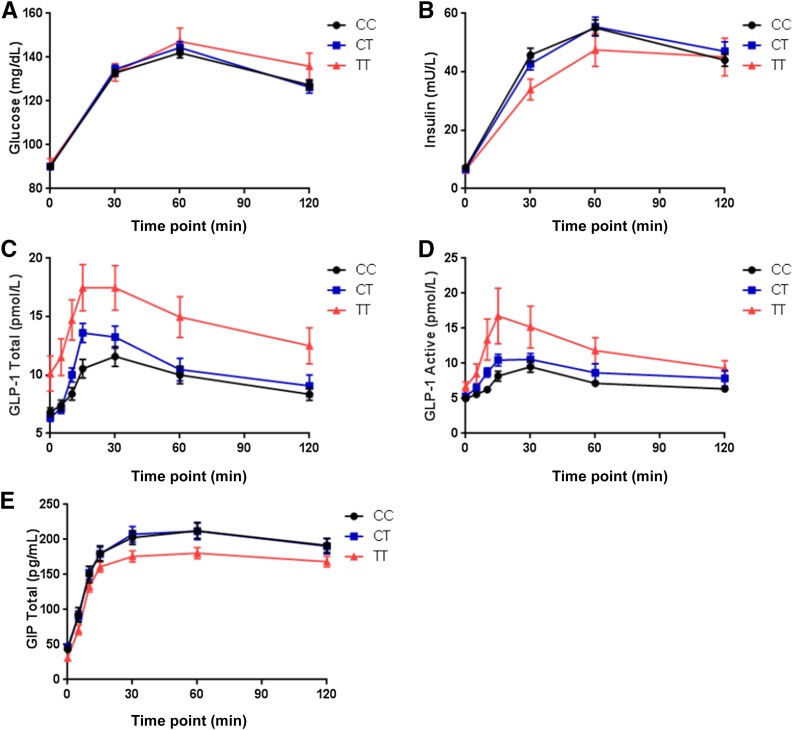
Results: TT risk-allele homozygotes had 1.6 mg/dL higher baseline fasting glucose levels and 2.5 pg/mL lower glucagon levels per T allele than carriers of other genotypes at baseline. In a subset of participants, the T allele was associated with higher basal glucagon-like peptide 1 (GLP-1) levels at visit 1 (β = 1.52, P = 0.02 and β = 0.96, P = 0.002 for total and active GLP-1, respectively), and across all points of the OGTT after metformin administration. Regarding drug response, the T allele was associated with a shorter time (β = -7.00, P = 0.03) and a steeper slope (β = 0.23, P = 0.04) to trough glucose levels after glipizide administration, and lower visit 2 fasting glucose level adjusted for visit 1 fasting glucose level (β = -1.02, P = 0.04) and a greater decline in glucose level between visits (β = -1.61, P = 0.047) after metformin administration.
Conclusions: Our findings demonstrate that common variation at TCF7L2 influences acute responses to both glipizide and metformin in people without diabetes and highlight altered incretin signaling as a potential mechanism by which TCF7L2 variation increases T2D risk.
Trial registration: ClinicalTrials.gov NCT01762046.
© 2018 by the American Diabetes Association.
Figures
References
-
- Holman RR, Paul SK, Bethel MA, Matthews DR, Neil HA. 10-year follow-up of intensive glucose control in type 2 diabetes. N Engl J Med 2008;359:1577–1589 - PubMed
-
- Bressler R, Johnson DG. Pharmacological regulation of blood glucose levels in non-insulin-dependent diabetes mellitus. Arch Intern Med 1997;157:836–848 - PubMed
-
- Mahajan A, Go MJ, Zhang W, et al.; DIAbetes Genetics Replication And Meta-analysis (DIAGRAM) Consortium; Asian Genetic Epidemiology Network Type 2 Diabetes (AGEN-T2D) Consortium; South Asian Type 2 Diabetes (SAT2D) Consortium; Mexican American Type 2 Diabetes (MAT2D) Consortium; Type 2 Diabetes Genetic Exploration by Nex-generation sequencing in muylti-Ethnic Samples (T2D-GENES) Consortium . Genome-wide trans-ancestry meta-analysis provides insight into the genetic architecture of type 2 diabetes susceptibility. Nat Genet 2014;46:234–244 - PMC - PubMed
Publication types
MeSH terms
Substances
Associated data
Grants and funding
LinkOut - more resources
Full Text Sources
Other Literature Sources
Medical
