. 2019 Feb;24(2):169-181.
doi: 10.1038/s41380-017-0001-5. Epub 2018 Jan 11.

A combined analysis of genetically correlated traits identifies 187 loci and a role for neurogenesis and myelination in intelligence

Affiliations

A combined analysis of genetically correlated traits identifies 187 loci and a role for neurogenesis and myelination in intelligence

W D Hill et al. Mol Psychiatry. 2019 Feb.

Abstract

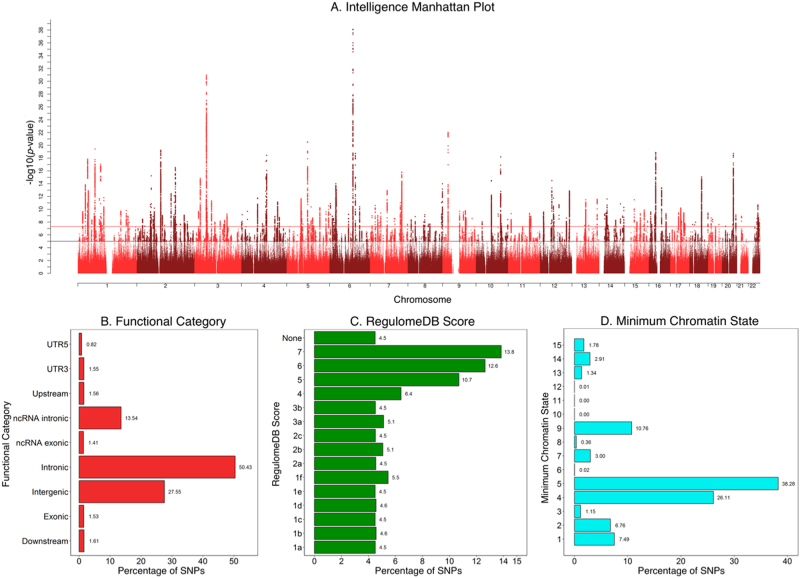
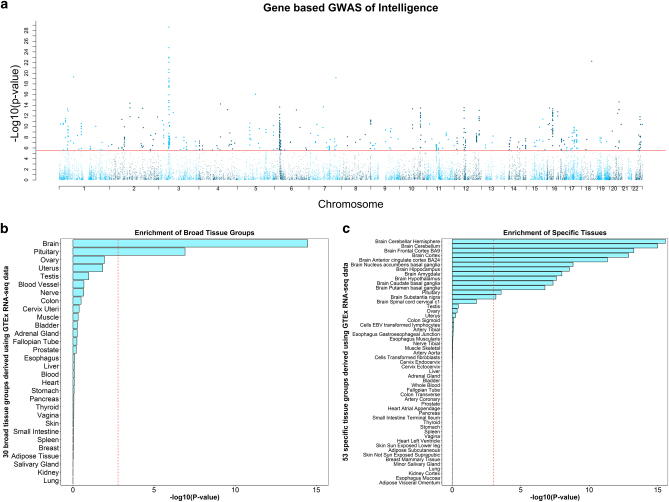
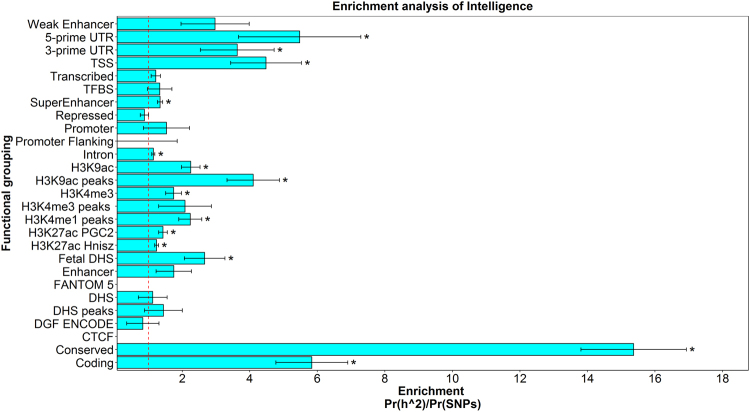
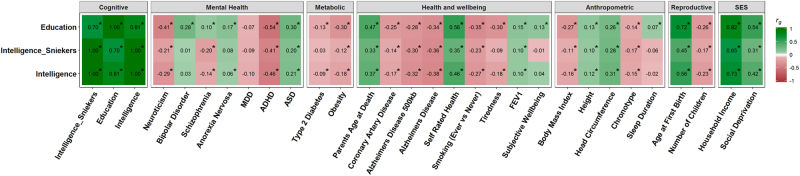
Intelligence, or general cognitive function, is phenotypically and genetically correlated with many traits, including a wide range of physical, and mental health variables. Education is strongly genetically correlated with intelligence (rg = 0.70). We used these findings as foundations for our use of a novel approach-multi-trait analysis of genome-wide association studies (MTAG; Turley et al. 2017)-to combine two large genome-wide association studies (GWASs) of education and intelligence, increasing statistical power and resulting in the largest GWAS of intelligence yet reported. Our study had four goals: first, to facilitate the discovery of new genetic loci associated with intelligence; second, to add to our understanding of the biology of intelligence differences; third, to examine whether combining genetically correlated traits in this way produces results consistent with the primary phenotype of intelligence; and, finally, to test how well this new meta-analytic data sample on intelligence predicts phenotypic intelligence in an independent sample. By combining datasets using MTAG, our functional sample size increased from 199,242 participants to 248,482. We found 187 independent loci associated with intelligence, implicating 538 genes, using both SNP-based and gene-based GWAS. We found evidence that neurogenesis and myelination-as well as genes expressed in the synapse, and those involved in the regulation of the nervous system-may explain some of the biological differences in intelligence. The results of our combined analysis demonstrated the same pattern of genetic correlations as those from previous GWASs of intelligence, providing support for the meta-analysis of these genetically-related phenotypes.


Conflict of interest statement

IJD is a participant in UK Biobank.

Figures

Fig. 1
Fig. 1
a. The results of our MTAG analysis. SNP-based GWAS Manhattan plot; negative log10 transformed P-values for each SNP are plotted against chromosomal location. The red line indicates genome-wide significance and the black line indicates suggestive associations. b. Functional annotation carried out using FUMA on the independent genomic loci identified. The percentage of SNPs found in each of the nine functional categories is listed. c. The percentage of SNPs from the independent genomic loci that fell into each of the Regulome DB scores categories. A lower score indicates greater evidence for that SNPs involvement in gene regulation. d. The percentage of SNPs within the independent genomic loci plotted against the minimum chromatic state for 127 tissue/cell types
Fig. 2
Fig. 2
a. Gene based Manhattan plot; negative log10 transformed P-values for each gene (derived using MAGMA) are plotted against chromosomal location. The red line indicates genome wide significance. b gene property analysis linking transcription differences in 30 broad tissue types (y-axis) with the gene based statistics produced from MAGMA. Red line indicates significance following Bonferroni correction for the 53 tests performed. c gene property analysis linking transcription differences in 53 tissue types (y-axis) with the gene based statistics produced from MAGMA. Red line indicates significance following Bonferroni correction for the 53 tests performed
Fig. 3
Fig. 3. Enrichment analysis for intelligence using the 52 functional categories.
This analysis differs from that performed by FUMA as all SNPs are used whereas, in FUMA, only those in the independent genomic loci are annotated. The enrichment statistic is the proportion of heritability found in each functional group divided by the proportion of SNPS in each group (Pr(h2)/Pr(SNPs)). The dashed line indicates no enrichment found when Pr(h2)/Pr(SNPs) = 1. Statistical significance is indicated by asterisk
Fig. 4
Fig. 4. Heat map showing the genetic correlations between the meta-analytic intelligence phenotype, intelligence, education with 29 cognitive, SES, mental health, metabolic, health and wellbeing, anthropometric, and reproductive traits.
Positive genetic correlations are shown in green and negative genetic correlations are shown in red. Statistical significance following FDR (using Benjamini-Hochberg procedure [51]) correction is indicated by an asterisk

References

    1. Spearman C. “General Intelligence,” Objectively Determined and Measured. Am J Psychol. 1904;15:201–92. doi: 10.2307/1412107. - DOI
    1. Carroll JB. Human cognitive abilities: A survey of factor-analytic studies. New York, NY: Cambridge University Press; 1993.
    1. Deary IJ, Weiss A, Batty GD. Intelligence and personality as predictors of illness and death how researchers in differential psychology and chronic disease epidemiology are collaborating to understand and address health inequalities. Psychol Sci Publ Int. 2010;11:26. - PubMed
    1. Calvin CM, Batty GD, Der G, Brett CE, Taylor A, Pattie A, et al. Childhood intelligence in relation to major causes of death in 68 year follow-up: prospective population study. BMJ. 2017;357:j2708. doi: 10.1136/bmj.j2708. - DOI - PMC - PubMed
    1. Calvin CM, Deary IJ, Fenton C, Roberts BA, Der G, Leckenby N, et al. Intelligence in youth and all-cause-mortality: systematic review with meta-analysis. Int J Epidemiol. 2011;40:626–44. doi: 10.1093/ije/dyq190. - DOI - PMC - PubMed

Publication types