. 2017 Dec 15:8:347.
doi: 10.3389/fendo.2017.00347. eCollection 2017.

Alterations in Mitochondrial Oxidative Stress and Mitophagy in Subjects with Prediabetes and Type 2 Diabetes Mellitus

Affiliations

Alterations in Mitochondrial Oxidative Stress and Mitophagy in Subjects with Prediabetes and Type 2 Diabetes Mellitus

Shipra Bhansali et al. Front Endocrinol (Lausanne). .

Abstract

Background and aim: Hyperglycemia-mediated oxidative stress impedes cell-reparative process like autophagy, which has been implicated in impairment of β-cell function in type 2 diabetes mellitus (T2DM). However, the role of mitophagy (selective mitochondrial autophagy) in progression of hyperglycemia remains elusive. This study aimed to assess the impact of increasing severity of hyperglycemia on mitochondrial stress and mitophagy.

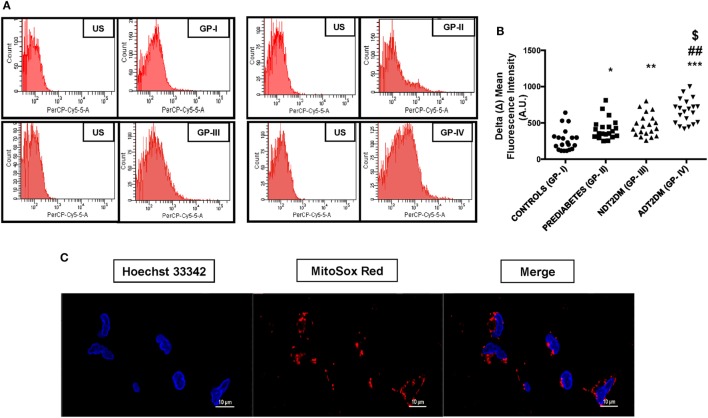
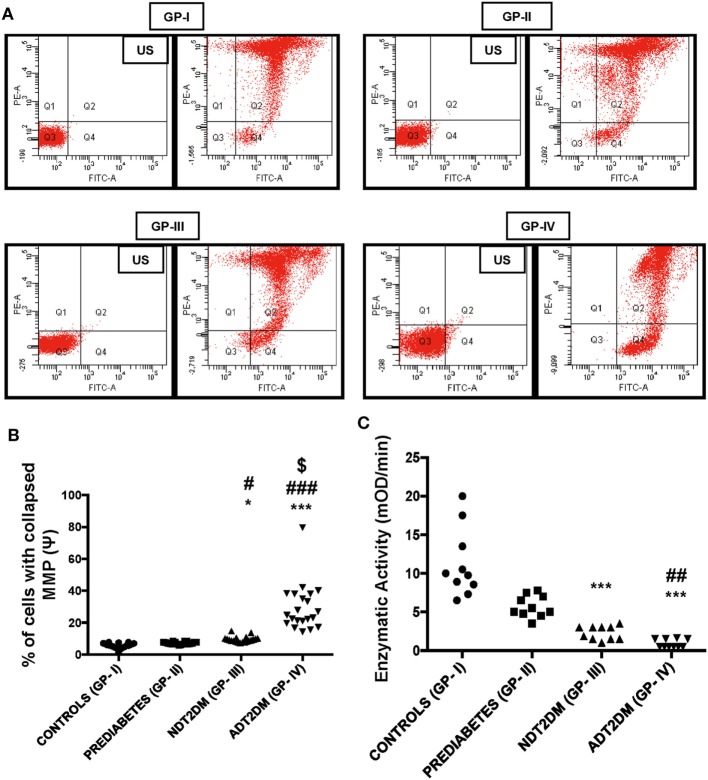
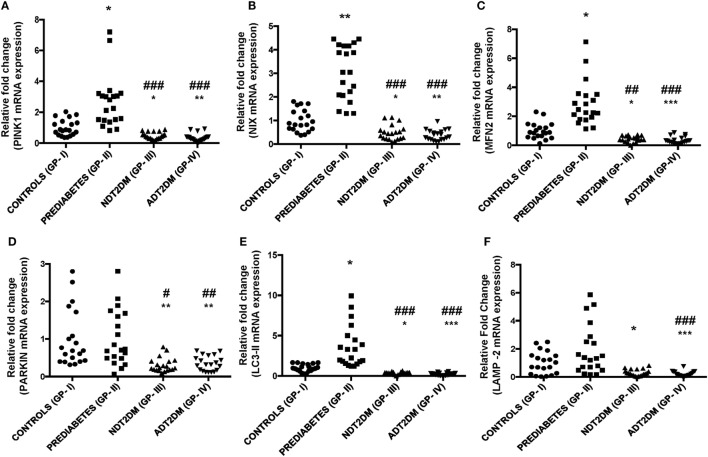
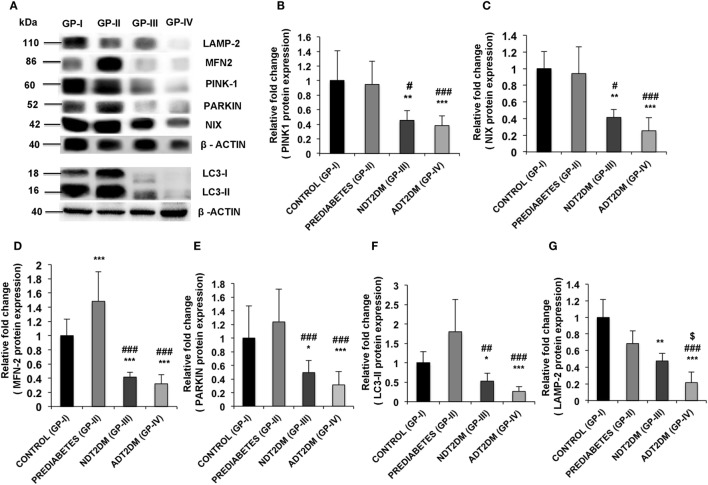
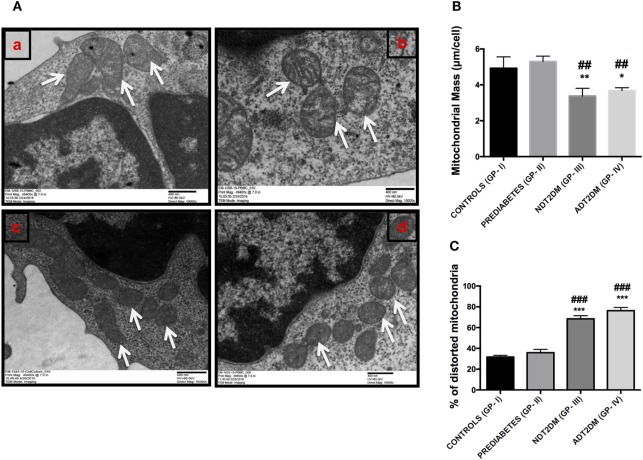
Design and methods: A case-control study included healthy controls, subjects with prediabetes, newly diagnosed T2DM (NDT2DM) and advanced duration of T2DM (ADT2DM) (n = 20 each). Mitochondrial stress indices, transcriptional and translational expression of mitophagy markers (PINK1, PARKIN, MFN2, NIX, LC3-II, and LAMP-2) and transmission electron microscopic (TEM) studies were performed in peripheral blood mononuclear cells.

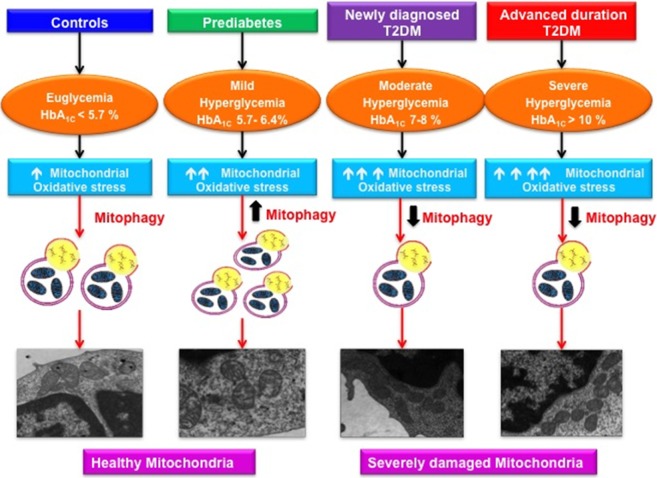
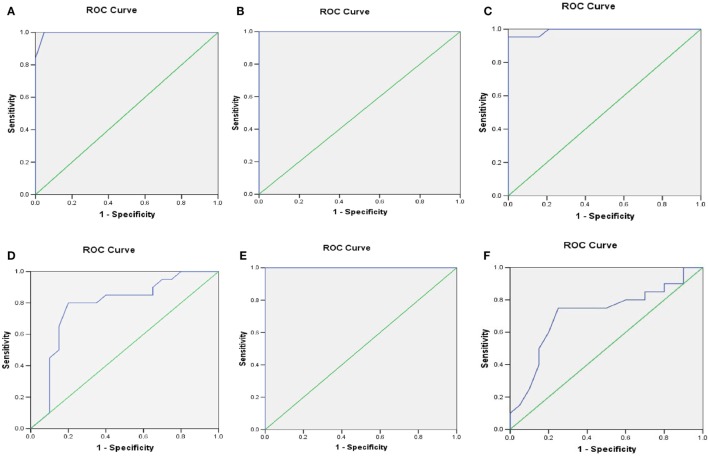
Results: With mild hyperglycemia in subjects with prediabetes, to moderate to severe hyperglycemia in NDT2DM and ADT2DM, a progressive rise in mitochondrial oxidative stress was observed. Prediabetic subjects exhibited significantly increased expression of mitophagy-related markers and showed a positive association with HOMA-β, whereas, patients with NDT2DM and ADT2DM demonstrated decreased expression, with a greater decline in ADT2DM subjects. TEM studies revealed significantly reduced number of distorted mitochondria in prediabetics, as compared to the T2DM patients. In addition, receiver operating characteristic analysis showed HbA1C > 7% (53 mmol/mol) was associated with attenuated mitophagy.

Conclusion: Increasing hyperglycemia is associated with progressive rise in oxidative stress and altered mitochondrial morphology. Sustenance of mitophagy at HbA1C < 7% (53 mmol/mol) strengthens the rationale of achieving HbA1C below this cutoff for good glycemic control. An "adaptive" increase in mitophagy may delay progression to T2DM by preserving the β-cell function in subjects with prediabetes.

Keywords: mitochondrial oxidative stress; mitophagy; prediabetes; reactive oxygen species; type 2 diabetes mellitus.


Figures

Graphical AbStract
Graphical AbStract
Varying magnitude of mitochondrial oxidative stress and mitophagy in subjects with increasing severity of glycemic burden.
Figure 1
Figure 1
Depicts mitochondrial reactive oxygen species (mtROS) content in study subjects. US-unstained (autofluorescence). (A) Representative FACS image of mitosox fluorescence intensity (B) bar graph represents delta mean fluorescence in controls (GP-I); prediabetic subjects (GP-II); NDT2DM (GP-III); and ADT2DM patients (GP-IV). Values are expressed in median and interquartile range (n = 20). (* = vs. GP-I), (# = vs. GP-II), ($ = vs. GP-III), *p < 0.05, **p < 0.01; ***p < 0.001; ##p < 0.01; $p < 0.05. (C) Confocal microscopy in human peripheral blood mononuclear cells shows MitoSOX (red fluorescence) localization in the mitochondria, but not in the nucleus. Hoechst 33342 (blue fluorescence) was used for nuclear staining (magnification: 60×).
Figure 2
Figure 2
Mitochondrial membrane potential (MMP) and succinate dehydrogenase (SDH) activity in the study subjects. US-unstained (autofluoroscence) (A) representative dot-plot of MMP (B) bar diagram displaying percentage of cells with collapsed MMP (n = 20 each in all the four groups). The percentage of cells with collapsed MMP in type 2 diabetes mellitus (T2DM) patients is higher relative to controls as measured by the green fluorescence intensity (Q4). Increased JC-1 green fluorescence is indicative of mitochondrial membrane depolarization. (C) Bar diagram showing SDH enzymatic activity in control (GP-I); prediabetic subjects (GP-II); NDT2DM (GP-III); and ADT2DM patients (GP-IV). Values are expressed in median and interquartile range (n = 10). (* = vs. GP-I), (# = vs. GP-II), ($ = vs. GP-III), *p < 0.05, ***p < 0.001; #p < 0.05; ##p < 0.01; ###p < 0.001; $p < 0.01.
Figure 3
Figure 3
Depicts mRNA expression of mitophagy-related genes in the study subjects with varying degree of glycemic burden. Real-time qPCR analysis of (A) PINK1 (B) NIX (C) mitofusin2 (MFN2) (D) PARKIN (E) LC3-II (F) lysosome-associated membrane protein-2 (LAMP-2) in controls (GP-I); prediabetic subjects (GP-II); NDT2DM (GP-III); and ADT2DM patients (GP-IV). Values are expressed in median and interquartile range (n = 20). (* = vs. GP-I), (# = vs. GP-II), *p < 0.05; **p < 0.01; ***p < 0.001; #p < 0.05; ##p < 0.01; ###p < 0.001.
Figure 4
Figure 4
(A) Western blot analysis of mitophagy-related markers and quantification of western blots for protein expression of (B) PINK1 (C) NIX (D) mitofusin2 (MFN2) (E) PARKIN (F) LC3-II (G) lysosome-associated membrane protein-2 (LAMP-2) in controls (GP-I); prediabetic subjects (GP-II); NDT2DM (GP-III); and ADT2DM patients (GP-IV). Values are expressed in mean ± SD; (n = 10). (* = vs. GP-I), (# = vs. GP-II), ($ = vs. GP-III), *p < 0.05; **p < 0.01; ***p < 0.001; #p < 0.05; ##p < 0.01; ###p < 0.001, $p < 0.05.
Figure 5
Figure 5
Receiver operating characteristic (ROC) curve was plotted using sensitivity and specificity with area under the curve (AUC) (95% CI) (A) PINK1 (B) mitofusin2 (MFN2) (C) NIX (D) PARKIN (E) LC3-II (F) LAMP-2 transcriptional levels for predicting the HbA1C cutoff value crucial for the sustenance of mitophagy.
Figure 6
Figure 6
(A) Representative electron micrographs of mitochondria in the study subjects (Original magnification 10,000×, print magnification 49,400×@7.in 400 nm scale). White arrows represent mitochondria. The panels indicating (a) Controls (healthy and larger mitochondria) (GP-I); (b) Prediabetic subjects (healthy and larger mitochondria) (GP-II); (c) NDT2DM patients (GP-III), and (d) ADT2DM patients (GP-IV). Healthy mitochondria were characterized by oval or spherical shape, well-defined cristae and dense matrix, while mitochondria in type 2 diabetes mellitus (T2DM) subjects were smaller in size, rounded and with degenerated matrix (B) bar diagram displaying the total mitochondrial area per cell in all the study groups (C) bar graph represents the percentage of distorted mitochondria in controls (GP-I); prediabetic subjects (GP-II); NDT2DM patients (GP-III); ADT2DM patients, who were randomly selected with similar clinical and biochemical profile in each group (n = 3). Values are expressed in mean ± SD; (* = vs. GP-I) (# = vs. GP-II), *p < 0.05; **p < 0.01, ***p < 0.001; ##p < 0.01; ###p < 0.001.

References

    1. Fujimoto WY. The importance of insulin resistance in the pathogenesis of type 2 diabetes mellitus. Am J Med (2000) 108:9S–14S.10.1016/S0002-9343(00)00337-5 - DOI - PubMed
    1. Kahn SE. The importance of the beta cell in the pathogenesis of type 2 diabetes mellitus. Am J Med (2000) 108:2S–8S.10.1016/S0002-9343(00)00336-3 - DOI - PubMed
    1. Las G, Shirihai OS. The role of autophagy in β-cell lipotoxicity and type 2 diabetes. Diabetes Obes Metab (2010) 12(Suppl 2):15–9.10.1111/j.1463-1326.2010.01268.x - DOI - PMC - PubMed
    1. Marchetti P, Masini M. Autophagy and the pancreatic beta-cell in human type 2 diabetes. Autophagy (2009) 5:1055–6.10.4161/auto.5.7.9511 - DOI - PubMed
    1. Gonzalez CD, Lee MS, Marchetti P, Pietropaolo M, Towns R, Vaccaro MI, et al. The emerging role of autophagy in the pathophysiology of diabetes mellitus. Autophagy (2011) 7:2–11.10.4161/auto.7.1.13044 - DOI - PMC - PubMed

LinkOut - more resources