. 2017 Dec 18:8:2542.
doi: 10.3389/fmicb.2017.02542. eCollection 2017.

Production of HIV-1 vif mRNA Is Modulated by Natural Nucleotide Variations and SLSA1 RNA Structure in SA1D2prox Genomic Region

Affiliations

Production of HIV-1 vif mRNA Is Modulated by Natural Nucleotide Variations and SLSA1 RNA Structure in SA1D2prox Genomic Region

Masako Nomaguchi et al. Front Microbiol. .

Abstract

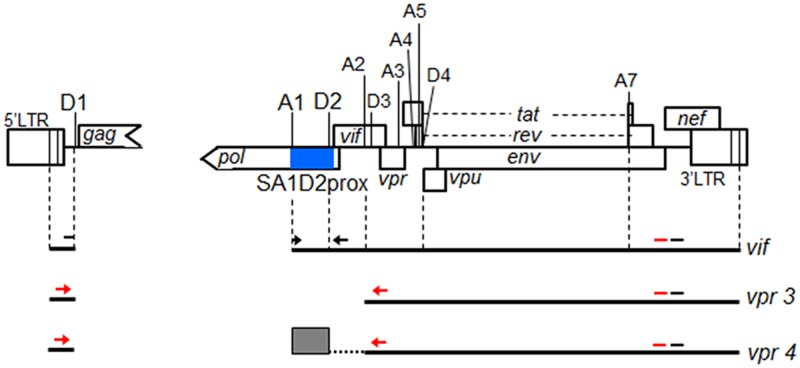
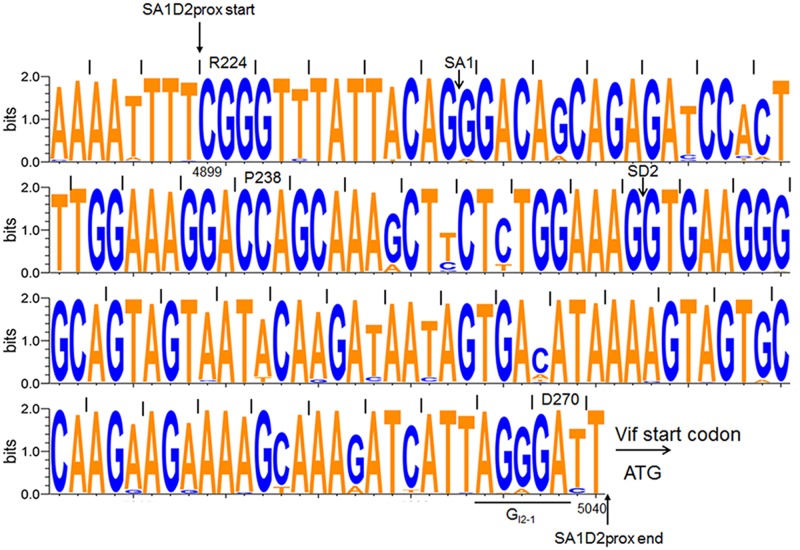
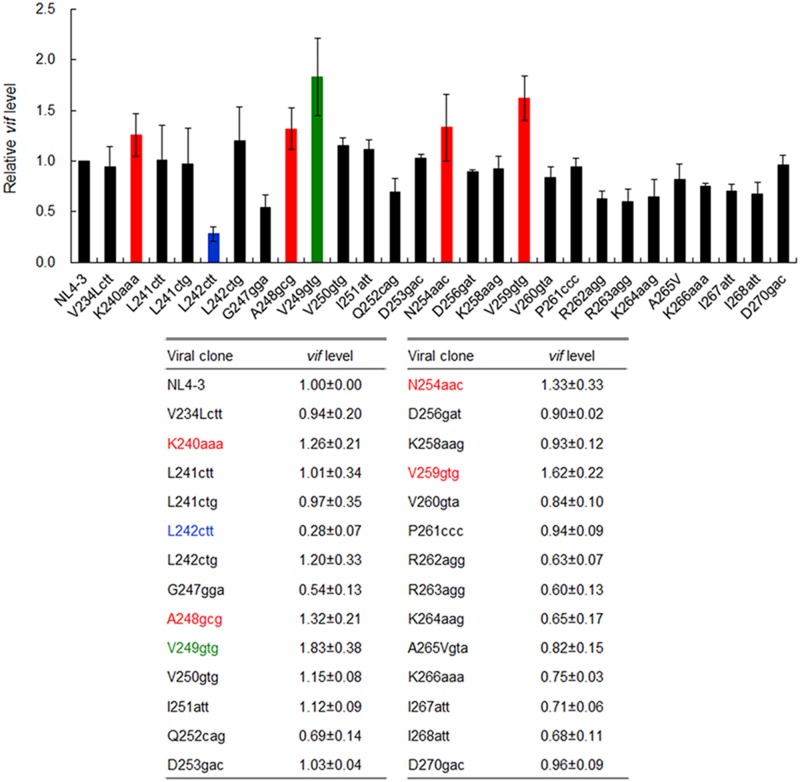
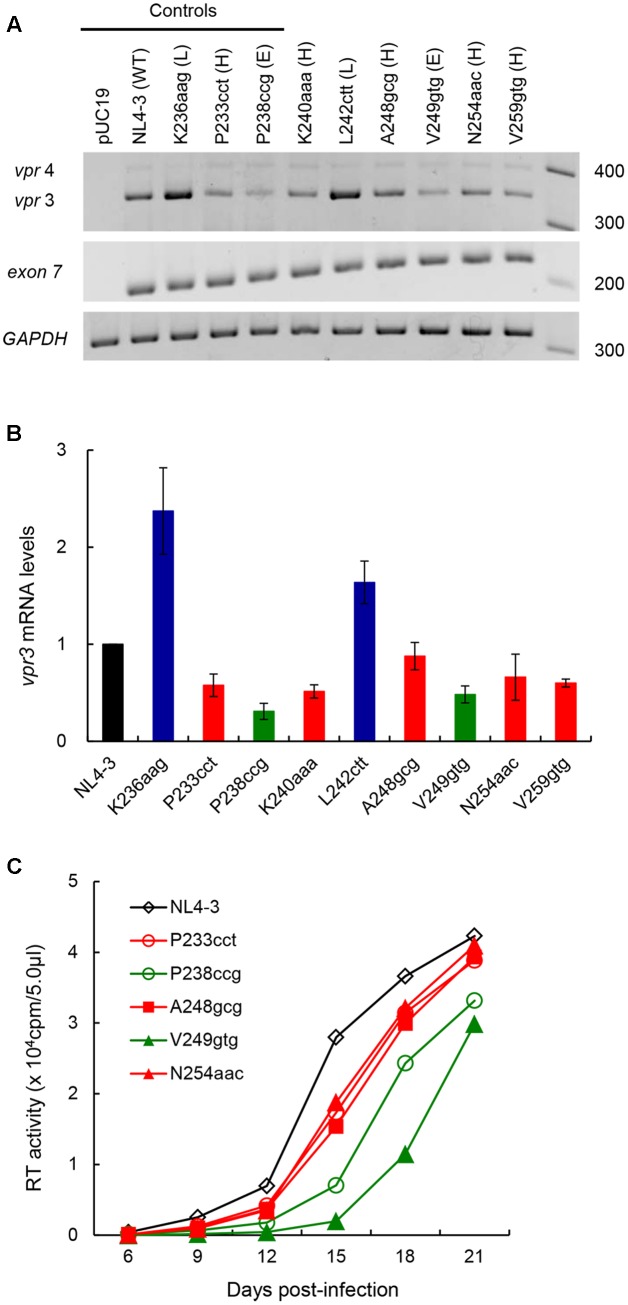
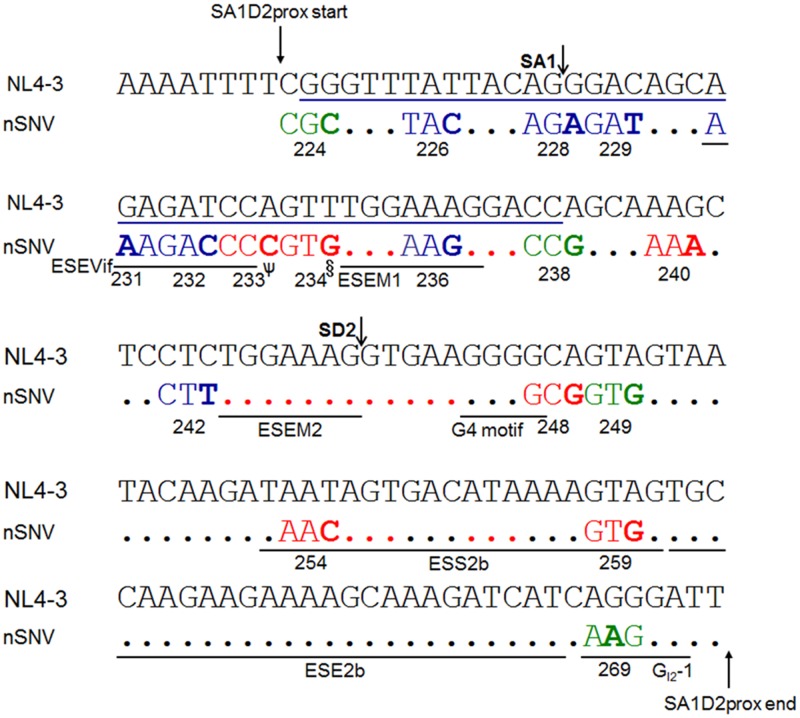
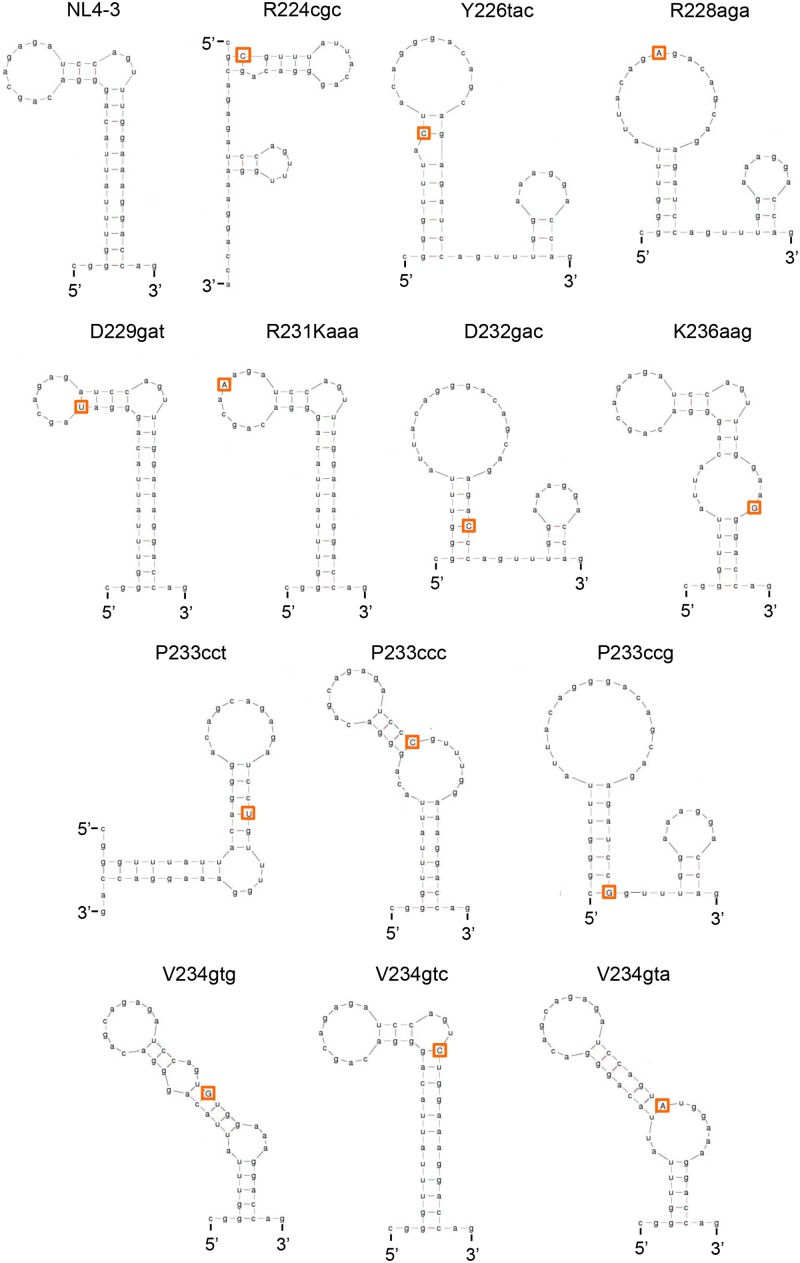
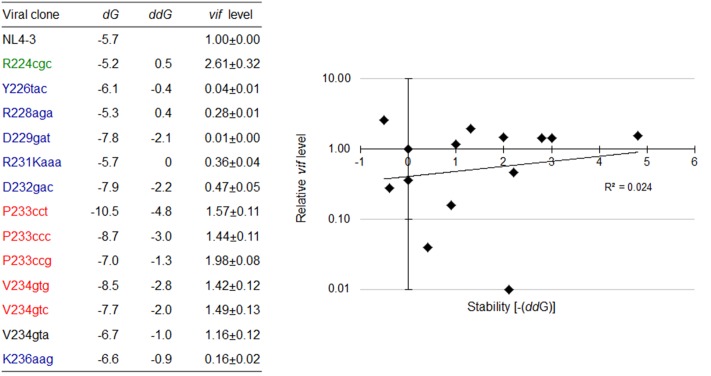
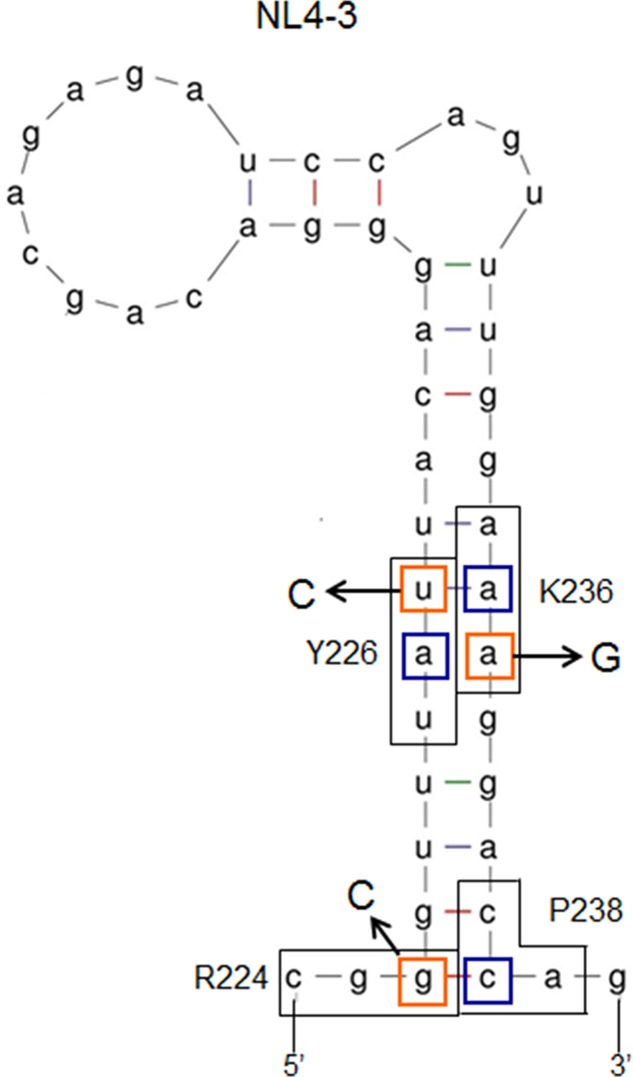
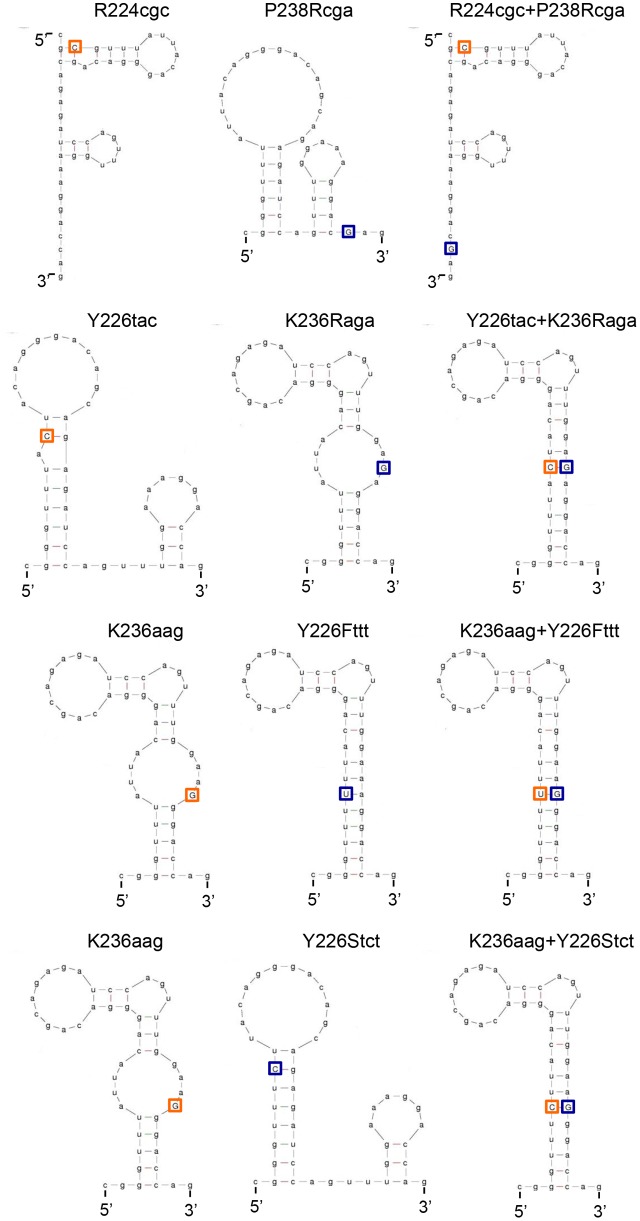
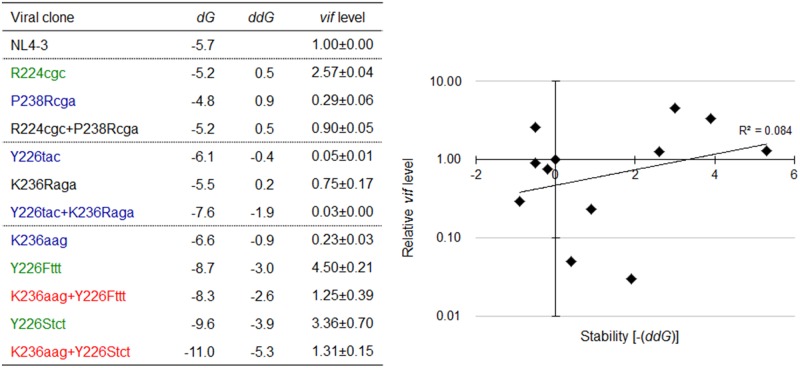
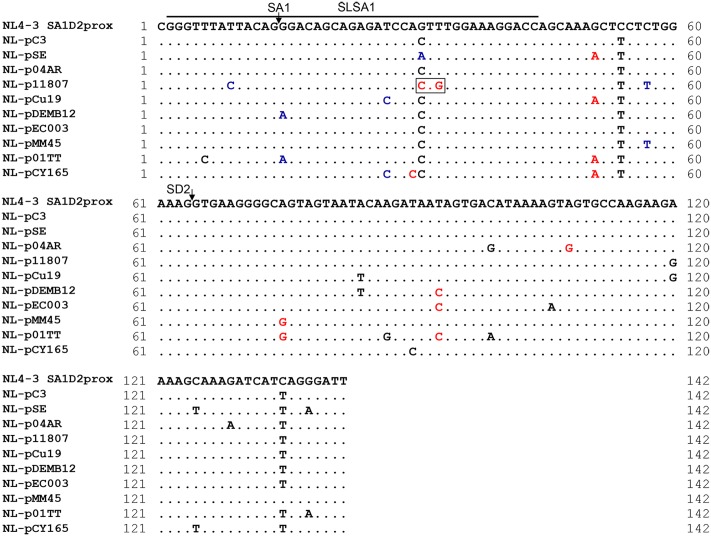
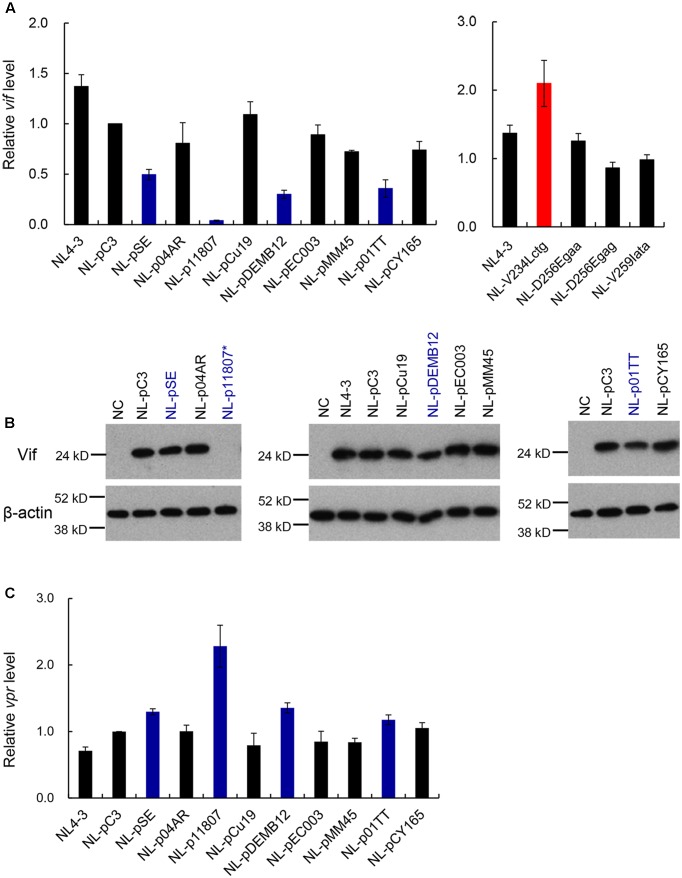
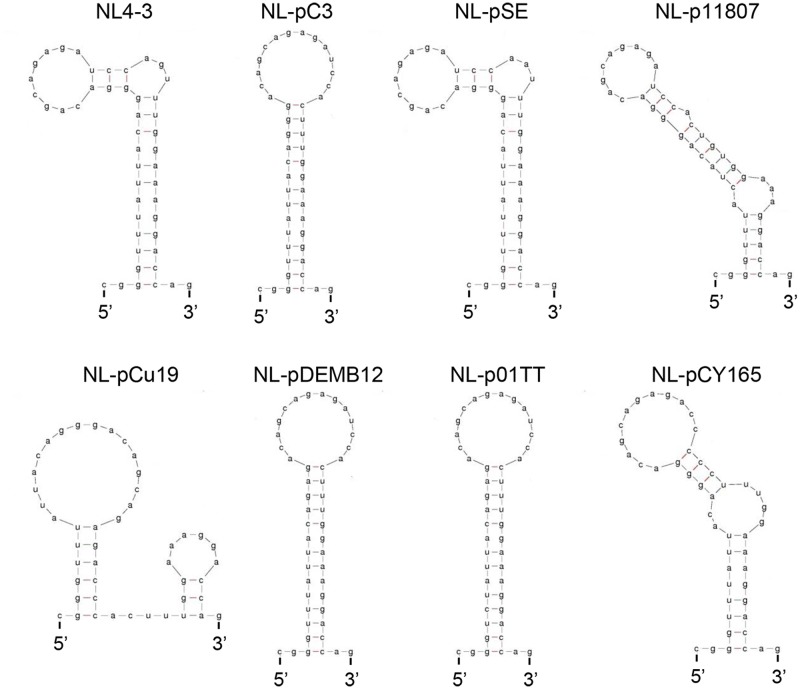
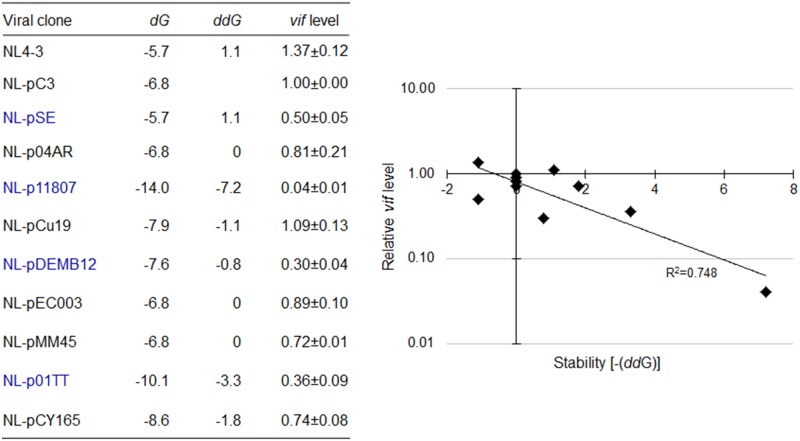
Genomic RNA of HIV-1 contains localized structures critical for viral replication. Its structural analysis has demonstrated a stem-loop structure, SLSA1, in a nearby region of HIV-1 genomic splicing acceptor 1 (SA1). We have previously shown that the expression level of vif mRNA is considerably altered by some natural single-nucleotide variations (nSNVs) clustering in SLSA1 structure. In this study, besides eleven nSNVs previously identified by us, we totally found nine new nSNVs in the SLSA1-containing sequence from SA1, splicing donor 2, and through to the start codon of Vif that significantly affect the vif mRNA level, and designated the sequence SA1D2prox (142 nucleotides for HIV-1 NL4-3). We then examined by extensive variant and mutagenesis analyses how SA1D2prox sequence and SLSA1 secondary structure are related to vif mRNA level. While the secondary structure and stability of SLSA1 was largely changed by nSNVs and artificial mutations introduced to restore the original NL4-3 form from altered ones by nSNVs, no clear association of the two SLSA1 properties with vif mRNA level was observed. In contrast, when naturally occurring SA1D2prox sequences that contain multiple nSNVs were examined, we attained significant inverse correlation between the vif level and SLSA1 stability. These results may suggest that SA1D2prox sequence adapts over time, and also that the altered SA1D2prox sequence, SLSA1 stability, and vif level are mutually related. In total, we show here that the entire SA1D2prox sequence and SLSA1 stability critically contribute to the modulation of vif mRNA level.

Keywords: HIV-1; SA1; SA1D2prox; SLSA1; nNSV; secondary RNA structure; vif mRNA.


Figures

FIGURE 1
FIGURE 1
Schematic representation of HIV-1 NL4-3 genome. Various splicing donor (SD) and splicing acceptor (SA) sites in HIV-1 genome are indicated. SA4b, a, c sites are omitted. A blue box indicates SA1D2prox. Black lines represent 4 kb mRNAs of vif and vpr, and exon2 generated by splicing at SA1 and SD2 is indicated by a gray box. Black arrows and black bars represent amplified regions by qRT-PCR of vif mRNA and all HIV-1 mRNAs, respectively. Regions amplified by semiquantitative PCR to analyze vpr mRNAs and all HIV-1 mRNAs are shown by red arrows and red bars, respectively.
FIGURE 2
FIGURE 2
Sequence alignment of SA1D2prox among HIV-1 subtype B viruses. Nucleotide sequence logo was created by WebLogo3 software (http://weblogo.threeplusone.com/create.cgi) (Schneider and Stephens, 1990; Crooks et al., 2004). Sequences (2885 sequences corresponding to nucleotides 4891–5040 of HIV-1 NL4-3) of HIV-1 subtype B were obtained from the HIV-1 sequence database (Los Alamos National Laboratory, http://www.hiv.lanl.gov/). Start and end positions of SA1D2prox region, SA1 and SD2 sites, the start codon for Vif, and a splicing regulatory element GI2-1 are indicated. Amino acids and their numbers of NL4-3 Pol-integrase are shown above the sequence. Numbers below the sequence represent nucleotide numbers of HIV-1 NL4-3.
FIGURE 3
FIGURE 3
Effects of nSNVs in SA1D2prox on vif expression. Proviral clones indicated were transfected into 293T cells, and at 20 h post-transfection, total RNAs were prepared. After DNase I-treatment, samples were subjected to qRT-PCR analysis by a specific primer set for vif transcript (Figure 1). For clones designated K240aaa, L242ctt, A248gcg, V249gtg, N254aac, and V259gtg, cDNA samples synthesized using DNase I-treated RNA and oligo (dT) primer were subjected to qRT-PCR analysis. Expression levels of all HIV-1 transcripts/mRNAs and GAPDH transcript/mRNA were analyzed by qRT-PCR in parallel as transfection and internal controls, respectively. A vif expression level in each sample was normalized by those of all HIV-1 transcript/mRNA species and GAPDH transcript/mRNA. Vif expression levels relative to that by NL4-3 are presented. Blue letters/bar, red letters/bars, and green letters/bar indicate low, high, and excessive vif types (Nomaguchi et al., 2016), respectively. Mean values ± SD from four independent experiments are shown.
FIGURE 4
FIGURE 4
Effects of vif-affecting nSNVs on vpr expression and virus replication. (A) Vpr expression pattern. Semiquantitative PCR was carried out using a specific primer set for vpr mRNAs (Figure 1), and cDNA samples were prepared as described in Figure 3. NL4-3 and K236aag/P233cct/P238ccg clones were used as a parental clone and as standard control clones for low (L)/high (H)/excessive (E) vif types (Nomaguchi et al., 2016), respectively. Expression levels of all HIV-1 mRNA species (exon7) and GAPDH mRNA were analyzed by semiquantitative PCR in parallel as transfection and internal controls, respectively. RNA size markers in nucleotides are indicated on the right. Representative data from four independent experiments are shown. (B) Quantification of vpr expression level. Signal intensities of semiquantitative RT-PCR products were quantitated by Amersham Imager 600 instrument. Intensity of vpr3 mRNA in each sample was normalized by those of all HIV-1 mRNA species (exon 7) and GAPDH mRNA. Normalized mRNA intensity in each sample relative to that of NL4-3 is presented. Mean values ± SD from four independent experiments are shown. (C) Viral growth kinetics in CEM-SS cells. Viruses were prepared from 293T cells transfected with proviral clones indicated, and equal units of reverse transcriptase activity (104) were inoculated into CEM-SS cells (105). Virus replication was monitored by reverse transcriptase activity released into the culture supernatants. The results shown were reproduced in another independent experiment.
FIGURE 5
FIGURE 5
Locations of nSNVs in SA1D2prox sequence (nucleotides 4899-5040 of HIV-1 NL4-3) that significantly alter vif expression level. Numbers below the sequences represent amino acid positions of HIV-1 NL4-3 Pol-integrase. SA1/SD2 sites and reported splicing regulatory elements (ESEVif, ESE-M1, ESE-M2, G4 motif, ESS2b, ESE2b, and GI2-1 in Kammler et al., 2006; Exline et al., 2008; Mandal et al., 2009; Widera et al., 2013; Brillen et al., 2017) are shown. A blue line indicates the SLSA1 region. The nSNVs that significantly alter vif expression level are shown by colored and bold letters. Blue/red/green letters indicate low/high/excessive vif types (Nomaguchi et al., 2016), respectively. Red dots show the sites for which no proviral clones for analysis were constructed, because the sequences are highly conserved among HIV-1 subtype B strains. Black dots represent the sites for which proviral clones were constructed and analyzed, but nSNVs there were found to affect vif production only modestly. ψ, G, and T variants are also high vif type. §, C variant is also high vif type.
FIGURE 6
FIGURE 6
Changes in SLSA1 RNA secondary structure by nSNVs within SLSA1. Various nSNVs analyzed are indicated by orange-boxed capital letters. Secondary RNA structure for the SLSA1 sequence carrying an nSNV was predicted by mfold program (Zuker, 2003).
FIGURE 7
FIGURE 7
Changes in vif expression level and SLSA1 RNA stability by nSNVs within SLSA1. Free energy (dG) for the SLSA1 sequence carrying an nSNV was predicted by mfold program (Zuker, 2003). RNA stability (ddG) is presented as difference of free energy between each nSNV and NL4-3. For determination of vif production level, proviral clones indicated were transfected into 293T cells, and at 20 h post-transfection, DNase I-treated total RNAs were prepared. After synthesis of cDNA using DNase I-treated RNA and oligo (dT) primer, samples were subjected to qRT-PCR analysis using a specific primer set for vif mRNA. Expression levels of all HIV-1 mRNA species and GAPDH mRNA were analyzed by qRT-PCR in parallel for transfection and internal controls, respectively. A vif expression level in each sample was normalized by those of all HIV-1 mRNA species and GAPDH mRNA. Vif expression levels relative to that by NL4-3 are presented. Mean values ± SD from three independent experiments are shown. Scatter diagram on the right was created by plotting vif expression levels and SLSA1 stabilities [–(ddG)] of variant clones with nSNVs relative to those of NL4-3. Exponential trendline and coefficient of determination (R2 = 0.024, p = 0.549 by F-test) are shown. Blue, red, and green letters indicate low, high, and excessive vif types (Nomaguchi et al., 2016), respectively. In this figure, the data of relative vif expression levels in our previous report (Nomaguchi et al., 2016) were used for clones R224cgc, Y226tac, R228aga, D229gat, R231Kaaa, D232gac, and K236aag for easy comparison.
FIGURE 8
FIGURE 8
Secondary RNA structure of HIV-1 NL4-3 SLSA1. Secondary RNA structure of NL4-3 SLSA1 was predicted by mfold program (Zuker, 2003). In the structure, amino acid sites R224/Y226/K236/P238 of NL4-3 Pol-integrase, the corresponding codons (black-boxed), nucleotide sites analyzed (orange-boxed), and the complementary mutations (blue-boxed) are shown. Nucleotide substitutions are also shown by arrows.
FIGURE 9
FIGURE 9
Predicted secondary RNA structures of SLSA1 structural mutants. Secondary RNA structures of the SLSA1 mutants were predicted by mfold program (Zuker, 2003). In the structures of SLSA1 variants, their nSNVs analyzed are indicated by orange-boxed capital letters. Complementary mutations to the nSNVs are indicated by blue-boxed capital letters.
FIGURE 10
FIGURE 10
Relationship between the vif expression level and SLSA1 RNA stability. SLSA1 variants in Figure 9 were analyzed for vif expressions and SLSA1 stabilities. Free energy (dG) for each SLSA1 RNA is predicted by mfold program (Zuker, 2003). Stability (ddG) of SLSA1 RNA structure is presented as difference of free energy between mutants and NL4-3. For determination of vif production level, proviral clones indicated were transfected into 293T cells, and total RNA was prepared from cells collected at 20 h post-transfection. DNase I-treated RNAs were used for cDNA synthesis with oligo (dT) primer, and resultant cDNA samples were subjected to qRT-PCR analysis using a specific primer set for vif mRNA. Expression levels of all HIV-1 mRNA species and GAPDH mRNA were analyzed by qRT-PCR in parallel for transfection and internal controls, respectively. A vif expression level in each sample was normalized by those of all HIV-1 mRNA species and GAPDH mRNA. Vif expression levels relative to those by NL4-3 are presented. Mean values ± SD from three independent experiments are shown. Scatter diagram on the right was created by plotting vif expression levels and SLSA1 stabilities [–(ddG)] of the test clones relative to those of NL4-3. Exponential trendline and coefficient of determination (R2 = 0.084, p = 0.161 by F-test) are shown. Blue, red, and green letters indicate low, high, and excessive vif types (Nomaguchi et al., 2016), respectively.
FIGURE 11
FIGURE 11
Naturally occurring full-length SA1D2prox sequences analyzed in this study. Full-length SA1D2prox sequences derived from viral strains in the HIV-1 subtype B population are shown. NL-pC3 represents a consensus sequence of SA1D2prox in HIV-1 subtype B strains. SLSA1 region and SA1/SD2 sites are indicated. Blue and red letters show nSNVs that, upon introduction into NL4-3, phenotypically change it to the low and high vif types (Nomaguchi et al., 2016), respectively. The nSNVs that moderately affect vif expression level are indicated by black letters (vif levels were from 0.5 to 1.2 relative to that by NL4-3). V234Lctg site is boxed. This variation contains two and one nucleotide substitutions relative to NL4-3 and NL-pC3, respectively.
FIGURE 12
FIGURE 12
Characterization of proviral clones with a naturally occurring full-length SA1D2prox sequence. Various proviral clones were examined for vif mRNA production, Vif expression, and vpr mRNA production. (A) Expression levels of vif mRNAs by various variants. Proviral clones indicated were transfected into 293T cells, and at 20 h post-transfection, cells were collected for extraction of total RNA. DNase I-treated total RNAs were used to synthesize cDNAs with oligo (dT) primer, and the cDNA samples were subjected to qRT-PCR analysis using a specific primer set of vif mRNA. Expression levels of all HIV-1 mRNA species and GAPDH mRNA were analyzed by qRT-PCR in parallel for transfection and internal controls, respectively. A vif expression level in each sample was normalized by those of all HIV-1 mRNA species and GAPDH mRNA. Vif expression levels relative to that by NL-pC3 are presented. Blue and red bars indicate clones that exhibit lower and higher vif expression levels, respectively, relative to that by NL-pC3. Mean values ± SD from three independent experiments are shown. All clones were simultaneously assayed for vif production, but results obtained are separately shown for clarity. (B) Expression of Vif proteins by various variants. 293T cells were transfected with proviral clones indicated. On day 1 post-transfection, cell lysates were prepared, and analyzed by Western blotting using anti-Vif and anti-β-actin antibodies. Migration positions of mass standards are shown on the left. Representative data from at least two independent experiments are shown. Blue letters indicate clones that exhibit lower vif expression level relative to that by NL-pC3. NL-p11807, undetectable. (C) Expression levels of vpr3 mRNA by various variants. Semiquantitative PCR was carried out using cDNA samples prepared as described in (A) and a specific primer set for vpr mRNAs. Expression levels of all HIV-1 mRNA species and GAPDH mRNA were analyzed by semiquantitative PCR in parallel for transfection and internal controls, respectively. Signal intensities of semiquantitative RT-PCR products were quantitated by Amersham Imager 600 instrument. Intensity of vpr3 mRNA in each sample was normalized by those of all HIV-1 mRNA species and GAPDH mRNA. Normalized mRNA intensity in each sample relative to that by NL-pC3 is presented. Blue bars show clones with decreased vif expression level relative to NL-pC3. Mean values ± SD from three independent experiments are shown.
FIGURE 13
FIGURE 13
Secondary RNA structures of SLSA1 in naturally occurring full-length SA1D2prox sequences. RNA structural shapes predicted by mfold program (Zuker, 2003) are shown for viral clones in Figure 11.
FIGURE 14
FIGURE 14
Relationship between vif mRNA production and SLSA1 RNA stability for clones carrying naturally occurring full-length SA1D2prox sequences. Free energy (dG) for SLSA1 sequence derived from proviral clones indicated were predicted by mfold program (Zuker, 2003). RNA stability (ddG) is presented as difference of free energy between NL4-3/each nSNV and NL-pC3. Relative vif expression levels to that by NL-pC3 in Figure 12 were used. Blue letters indicate clones that gave vif expression levels significantly lower than that by NL-pC3. Scatter diagram on the right was created by plotting vif expression levels and SLSA1 stabilities [–(ddG)] of the clones relative to those of NL-pC3. Exponential trendline and coefficient of determination (R2 = 0.748, p = 0.019 by F-test) are shown.

Similar articles

Cited by

References

    1. Abbink T. E., Berkhout B. (2008). RNA structure modulates splicing efficiency at the human immunodeficiency virus type 1 major splice donor. J. Virol. 82 3090–3098. 10.1128/JVI.01479-07 - DOI - PMC - PubMed
    1. Adachi A., Gendelman H. E., Koenig S., Folks T., Willey R., Rabson A., et al. (1986). Production of acquired immunodeficiency syndrome-associated retrovirus in human and nonhuman cells transfected with an infectious molecular clone. J. Virol. 59 284–291. - PMC - PubMed
    1. Akari H., Fujita M., Kao S., Khan M. A., Shehu-Xhilaga M., Adachi A., et al. (2004). High level expression of human immunodeficiency virus type-1 Vif inhibits viral infectivity by modulating proteolytic processing of the Gag precursor at the p2/nucleocapsid processing site. J. Biol. Chem. 279 12355–12362. 10.1074/jbc.M312426200 - DOI - PubMed
    1. Akari H., Uchiyama T., Fukumori T., Iida S., Koyama A. H., Adachi A. (1999). Pseudotyping human immunodeficiency virus type 1 by vesicular stomatitis virus G protein does not reduce the cell-dependent requirement of Vif for optimal infectivity: functional difference between Vif and Nef. J. Gen. Virol. 80 (Pt 11), 2945–2949. 10.1099/0022-1317-80-11-2945 - DOI - PubMed
    1. Amendt B. A., Si Z. H., Stoltzfus C. M. (1995). Presence of exon splicing silencers within human immunodeficiency virus type 1 tat exon 2 and tat-rev exon 3: evidence for inhibition mediated by cellular factors. Mol. Cell. Biol. 15 4606–4615. 10.1128/MCB.15.8.4606 - DOI - PMC - PubMed

LinkOut - more resources