

doi: 10.1002/ajh.25036.
Epub 2018 Feb 5.
Urinary orosomucoid is associated with progressive chronic kidney disease stage in patients with sickle cell anemia
Affiliations
- PMID: 29327376
- PMCID: PMC6312193
- DOI: 10.1002/ajh.25036
Item in Clipboard
Urinary orosomucoid is associated with progressive chronic kidney disease stage in patients with sickle cell anemia
Am J Hematol.
2018 Aug.
No abstract available
Figures
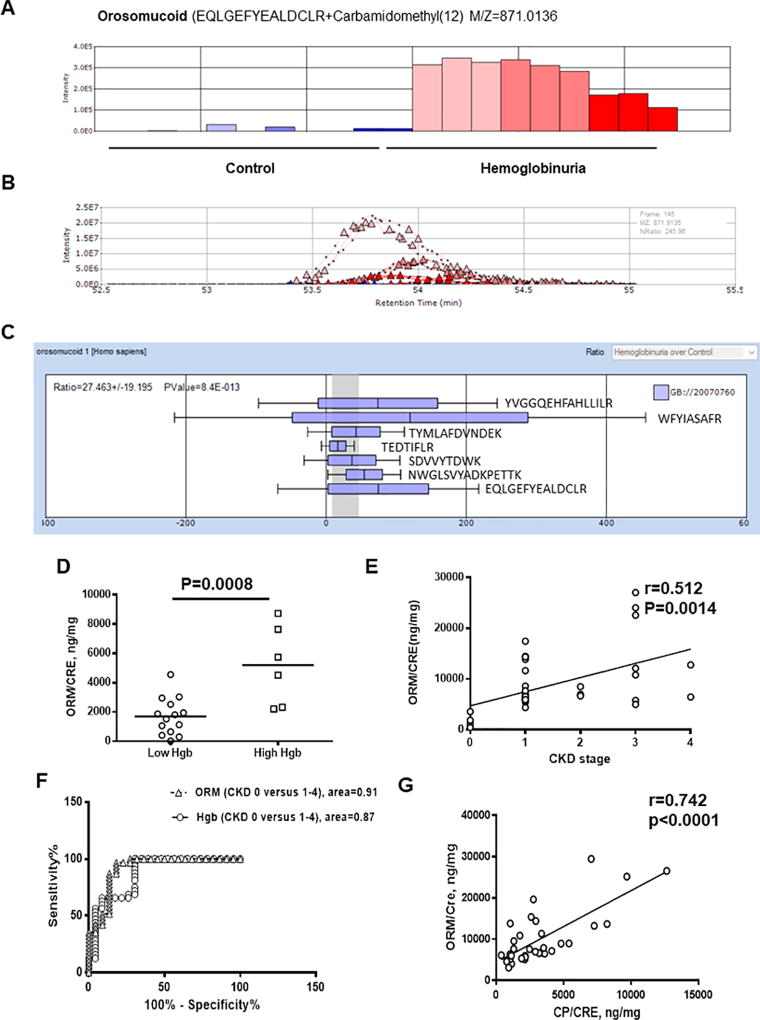
(A–B). Label-free quantitative analysis of ORM in urine. High resolution MS spectra produced by Orbitrap MS scans were quantified by SIEVE 2.1 software. Panel A shows average intensities for EQLGEFYEALDCLR peptide are derived from integration of ion elution profiles shown in panel ORM levels detected in the samples with hemoglobinuria are shown in red colors, and in control samples – in blue colors. Panel B shows ion elution profiles for ORM peptide. Triangles indicate the time points at which MS/MS was conducted. (C). Average intensities for seven ORM peptides detected in urine samples and calculated by SIEVE 2.1. Mean and standard deviations are shown. Peptides sequences are indicated. (D) Quantification of urinary orosomucoid (ORM) performed by ELISA for 20 samples with undetected proteinuria. ORM to creatinine (CP/CRE) ratio is shown. Means are shown. Each dot represents a value obtained from individual subject. (E) Correlation analysis of ORM/CRE ratios with stages of CKD. Pearson correlation analysis was performed using GraphPad software in 34 SCD patients with different stages of CKD (0–4). (F) ROC analysis of urinary ORM/CRE and Hgb/CRE shown for urine samples from SCD patients with stage 0 CKD (23 patients) versus stage 1–4 CKD (31 patients). The analysis was performed using GraphPad software. (G) Correlation analysis of urinary ceruloplasmin (CP/CRE) and ORM/CRE ratios are shown. CP levels were measured by ELISA. Pearson correlation analysis was performed using GraphPad software.
References
-
- Jiang H, Guan G, Zhang R, et al. Increased urinary excretion of orosomucoid is a risk predictor of diabetic nephropathy. Nephrology. 2009;14:332–337. - PubMed
-
- Watson L, Midgley A, Pilkington C, et al. Urinary monocyte chemoattractant protein 1 and alpha 1 acid glycoprotein as biomarkers of renal disease activity in juvenile-onset systemic lupus erythematosus. Lupus. 2012;21:496–501. - PubMed
Publication types
MeSH terms
Substances
Grants and funding
LinkOut - more resources
Full Text Sources
Other Literature Sources
Medical