. 2018 May 1;197(9):1164-1176.
doi: 10.1164/rccm.201703-0660OC.

Blockade of the Complement C5a/C5aR1 Axis Impairs Lung Cancer Bone Metastasis by CXCL16-mediated Effects

Affiliations

Blockade of the Complement C5a/C5aR1 Axis Impairs Lung Cancer Bone Metastasis by CXCL16-mediated Effects

Daniel Ajona et al. Am J Respir Crit Care Med. .

Abstract

Rationale: C5aR1 (CD88), a receptor for complement anaphylatoxin C5a, is a potent immune mediator. Its impact on malignant growth and dissemination of non-small cell lung cancer cells is poorly understood.

Objectives: To investigate the contribution of the C5a/C5aR1 axis to the malignant phenotype of non-small cell lung cancer cells, particularly in skeletal colonization, a preferential lung metastasis site.

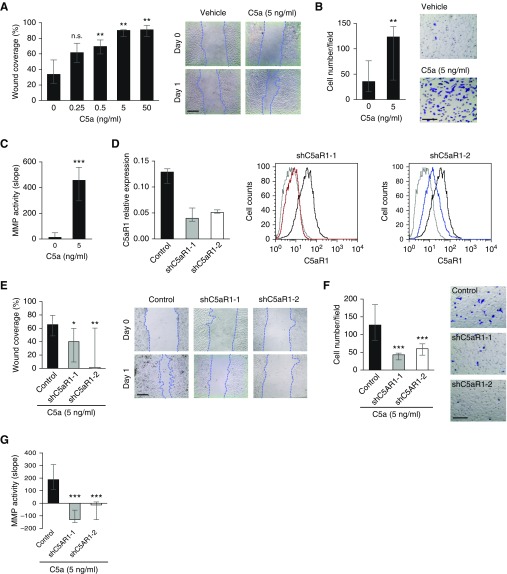
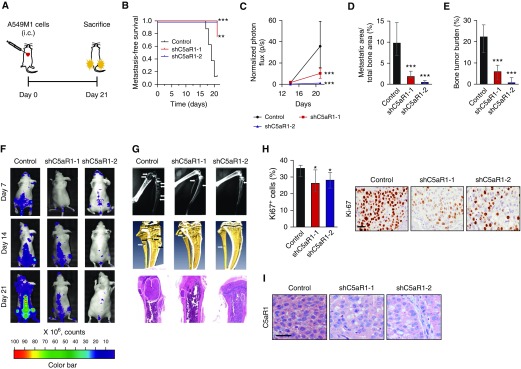
Methods: Association between C5aR1 expression and clinical outcome was assessed in silico and validated by immunohistochemistry. Functional significance was evaluated by lentiviral gene silencing and ligand l-aptamer inhibition in in vivo models of lung cancer bone metastasis. In vitro functional assays for signaling, migration, invasion, metalloprotease activity, and osteoclastogenesis were also performed.

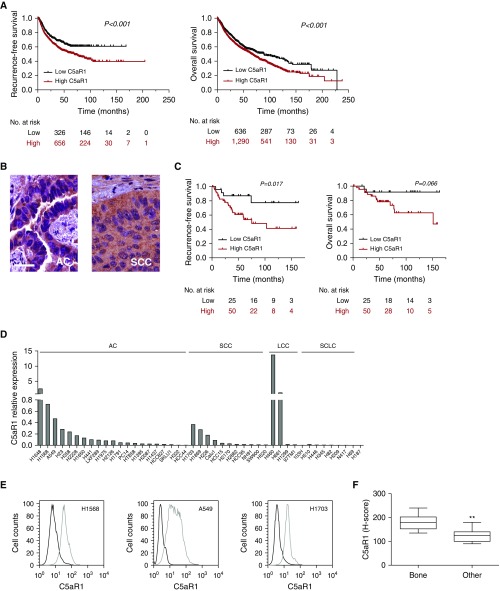
Measurements and main results: High levels of C5aR1 in human lung tumors were significantly associated with shorter recurrence-free survival, overall survival, and bone metastasis. Silencing of C5aR1 in lung cancer cells led to a substantial reduction in skeletal metastatic burden and osteolysis in in vivo models. Furthermore, metalloproteolytic, migratory, and invasive tumor cell activities were modulated in vitro by C5aR1 stimulation or gene silencing. l-Aptamer blockade or C5aR1 silencing significantly reduced the osseous metastatic activity of lung cancer cells in vivo. This effect was associated with decreased osteoclastogenic activity in vitro and was rescued by the exogenous addition of the chemokine CXCL16.

Conclusions: Disruption of C5aR1 signaling in lung cancer cells abrogates their tumor-associated osteoclastogenic activity, impairing osseous colonization. This study unveils the role played by the C5a/C5aR1 axis in lung cancer dissemination and supports its potential use as a novel therapeutic target.

Keywords: anaphylatoxin; aptamer; chemokine; complement; osteoclastogensesis.


Figures

Figure 1.
Figure 1.
Expression of C5aR1 in lung cancer cells. (A) In silico analysis of the prognostic value of C5aR1 mRNA expression using Kaplan-Meier Plotter (www.kmplot.com). Patients were stratified into two groups according to the first tercile (Affy ID: 220088_at). Differences between groups were evaluated using the log-rank test. (B) Representative images of C5aR1 immunostaining in human lung adenocarcinoma and squamous cell carcinoma. Scale bar = 30 μm. (C) Kaplan-Meier survival curves for high and low tumor C5aR1 levels assessed by immunohistochemistry in 75 patients with non–small cell lung cancer. Patients were stratified into two groups according to the first tercile, and differences between groups were evaluated using the log-rank test. (D) C5aR1 mRNA expression in a panel of 45 lung cancer cell lines determined by real-time PCR (IPO8 was used as the reference gene). (E) C5aR1 cell membrane expression assessed by flow cytometry in H1568, A549, and H1703 lung cancer cell lines. Incubation of cells without the primary antibody was used as negative control (dark line). (F) Immunohistochemical analysis of C5aR1 in primary tumors from nine patients with resectable non–small cell lung cancer who developed (at relapse) bone metastases (Bone) and 11 patients with extraskeletal metastases (Other). Data are presented as minimum to maximum box-and-whisker plots. **P < 0.01. AC = adenocarcinoma; C5aR1 = receptor 1 for cleaved complement component of C5; LCC = large cell carcinoma; SCC = squamous cell carcinoma; SCLC = small cell lung cancer.
Figure 2.
Figure 2.
Role of C5a/C5aR1 in migration, invasion, and tumor-associated matrix metalloproteinase (MMP) activity. (A) Scratch wound healing assay after incubation of A549 cells with recombinant C5a. The percentage of the area covered by migrated cells (wound coverage) was calculated. (B) Invasion assay of A549 cells after treatment with recombinant C5a. Cells were counted in four independent fields of the bottom side of the Boyden chamber after crystal violet staining. (C) MMP activity in the serum-free conditioned medium of A549 cells after treatment with recombinant C5a. MMP activity was assessed by digestion of a fluorogenic substrate. (D) Left: Gene expression levels of C5aR1 were silenced in A549M1 lung cancer cells using two lentiviral transduced shRNAs targeting two different sequences (shC5aR1-1 and shC5aR1-2). Scrambled shRNA-transduced cells were used as control. IPO8 was used as the reference gene. Right: Flow cytometry analysis of the membrane expression of C5aR1 in shC5aR1-1 (red line), shC5aR1–2 (blue line), and scrambled shRNA (black line)-transduced cells. Incubation without primary antibody was used as negative control (gray line). (E) Scratch wound healing assay of C5aR1-silenced cells (shC5aR1-1 and shC5aR1-2) and control cells after treatment with recombinant C5a. (F) Invasion assay of C5aR1-silenced and control cells after treatment with recombinant C5a. (G) MMP activity in the serum-free conditioned medium of C5aR1-silenced and control cells after treatment with recombinant C5a. Data in this figure are presented as medians and interquartile ranges. Results in A–C and E–G correspond to three independent experiments. Differences between treatments were analyzed with the Mann-Whitney U test. Scales bars in representative images, 100 μm; applies to all. *P < 0.05; **P < 0.01; ***P < 0.001. C5a = cleaved complement component of C5; C5aR1 = receptor 1 for C5a; n.s. = non-significant; shC5aR1-1 = short hairpin–mediated silencing of C5aR1 gene expression, using shRNA-1; shC5aR1-2 = short hairpin–mediated silencing of C5aR1 gene expression, using shRNA-2.
Figure 3.
Figure 3.
Effects of C5aR1 knockdown in A549M1 bone metastasis in vivo. (A) Schematic outline of the experiment. (B) Kaplan-Meier curves of metastasis-free survival after intracardiac inoculation of control, shC5aR1-1 or shC5aR1-2 A549M1 cells (eight mice per group). Signs of morbidity (cachexia or reduced mobility) were used as the endpoint for metastasis-free survival. Differences between groups were evaluated using the log-rank test. (C) Bioluminescence imaging quantification in hindlimbs. (D) X-ray image analysis of metastatic area in hindlimbs on Day 21. (E) Hindlimbs tumor burden assessment by hematoxylin and eosin staining in histologic sections (Day 21). (F) Representative images of bioluminescence imaging. (G) Representative X-ray images (top row), microcomputed tomography scans (middle row), and hematoxylin and eosin–stained histologic sections (bottom row) (Day 21). (H) Left: quantitative analysis of the percentage of Ki-67+ tumor cells. Right: representative Ki-67 immunostaining in metastatic lesions from C5aR1-silenced and control hindlimbs. (I) Representative human C5aR1 immunostaining in metastatic lesions from C5aR1-silenced and control hindlimbs. Scale bar = 30 μm; applies to all images. Data are presented as medians and interquartile ranges. Differences among experimental groups were analyzed using the Mann-Whitney U test. *P < 0.05; **P < 0.01; ***P < 0.001. C5aR1 = receptor 1 for cleaved complement component of C5; i.c. = intracardiac inoculation; shC5aR1-1 = short hairpin–mediated silencing of C5aR1 gene expression, using shRNA-1; shC5aR1-2 = short hairpin–mediated silencing of C5aR1 gene expression, using shRNA-2.
Figure 4.
Figure 4.
Abrogation of lung cancer osseous colonization by silencing C5aR1 levels. (A) Experimental regimen of bone colonization assay after tumor cell injection into the tibiae. (B) Quantification of bioluminescence imaging in control and shC5aR1-transduced cells (five to eight mice per group). (C) Assessment of tumor burden in hindlimbs of animals inoculated with shC5aR1 or control cells by X-ray image analysis at Day 20. (D) Histologic tumor burden analysis in hematoxylin and eosin–stained sections evaluated by image analysis (Day 20). (E) Representative images of X-rays (top row), microcomputed tomography (middle row), and hematoxylin and eosin staining (bottom row) (Day 20); arrows indicate osteolytic lesions. (F) Quantitative analysis and representative images of proliferation measured as the percentage of Ki-67+ tumor cells per total tumor area. Scale bar = 30 μm; applies to all. (G) Left: Number of osteoclasts at tumor-bone interface. Right: Representative images; scale bar as in F. Arrowheads show osteoclasts. Data are presented as medians and interquartile ranges. Differences among experimental groups were analyzed using the Mann-Whitney U test. *P < 0.05; **P < 0.01; ***P < 0.001. B = bone; C5aR1 = receptor 1 for cleaved complement component of C5; i.t. = intratibial; shC5aR1-1 = short hairpin–mediated silencing of C5aR1 gene expression, using shRNA-1; shC5aR1-2 = short hairpin–mediated silencing of C5aR1 gene expression, using shRNA-2; T = tumor; TRAP = tartrate-resistant acid phosphatase.
Figure 5.
Figure 5.
Effect of blocking C5a on bone metastasis formation of A549M1 cells. (A) Experimental regimen for the treatment of A549M1-injected mice with 10 mg/kg intraperitoneally of the anti-C5a l-aptamer AON-D21 (n = 7) or the control aptamer revAON-D21 (n = 8). (B) Quantification of BLI in hindlimbs 26 days after intracardiac inoculation. (C) Quantification of metastatic area by X-ray imaging. (D) Tumor burden assessed in hematoxylin and eosin–stained sections (Day 26). (E) Representative images of bioluminescence imaging (Day 26). (F) Representative X-ray images (top row), microcomputed tomography scans (middle row), and hematoxylin and eosin–stained histologic sections (bottom row) of each group (Day 26); arrows indicate osteolytic lesions. Data are presented as medians and interquartile ranges. Differences among experimental groups were analyzed using the Mann-Whitney U test. *P < 0.05; ***P < 0.001. C5a = cleaved complement component of C5; i.c. = intracardiac.
Figure 6.
Figure 6.
Knockdown of C5aR1 or C5 decreases CXCL16 and osteoclastogenesis. (A) CXCL16 mRNA levels were assessed in parental and knockdown (shC5aR1-1 and -2) A549M1 cells by real-time PCR (left), and secreted levels of CXCL16 were quantified by ELISA in the supernatant from serum-free cultures after 24 hours (right). (B) C5 and CXCL16 expression levels were assessed by real-time PCR in A549M1 cells after transfection with two independent C5-siRNAs (siC5-1 and -2). (C) Left: Conditioned media derived from A549M1 cells transduced with control or shC5aR1 cocultured with ST2 cells were collected and incubated with murine bone marrow mononuclear cells for 6 days in the presence of macrophage colony–stimulating factor (20 ng/ml) and RANKL (15 ng/ml). This experiment was performed four times with similar results. Right: Representative images of osteoclasts (scale bar, 200 μm; applies to all). (D) Murine bone marrow mononuclear cells were incubated for 6 days in the presence of macrophage colony–stimulating factor (20 ng/ml), RANKL (15 ng/ml), and different doses of CXCL16. Right: Representative images of osteoclasts (scale bar, 200 μm; applies to all). This experiment was performed twice with similar results. (E) Conditioned medium derived from A549M1 cells transduced with control or shC5aR1 cocultured with ST2 cells were collected, supplemented, or not with 100 pg/ml of recombinant CXCL16, and incubated with murine bone marrow mononuclear cells for 6 days in the presence of macrophage colony–stimulating factor (20 ng/ml) and RANKL (15 ng/ml). Right: Representative images of osteoclasts (scale bar, 200 μm; applies to all). (F) Schematic model summarizing that C5a activation from C5 binds to C5aR1 in non–small cell lung cancer cells and triggers p42/44 MAPK phosphorylation and nuclear factor-κB translocation. Intracellular C5a also contributes to C5aR1 signaling. This C5a/C5aR1 axis triggers the secretion of osteoclastogenic factors, which promote bone metastasis by enhancing tumor cell migration, invasion, bone matrix degradation, and CXCL16-mediated osteoclastogenesis. Data are presented as medians and interquartile ranges. **P < 0.01; ***P < 0.001. C5a = cleaved complement component of C5; C5aR1 = receptor 1 for C5a; CM = conditioned media; CXCL16 = chemokine (C-X-C) motif ligand 16; EM = extracellular matrix; MAPK = mitogen-activated protein kinase; MCP = monocyte chemotactic protein; NF-κB = nuclear factor-κB; NSCLC = non–small cell lung cancer; RANKL = receptor activator of nuclear factor κB ligand; shC5aR1-1 = short hairpin–mediated silencing of C5aR1 gene expression, using shRNA-1; shC5aR1-2 = short hairpin–mediated silencing of C5aR1 gene expression, using shRNA-2; TRAP = tartrate-resistant acid phosphatase; VEGF = vascular endothelial growth factor.

Comment in

References

    1. Pio R, Ajona D, Lambris JD. Complement inhibition in cancer therapy. Semin Immunol. 2013;25:54–64. - PMC - PubMed
    1. Klos A, Tenner AJ, Johswich KO, Ager RR, Reis ES, Köhl J. The role of the anaphylatoxins in health and disease. Mol Immunol. 2009;46:2753–2766. - PMC - PubMed
    1. Croker DE, Monk PN, Halai R, Kaeslin G, Schofield Z, Wu MC, et al. Discovery of functionally selective C5aR2 ligands: novel modulators of C5a signalling. Immunol Cell Biol. 2016;94:787–795. - PubMed
    1. Corrales L, Ajona D, Rafail S, Lasarte JJ, Riezu-Boj JI, Lambris JD, et al. Anaphylatoxin C5a creates a favorable microenvironment for lung cancer progression. J Immunol. 2012;189:4674–4683. - PMC - PubMed
    1. Ajona D, Castaño Z, Garayoa M, Zudaire E, Pajares MJ, Martinez A, et al. Expression of complement factor H by lung cancer cells: effects on the activation of the alternative pathway of complement. Cancer Res. 2004;64:6310–6318. - PubMed

Publication types