

Feature genes in metastatic breast cancer identified by MetaDE and SVM classifier methods
- PMID: 29328377
- PMCID: PMC5802200
- DOI: 10.3892/mmr.2018.8398
Feature genes in metastatic breast cancer identified by MetaDE and SVM classifier methods
Abstract
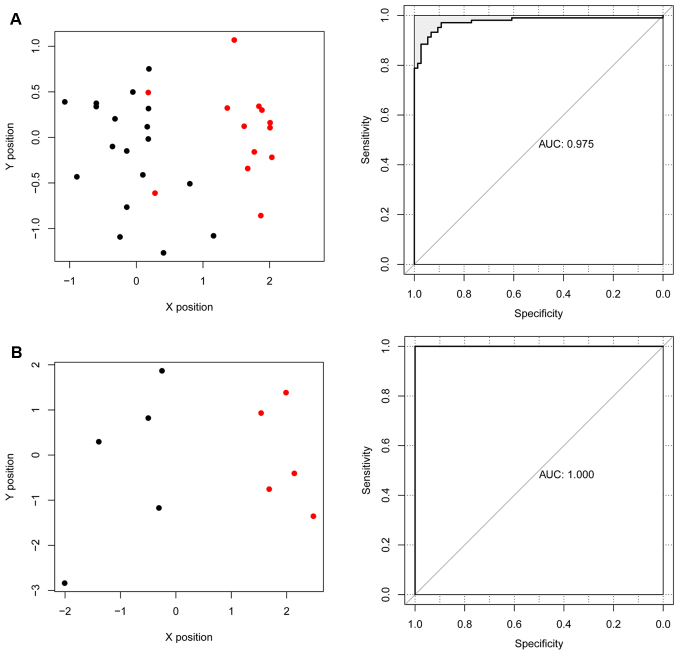
The aim of the present study was to investigate the feature genes in metastatic breast cancer samples. A total of 5 expression profiles of metastatic breast cancer samples were downloaded from the Gene Expression Omnibus database, which were then analyzed using the MetaQC and MetaDE packages in R language. The feature genes between metastasis and non‑metastasis samples were screened under the threshold of P<0.05. Based on the protein‑protein interactions (PPIs) in the Biological General Repository for Interaction Datasets, Human Protein Reference Database and Biomolecular Interaction Network Database, the PPI network of the feature genes was constructed. The feature genes identified by topological characteristics were then used for support vector machine (SVM) classifier training and verification. The accuracy of the SVM classifier was then evaluated using another independent dataset from The Cancer Genome Atlas database. Finally, function and pathway enrichment analyses for genes in the SVM classifier were performed. A total of 541 feature genes were identified between metastatic and non‑metastatic samples. The top 10 genes with the highest betweenness centrality values in the PPI network of feature genes were Nuclear RNA Export Factor 1, cyclin‑dependent kinase 2 (CDK2), myelocytomatosis proto‑oncogene protein (MYC), Cullin 5, SHC Adaptor Protein 1, Clathrin heavy chain, Nucleolin, WD repeat domain 1, proteasome 26S subunit non‑ATPase 2 and telomeric repeat binding factor 2. The cyclin‑dependent kinase inhibitor 1A (CDKN1A), E2F transcription factor 1 (E2F1), and MYC interacted with CDK2. The SVM classifier constructed by the top 30 feature genes was able to distinguish metastatic samples from non‑metastatic samples [correct rate, specificity, positive predictive value and negative predictive value >0.89; sensitivity >0.84; area under the receiver operating characteristic curve (AUROC) >0.96]. The verification of the SVM classifier in an independent dataset (35 metastatic samples and 143 non‑metastatic samples) revealed an accuracy of 94.38% and AUROC of 0.958. Cell cycle associated functions and pathways were the most significant terms of the 30 feature genes. A SVM classifier was constructed to assess the possibility of breast cancer metastasis, which presented high accuracy in several independent datasets. CDK2, CDKN1A, E2F1 and MYC were indicated as the potential feature genes in metastatic breast cancer.
Keywords: breast cancer; metastasis; protein-protein interactions; feature gene; support vector machine classifier.
Figures


Similar articles
-
Machine learning and deep learning methods that use omics data for metastasis prediction.Comput Struct Biotechnol J. 2021 Sep 4;19:5008-5018. doi: 10.1016/j.csbj.2021.09.001. eCollection 2021. Comput Struct Biotechnol J. 2021. PMID: 34589181 Free PMC article. Review.
-
Establishment of a SVM classifier to predict recurrence of ovarian cancer.Mol Med Rep. 2018 Oct;18(4):3589-3598. doi: 10.3892/mmr.2018.9362. Epub 2018 Aug 8. Mol Med Rep. 2018. PMID: 30106117 Free PMC article.
-
Construction of a 26‑feature gene support vector machine classifier for smoking and non‑smoking lung adenocarcinoma sample classification.Mol Med Rep. 2018 Feb;17(2):3005-3013. doi: 10.3892/mmr.2017.8220. Epub 2017 Dec 7. Mol Med Rep. 2018. PMID: 29257283 Free PMC article.
-
Bioinformatics analysis of the CDK2 functions in neuroblastoma.Mol Med Rep. 2018 Mar;17(3):3951-3959. doi: 10.3892/mmr.2017.8368. Epub 2017 Dec 29. Mol Med Rep. 2018. PMID: 29328425
-
MYC and metastasis.Cancer Res. 2011 Mar 15;71(6):2034-7. doi: 10.1158/0008-5472.CAN-10-3776. Cancer Res. 2011. PMID: 21406394 Free PMC article. Review.
Cited by
-
Stroma-derived extracellular vesicle mRNA signatures inform histological nature of prostate cancer.J Extracell Vesicles. 2021 Oct;10(12):e12150. doi: 10.1002/jev2.12150. J Extracell Vesicles. 2021. PMID: 34596356 Free PMC article.
-
MetaCancer: A deep learning-based pan-cancer metastasis prediction model developed using multi-omics data.Comput Struct Biotechnol J. 2021 Aug 9;19:4404-4411. doi: 10.1016/j.csbj.2021.08.006. eCollection 2021. Comput Struct Biotechnol J. 2021. PMID: 34429856 Free PMC article.
-
Characteristic genes in THP‑1 derived macrophages infected with Mycobacterium tuberculosis H37Rv strain identified by integrating bioinformatics methods.Int J Mol Med. 2019 Oct;44(4):1243-1254. doi: 10.3892/ijmm.2019.4293. Epub 2019 Jul 30. Int J Mol Med. 2019. PMID: 31364746 Free PMC article.
-
Machine learning and deep learning methods that use omics data for metastasis prediction.Comput Struct Biotechnol J. 2021 Sep 4;19:5008-5018. doi: 10.1016/j.csbj.2021.09.001. eCollection 2021. Comput Struct Biotechnol J. 2021. PMID: 34589181 Free PMC article. Review.
-
Gene expression signatures predict response to therapy with growth hormone.Pharmacogenomics J. 2021 Oct;21(5):594-607. doi: 10.1038/s41397-021-00237-5. Epub 2021 May 27. Pharmacogenomics J. 2021. PMID: 34045667 Free PMC article. Clinical Trial.
References
MeSH terms
Substances
LinkOut - more resources
Full Text Sources
Other Literature Sources
Medical
Research Materials
Miscellaneous
