Bioinformatic analysis of gene expression profiling of intracranial aneurysm
- PMID: 29328431
- PMCID: PMC5802158
- DOI: 10.3892/mmr.2017.8367
Bioinformatic analysis of gene expression profiling of intracranial aneurysm
Abstract
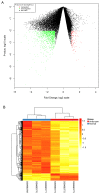
Intracranial aneurysm (IA) is a severe clinical condition of primary concern and currently, there is no effective therapeutic reagent. The present study aimed to investigate the molecular mechanism of IA via bioinformatic analysis. Various gene expression profiles (GSE26969) were downloaded from the Gene Expression Omnibus database, including 3 IA and 3 normal superficial temporal artery samples. Firstly, the limma package in R language was used to identify differentially expressed genes (DEGs; P‑value <0.01 and |log2 FC|≥1). Secondly, the database for annotation, visualization and integrated discovery software was utilized to perform pathway and functional enrichment analyses (false discovery rate ≤0.05). Finally, protein‑protein interaction (PPI) network and sub‑network clustering analyses were performed using the biomolecular interaction network database and ClusterONE software, respectively. Following this, a transcription factor regulatory network was identified from the PPI network. A total of 1,124 DEGs were identified, of which 989 were upregulated and 135 downregulated. Pathway and functional enrichment analyses revealed that the DEGs primarily participated in RNA splicing, functioning of the spliceosome, RNA processing and the mRNA metabolic process. Following PPI network analysis, 1 hepatocyte nuclear factor (HNF) 4A (transcription factor)‑centered regulatory network and 5 DEG‑centered sub‑networks were identified. On analysis of the transcription factor regulatory network, 6 transcription factors (HNF6, HNF4A, E2F4, YY1, H4 and H31T) and a regulatory pathway (HNF6‑HNF4‑E2F4) were identified. The results of the present study suggest that activating transcription factor‑5, Jun proto‑oncogene, activator protein‑1 transcription factor subunit, HNF6, HNF4 and E2F4 may participate in IA progression via vascular smooth muscle cell apoptosis, inflammation, vessel wall remodeling and damage and the tumor necrosis factor‑β signaling pathway. However, further experimental studies are required to validate these predictions.
Keywords: intracranial aneurysm; differentially expressed genes; functional enrichment analysis; protein-protein interaction; regulatory network.
Figures


References
-
- Bakke SJ, Lindegaard KF. Subarachnoid haemorrhage-diagnosis and management. Tidsskr Nor Laegeforen. 2007;127:1074–1078. (In Norwegian) - PubMed
-
- Pera J, Korostynski M, Krzyszkowski T, Czopek J, Slowik A, Dziedzic T, Piechota M, Stachura K, Moskala M, Przewlocki R, Szczudlik A. Gene expression profiles in human ruptured and unruptured intracranial aneurysms: What is the role of inflammation? Stroke. 2010;41:224–231. doi: 10.1161/STROKEAHA.109.562009. - DOI - PubMed
-
- Kurki MI, Hakkinen SK, Frosen J, Tulamo R, von und zu Fraunberg M, Wong G, Tromp G, Niemelä M, Hernesniemi J, Jääskeläinen JE, Ylä-Herttuala S. Upregulated signaling pathways in ruptured human saccular intracranial aneurysm wall: An emerging regulative role of Toll-like receptor signaling and nuclear factor-κB, hypoxia-inducible factor-1A and ETS transcription factors. Neurosurgery. 2011;68:1666–1675. doi: 10.1227/NEU.0b013e318210f001. - DOI - PubMed
MeSH terms
Substances
LinkOut - more resources
Full Text Sources
Other Literature Sources
Medical
Research Materials
Miscellaneous

