

Thalamic atrophy in multiple sclerosis: A magnetic resonance imaging marker of neurodegeneration throughout disease
- PMID: 29328531
- PMCID: PMC6317847
- DOI: 10.1002/ana.25150
Thalamic atrophy in multiple sclerosis: A magnetic resonance imaging marker of neurodegeneration throughout disease
Abstract
Objective: Thalamic volume is a candidate magnetic resonance imaging (MRI)-based marker associated with neurodegeneration to hasten development of neuroprotective treatments. Our objective is to describe the longitudinal evolution of thalamic atrophy in MS and normal aging, and to estimate sample sizes for study design.
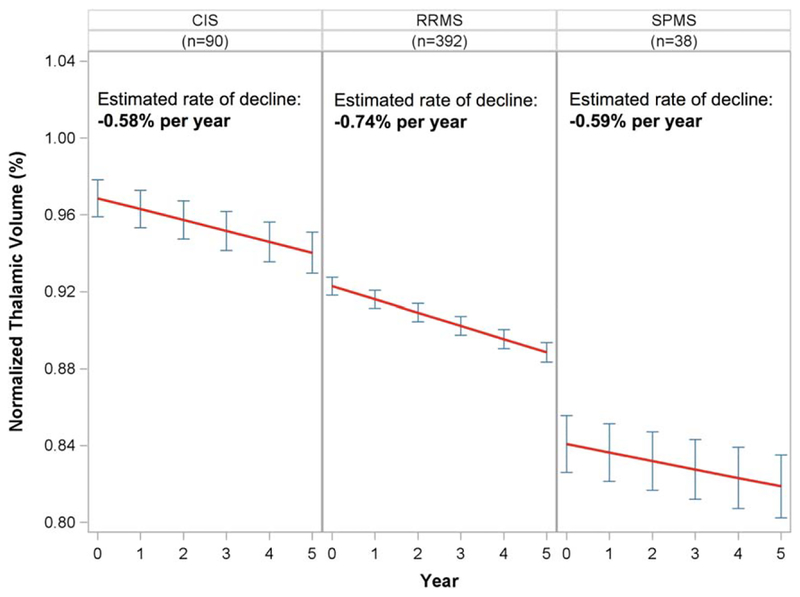
Methods: Six hundred one subjects (2,632 MRI scans) were analyzed. Five hundred twenty subjects with relapse-onset MS (clinically isolated syndrome, n = 90; relapsing-remitting MS, n = 392; secondary progressive MS, n = 38) underwent annual standardized 3T MRI scans for an average of 4.1 years, including a 1mm3 3-dimensional T1-weighted sequence (3DT1; 2,485 MRI scans). Eighty-one healthy controls (HC) were scanned longitudinally on the same scanner using the same protocol (147 MRI scans). 3DT1s were processed using FreeSurfer's longitudinal pipeline after lesion inpainting. Rates of normalized thalamic volume loss in MS and HC were compared in linear mixed effects models. Simulation-based sample size calculations were performed incorporating the rate of atrophy in HC.
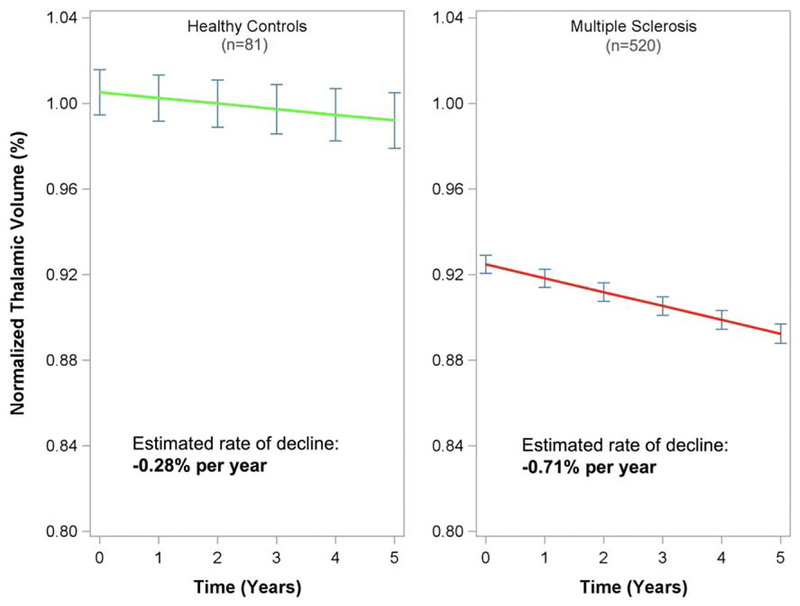
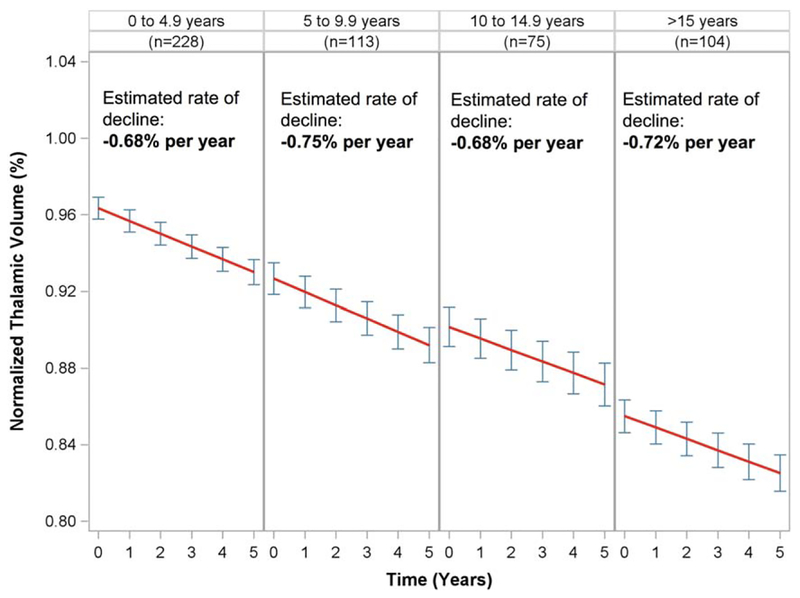
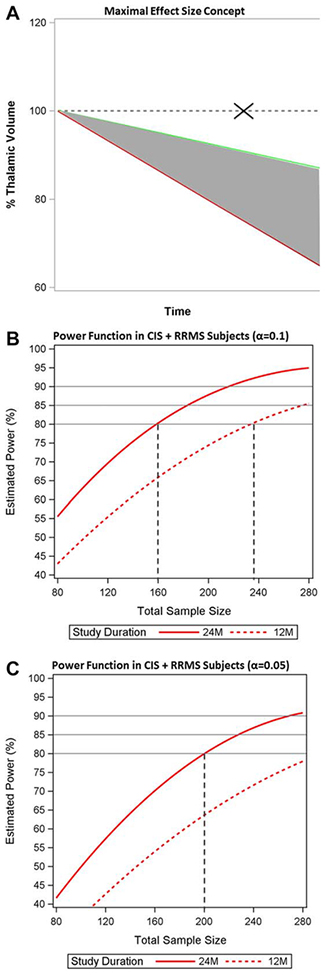
Results: Thalamic volume declined significantly faster in MS subjects compared to HC, with an estimated decline of -0.71% per year (95% confidence interval [CI] = -0.77% to -0.64%) in MS subjects and -0.28% per year (95% CI = -0.58% to 0.02%) in HC (p for difference = 0.007). The rate of decline was consistent throughout the MS disease duration and across MS clinical subtypes. Eighty or 100 subjects per arm (α = 0.1 or 0.05, respectively) would be needed to detect the maximal effect size with 80% power in a 24-month study.
Interpretation: Thalamic atrophy occurs early and consistently throughout MS. Preliminary sample size calculations appear feasible, adding to its appeal as an MRI marker associated with neurodegeneration. Ann Neurol 2018;83:223-234.
© 2018 American Neurological Association.
Conflict of interest statement
Potential Conflicts of Interest
D.P. has received consulting and/or speaking fees from Biogen, and grant/research support from Biogen. C.J.A. has received consulting fees from Biogen. Biogen cosponsored the acquisition of the MRI scans used in these studies; however, the authors’ work for Biogen was not related to this study, and no Biogen products were used in the study, although some subjects may have been taking such products as part of their routine clinical care. Similarly, although GlaxoSmithKline cosponsored MRI data acquisition, their products were not used in this study, although some subjects may have been taking their products as part of their routine clinical care.
Figures
References
-
- Trapp BD, Peterson J, Ransohoff RM, et al. Axonal transection in the lesions of multiple sclerosis. N Engl J Med 1998;338:278–285. - PubMed
-
- Mahad DH, Trapp BD, Lassmann H. Pathological mechanisms in progressive multiple sclerosis. Lancet Neurol 2015;14:183–193. - PubMed
-
- Lassmann H. Multiple sclerosis: lessons from molecular neuropathology. Exp Neurol 2014;262(pt A):2–7. - PubMed
-
- Witte ME, Mahad DJ, Lassmann H, van Horssen J. Mitochondrial dysfunction contributes to neurodegeneration in multiple sclerosis. Trends Mol Med 2014;20:179–187. - PubMed
Publication types
MeSH terms
Grants and funding
LinkOut - more resources
Full Text Sources
Other Literature Sources
Medical
