. 2018 Jan 23;69(3):603-617.
doi: 10.1093/jxb/erx441.

Association of extracellular dNTP utilization with a GmPAP1-like protein identified in cell wall proteomic analysis of soybean roots

Affiliations

Association of extracellular dNTP utilization with a GmPAP1-like protein identified in cell wall proteomic analysis of soybean roots

Weiwei Wu et al. J Exp Bot. .

Abstract

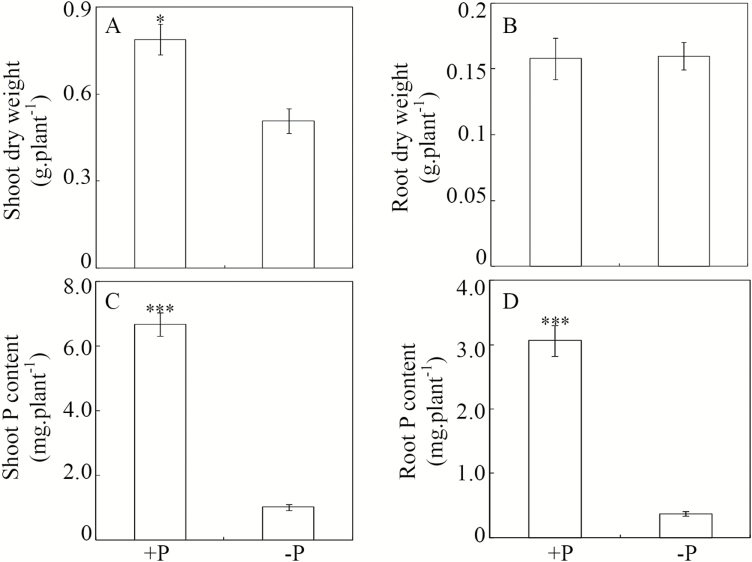
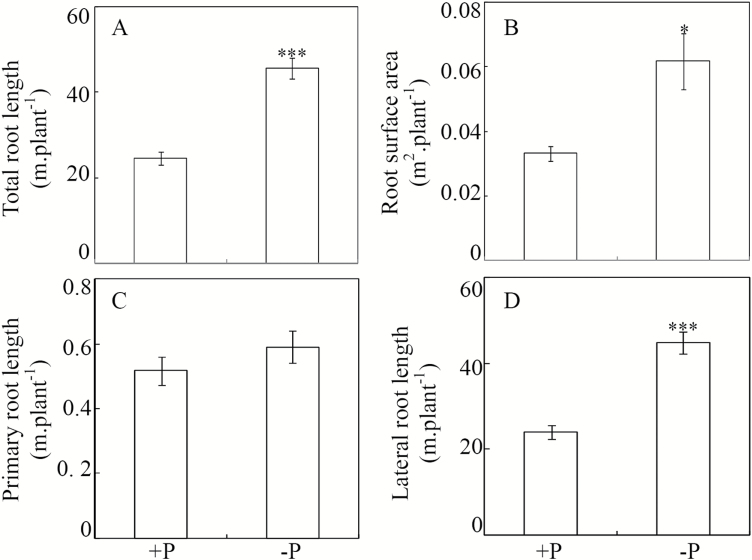
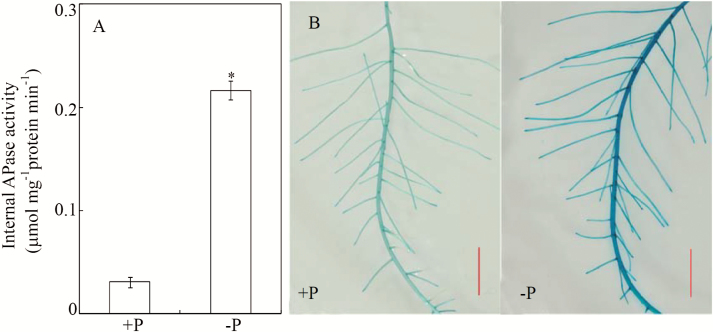
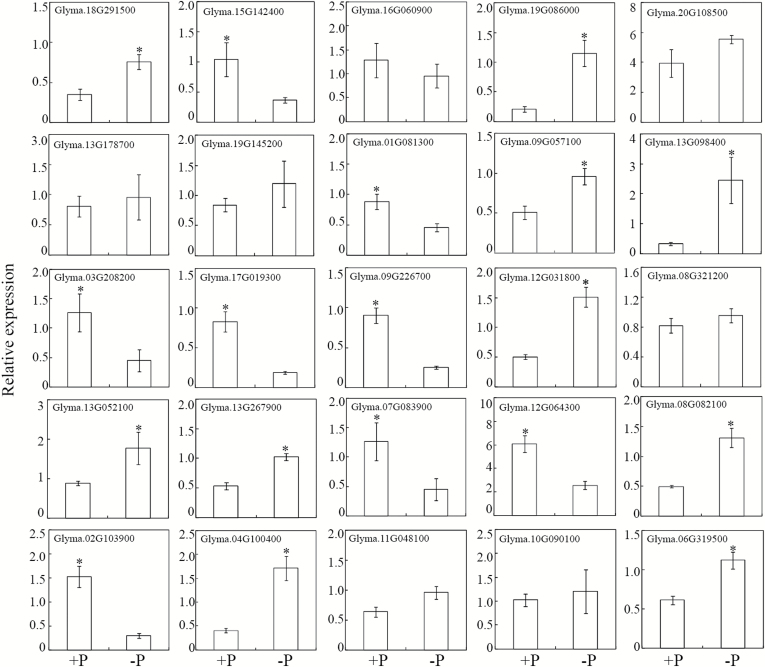
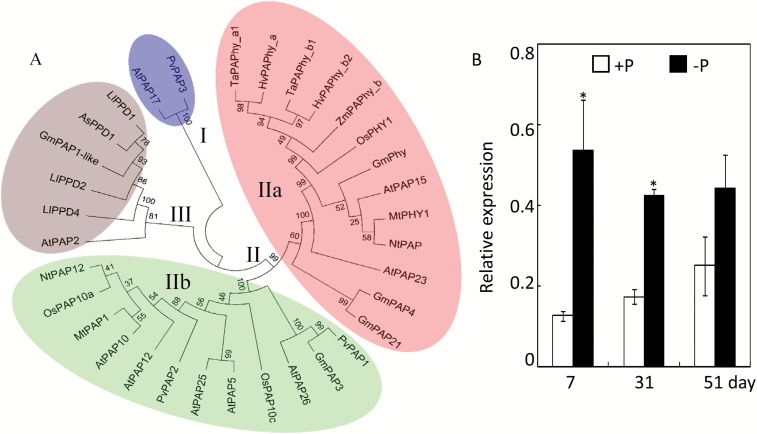
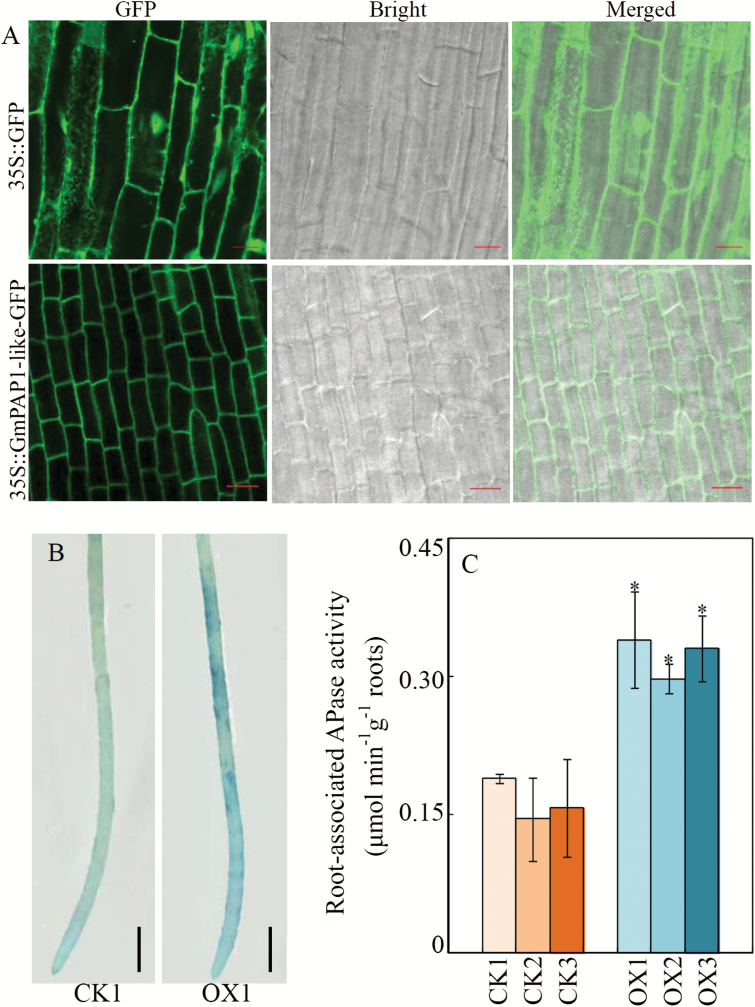
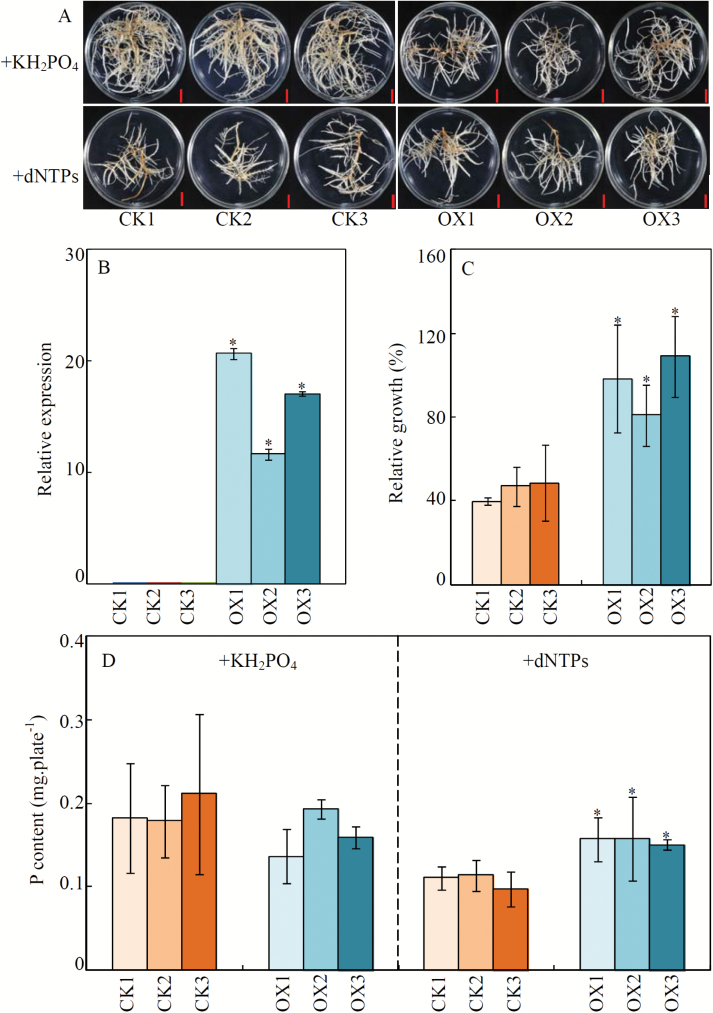
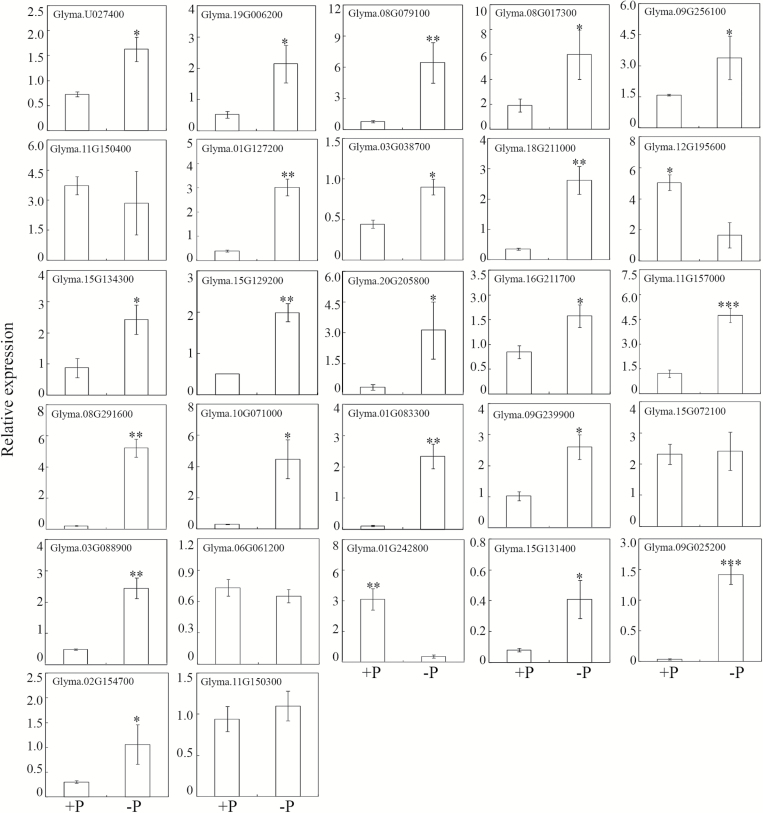
Plant root cell walls are dynamic systems that serve as the first plant compartment responsive to soil conditions, such as phosphorus (P) deficiency. To date, evidence for the regulation of root cell wall proteins (CWPs) by P deficiency remains sparse. In order to gain a better understanding of the roles played by CWPs in the roots of soybean (Glycine max) in adaptation to P deficiency, we conducted an iTRAQ (isobaric tag for relative and absolute quantitation) proteomic analysis. A total of 53 CWPs with differential accumulation in response to P deficiency were identified. Subsequent qRT-PCR analysis correlated the accumulation of 21 of the 27 up-regulated proteins, and eight of the 26 down-regulated proteins with corresponding gene expression patterns in response to P deficiency. One up-regulated CWP, purple acid phosphatase 1-like (GmPAP1-like), was functionally characterized. Phaseolus vulgaris transgenic hairy roots overexpressing GmPAP1-like displayed an increase in root-associated acid phosphatase activity. In addition, relative growth and P content were significantly enhanced in GmPAP1-like overexpressing lines compared to control lines when deoxy-ribonucleotide triphosphate (dNTP) was applied as the sole external P source. Taken together, the results suggest that the modulation of CWPs may regulate complex changes in the root system in response to P deficiency, and that the cell wall-localized GmPAP1-like protein is involved in extracellular dNTP utilization in soybean.

Keywords: Cell wall proteins; phosphorus deficiency; phosphorus utilization; proteomics; purple acid phosphatase; soybean.


Figures

Fig. 1.
Fig. 1.
Effects of P availability on soybean dry weight and P content. Soybean seedlings were treated with +P (250 μM KH2PO4) or –P (5 μM KH2PO4). Data are means of four replicates ±SE. Asterisks indicate significant differences between the two P treatments: *P<0.05; ***P<0.001.
Fig. 2.
Fig. 2.
Effects of P availability on soybean root growth. Soybean seedlings were treated with +P (250 μM KH2PO4) or –P (5 μM KH2PO4). Data are means of four replicates ±SE. Asterisks indicate significant differences between the two P treatments: *P<0.05; ***P<0.001.
Fig. 3.
Fig. 3.
Effects of P availability on the APase activity of soybean roots. (A) Internal APase activity in soybean roots subjected to +P (250 μM KH2PO4) or –P (5 μM KH2PO4) conditions. Data are means of four replicates ±SE. Asterisks indicate significant differences between the two P treatments: *P<0.05. (B) APase activity on root surfaces of +P and –P soybean plants detected by BCIP staining. Scale bars are 2 cm.
Fig. 5.
Fig. 5.
Transcription levels of genes encoding Pi-starvation down-regulated CWPs. qRT-PCR was conducted to analyse gene expression in roots subjected to +P (250 μM KH2PO4) or –P (5 μM KH2PO4) treatments. Data are means of four independent replicates ±SE. Asterisks indicate significant differences between the two P treatments: *P<0.05.
Fig. 6.
Fig. 6.
Phylogenetic analysis and expression patterns of GmPAP1-like. (A) Phylogenetic analysis of soybean GmPAP1-like and GmPAP22-like (also named as GmPAP21) with other plant PAPs. The first two letters of each PAP protein label represent the abbreviated species name: As, Astragalus sinicus; At, Arabidopsis thaliana; Gm, Glycine max; Hv, Hordeum vulgare; Ll, Lupinus luteus; Mt, Medicago truncatula; Nt, Nicotiana tabacum; Os, Oryza sativa; Pv, Phaseolus vulgaris; Ta, Triticum aestivum; Zm, Zea mays. The numerals I, II, and III designate the three groups of PAP proteins. Group II was further divided into two subgroups (IIa and IIb). Bootstrap values (%) are indicated for major branches. (B) Expression patterns of soybean GmPAP1-like in response to Pi starvation at different growth stages. *P<0.05. (This figure is available in color at JXB online.)
Fig. 7.
Fig. 7.
Subcellular localization of GmPAP1-like and root-associated APase activity in transgenic bean hairy roots overexpressing GmPAP1-like. (A) Bean hairy roots expressing 35S::GFP (top row) and 35S:: GmPAP1-like-GFP (bottom row) were observed by confocal laser scanning microscopy. Scale bars are 20 μm; (B) Root-associated APase activity of bean hairy roots transformed with the empty vector (CK1) or GmPAP1-like (OX1) detected by BCIP staining. Scale bars are 5 mm. (C) Root-associated APase activity of transgenic bean hairy roots. CK1, CK2, and CK3 represent three transgenic hairy root lines transformed with the empty vector; OX1, OX2, and OX3 indicate three transgenic hairy root lines with GmPAP1-like overexpression. Data are means of four biological replicates ±SE. Asterisks indicate significant differences between GmPAP1-like overexpression lines and CK lines: *P<0.05.
Fig. 8.
Fig. 8.
Growth and P content of transgenic bean hairy roots supplied with different P sources. (A) Phenotypes of transgenic bean hairy roots supplied with different P sources. Scale bars are 1 cm. (B) Expression levels of GmPAP1-like in transgenic been hairy roots. (C) Relative growth of transgenic bean hairy roots. Relative growth (%) = 100×(Increase of fresh weight in dNTP / Increase of fresh weight in KH2PO4). (D) P content in transgenic bean hairy roots. Uniform transgenic bean hairy roots were grown on MS medium supplied with 1.2 mM KH2PO4 or 0.4 mM dNTP for 14 d. Fresh weight and P content were measured, and the fresh weight was further used for the calculation of relative growth of the roots. CK1, CK2, and CK3 are three transgenic lines transformed with an empty vector; OX1, OX2, and OX3 represent transgenic lines with GmPAP1-like overexpression. Data are means of four biological replicates ±SE. Asterisks indicate significant differences between GmPAP1-like overexpression lines and CK lines: *P<0.05.
Fig. 4.
Fig. 4.
Transcription levels of genes encoding Pi-starvation up-regulated CWPs. qRT-PCR was conducted to analyse gene expression in roots subjected to +P (250 μM KH2PO4) or –P (5 μM KH2PO4) treatments. Data are means of four independent replicates ±SE. Asterisks indicate significant differences between the two P treatments: *P<0.05; **P<0.01; ***P<0.001.

References

    1. Alvarez-Buylla ER, Liljegren SJ, Pelaz S, Gold SE, Burgeff C, Ditta GS, Vergara-Silva F, Yanofsky MF. 2000. MADS-box gene evolution beyond flowers: expression in pollen, endosperm, guard cells, roots and trichomes. The Plant Journal 24, 457–466. - PubMed
    1. Ao JH, Fu JB, Tian J, Yan XL, Liao H. 2010. Genetic variability for root morph-architecture traits and root growth dynamics as related to phosphorus efficiency in soybean. Functional Plant Biology 37, 304–312.
    1. Asmar F, Gahoonia T, Nielsen NE. 1995. Barley genotypes differ in activity of soluble extracellular phosphatase and depletion of organic phosphorus in the rhizosphere soil. Plant and Soil 172, 117–122.
    1. Babu Y, Musielak T, Henschen A, Bayer M. 2013. Suspensor length determines developmental progression of the embryo in Arabidopsis. Plant Physiology 162, 1448–1458. - PMC - PubMed
    1. Baiya S, Hua Y, Ekkhara W, Ketudat Cairns JR. 2014. Expression and enzymatic properties of rice (Oryza sativa L.) monolignol β-glucosidases. Plant Science 227, 101–109. - PubMed

Publication types

MeSH terms