. 2018 Jan 12;15(1):4.
doi: 10.1186/s12989-018-0240-x.

PM2.5-induced oxidative stress increases intercellular adhesion molecule-1 expression in lung epithelial cells through the IL-6/AKT/STAT3/NF-κB-dependent pathway

Affiliations

PM2.5-induced oxidative stress increases intercellular adhesion molecule-1 expression in lung epithelial cells through the IL-6/AKT/STAT3/NF-κB-dependent pathway

Chen-Wei Liu et al. Part Fibre Toxicol. .

Abstract

Background: Epidemiological studies have shown that ambient air pollution is closely associated with increased respiratory inflammation and decreased lung function. Particulate matters (PMs) are major components of air pollution that damages lung cells. However, the mechanisms remain to be elucidated. This study examines the effects of PMs on intercellular adhesion molecule-1 (ICAM-1) expression and the related mechanisms in vitro and in vivo.

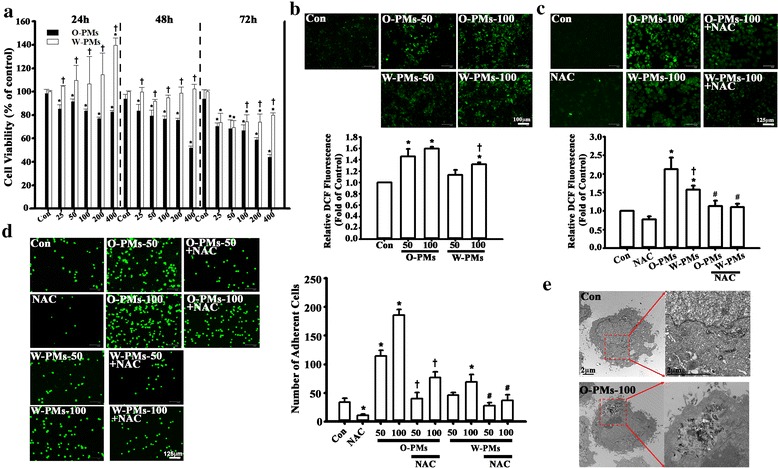
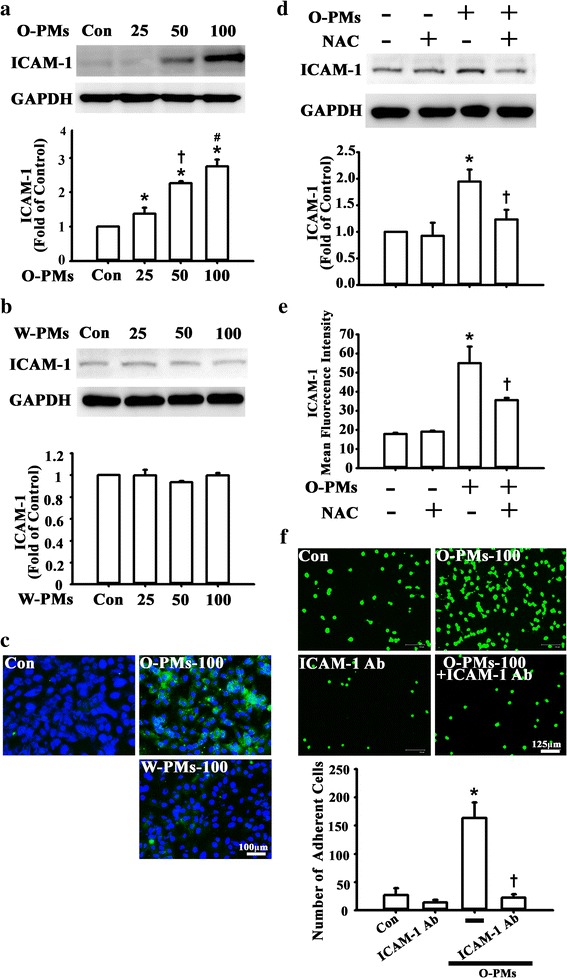
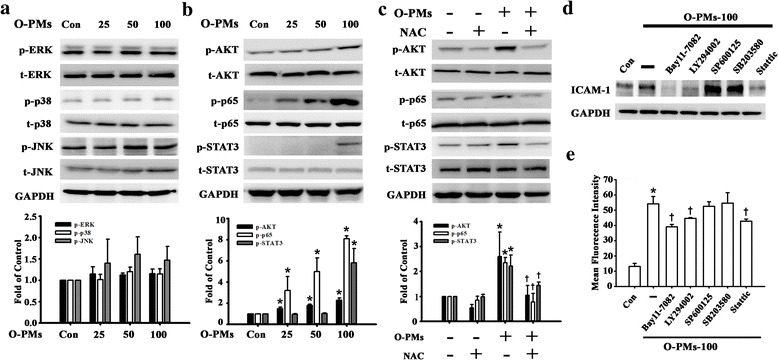
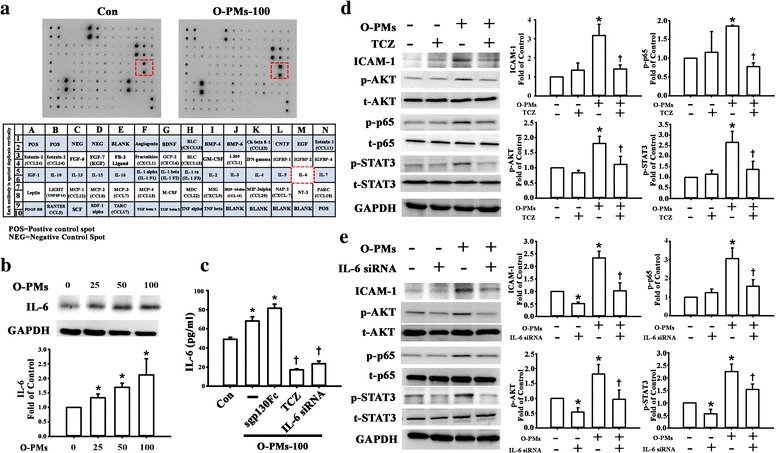
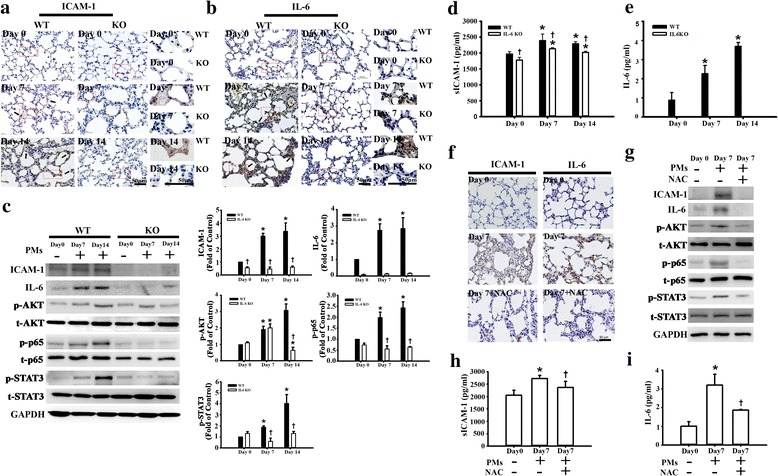
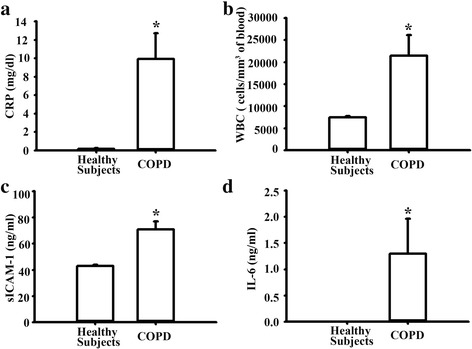
Result: The cytotoxicity, reactive oxygen species (ROS) generation, and monocyte adherence to A549 cells were more severely affected by treatment with O-PMs (organic solvent-extractable fraction of SRM1649b) than with W-PMs (water-soluble fraction of SRM1649b). We observed a significant increase in ICAM-1 expression by O-PMs, but not W-PMs. O-PMs also induced the phosphorylation of AKT, p65, and STAT3. Pretreating A549 cells with N-acetyl cysteine (NAC), an antioxidant, attenuated O-PMs-induced ROS generation, the phosphorylation of the mentioned kinases, and the expression of ICAM-1. Furthermore, an AKT inhibitor (LY294002), NF-κB inhibitor (BAY11-7082), and STAT3 inhibitor (Stattic) significantly down-regulated O-PMs-induced ICAM-1 expression as well as the adhesion of U937 cells to epithelial cells. Interleukin-6 (IL-6) was the most significantly changed cytokine in O-PMs-treated A549 cells according to the analysis of the cytokine antibody array. The IL-6 receptor inhibitor tocilizumab (TCZ) and small interfering RNA for IL-6 significantly reduced ICAM-1 secretion and expression as well as the reduction of the AKT, p65, and STAT3 phosphorylation in O-PMs-treated A549 cells. In addition, the intratracheal instillation of PMs significantly increased the levels of the ICAM-1 and IL-6 in lung tissues and plasma in WT mice, but not in IL-6 knockout mice. Pre-administration of NAC attenuated those PMs-induced adverse effects in WT mice. Furthermore, patients with chronic obstructive pulmonary disease (COPD) had higher plasma levels of ICAM-1 and IL-6 compared to healthy subjects.

Conclusion: These results suggest that PMs increase ICAM-1 expression in pulmonary epithelial cells in vitro and in vivo through the IL-6/AKT/STAT3/NF-κB signaling pathway.

Keywords: Inflammation; Intercellular adhesion molecule-1 (ICAM-1); Interleukin-6 (IL-6); Particulate matters (PMs); Reactive oxygen species (ROS).


Conflict of interest statement

Ethics approval

All animal procedures described in this study were conducted in accordance with the guidelines for the care and use of laboratory animals approved by National Taiwan University (ICCUC: 20,160,235). All participants provided informed written consent prior to participating in the study. The study protocol conformed to the ethical guidelines of the 1975 Declaration of Helsinki and was approved by the Ethics Committee of Taoyuan General Hospital (TYGH99025).

Consent for publication

No personal information is included in this study.

Competing interests

The authors declare that they have no competing interests.

Publisher’s Note

Springer Nature remains neutral with regard to jurisdictional claims in published maps and institutional affiliations.

Figures

Fig. 1
Fig. 1
Cytotoxicity, ROS generation, and monocyte adherence to A549 cells were more severely affected by O-PM than by W-PM treatment. a The cytotoxic effects of O-PMs (organic solvent-extractable fraction of PMs) and W-PMs (water-soluble fraction of PMs) on A549 cells at the concentrations of 25, 50, 100, 200, and 400 μg/ml for 24, 48 and 72 h were examined by MTT assay. The data are expressed as a percentage of that obtained for DMSO-treated or media-treated cells, which was set to 100%. *p < 0.05 vs. the control cells in the corresponding groups. †p < 0.05 vs. O-PMs. b The intracellular ROS levels in A549 cells after the exposure of 50 or 100 μg/ml of O-PMs or W-PMs for 24 h were determined using DCFH-DA by fluorescent microscope and flow cytometer. Bar = 100 mu. c A549 cells were pretreated with 5 mM of N-acetyl cysteine (NAC) for 1 h and then treated with 100 μg/ml of O-PMs or with W-PMs for 24 h. The intracellular ROS levels were determined using DCFH-DA by fluorescent microscope and flow cytometer. Bar = 125 mu. d Representative fluorescence photomicrographs and quantitative data showing the effect of O-PMs and W-PMs-treated A549 cells on the adhesion of fluorescein-labeled U937 cells. A549 cells were treated with or without 5 mM NAC for 1 h, and were then treated with or without 50 or 100 μg/ml of O-PMs or W-PMs for 24 h. The number of bound U937 cells was counted by fluorescence microscopy. Values are the mean ± SD of three independent experiments. *p < 0.05 vs. con. †p < 0.05 vs. O-PMs-50 or O-PMs-100, respectively. #p < 0.05 vs. W-PMs-50 or W-PMs-100, respectively. Bar = 125 mu. e TEM images of A549 cells. O-PMs were located in the cytoplasm of A549 cells after 100 μg/ml O-PMs exposure for 24 h. Bar = 2 mu
Fig. 2
Fig. 2
O-PMs-increased ICAM-1 Expression in A549 Cells, but not W-PMs. a-b A549 cells were exposed to 0, 25, 50 or 100 μg/ml O-PMs (a) or W-PMs (b) for 24 h. ICAM-1 protein in cell lysates was measured by Western blot as described in the Methods section. GAPDH was used as the loading control. *p < 0.05 vs. untreated cells. †p < 0.05 vs. O-PMs-25. #p < 0.05 vs. O-PMs-50. c The distribution of ICAM-1 was analyzed by immunofluorescent staining. Bar = 100 mu. d-e A549 cells were pretreated with 5 mM NAC for 1 h and then treated with 100 μg/ml O-PMs for 24 h. ICAM-1 protein in cell lysates was measured by Western blot (d) and the ICAM-1 surface expression was detected by flow cytometer (e). *p < 0.05 vs. Con. †p < 0.05 vs. O-PMs. f Representative fluorescence photomicrographs and quantitative data showing the effect of ICAM-1 expression on the adhesion of BCECF-AM-labeled U937 cells to O-PMs-treated A549 cells. A549 cells were cotreated with 100 μg/ml O-PMs and with 1 μg/ml anti-ICAM-1 antibody or anti-IgG for 24 h. Bar = 125 mu. *p < 0.05 vs. Con. †p < 0.05 vs. O-PMs
Fig. 3
Fig. 3
O-PMs induced ROS production and ICAM-1 expression in A549 cells through AKT/STAT3/p65 phosphorylation. a-b The effects of O-PMs treatment on the phosphorylation of (a) ERK, p38, JNK (b) AKT, p65, and STAT3 in A549 cells. A549 cells were exposed to 0, 25, 50 or 100 μg/ml O-PMs for 24 h. Cell lysates were analyzed by Western blot with antibodies against p-ERK, t-ERK, p-JNK, t-JNK, p-p38, t-p38, p-AKT, t-AKT, p-p65, t-p65, p-STAT3, and t-STAT3. c The effects of NAC treatment on the phosphorylation of AKT, p65 and STAT3 in O-PMs-treated A549 cells by Western blot. A549 cells were pretreated with 5 mM of NAC for 1 h and then treated with 100 μg/ml O-PMs for 24 h. *p < 0.05 vs. Con. d-e A549 cells were pretreated with BAY11–7082 (10 μM), LY294002 (10 μM), SP600125 (10 μM), SB203580 (10 μM), or Stattic (10 μM) for 1 h and then treated with 100 μg/ml O-PMs for 24 h. ICAM-1 protein in cell lysates was measured by Western blot (D) and the ICAM-1 surface expression was detected by flow cytometry (E). *p < 0.05 vs. Con. †p < 0.05 vs. O-PMs
Fig. 4
Fig. 4
NF-κB activation was involved in O-PMs-induced ICAM-1 expression in A549 cells. a The effects of O-PMs treatment on translocation of NF-κB p65 in A549 cells. A549 cell were treated with or without 100 μg/ml O-PMs for 24 h. The distribution of p65 in the cytosolic (C) and nuclear (N) portion of A549 cells was determined by Western blot. *p < 0.05 vs. the cytosolic portion. †p < 0.05 vs. compared to the nuclear portion. b A549 cells were transfected with various concentrations of siRNA of p65 for 48 h. Levels of p65 were determined by Western blot. *p < 0.05 vs. 0 (untransfected cells). c After the transfection of p65 siRNA for 24 h, A549 cells were then stimulated with 100 μg/ml O-PMs for 24 h. The ICAM-1, p-AKT and p-STAT3 expression was determined by Western blot. *p < 0.05 vs. Con. †p < 0.05 vs. O-PMs. d Representative fluorescence photomicrographs and quantitative data showing the effects of AKT, NF-κB, and STAT3 on the adhesion of BCECF-AM-labeled U937 cells to O-PMs-treated A549 cells. Cells were pretreated for 1 h with BAY11–7082 (10 μM), LY294002 (10 μM), Stattic (10 μM) or p65 siRNA. Then they were treated with 100 μg/ml O-PMs for 24 h in the continued presence of the inhibitor. The cells without any treatment were used as the control (Con). BCECF-AM-labeled U937 cells were added to A549 cells and were incubated at 37 °C for 1 h. The adherent cells were photographed with a fluorescent microscope. Bar = 125 mu. *p < 0.05 vs. Con. †p < 0.05 vs. O-PMs
Fig. 5
Fig. 5
IL-6 was involved in O-PMs-induced ICAM-1 expression. a Representative photographs of the cytokine antibody array hybridized with conditioned media from A549 cells with or without 100 μg/ml O-PMs treatment for 24 h. b A549 cells were exposed to 0, 25, 50, or 100 μg/ml O-PMs for 24 H. IL-6 protein in cell lysates was measured by Western blot as described in the Methods section. GAPDH was used as the loading control. c A549 cells were pretreated with 20 μg/ml TCZ or with 5 μg/ml of sgp130Fc or with IL-6 siRNA, respectively, and then with treated with 100 μg/ml O-PMs for 24 H. IL-6 concentration in conditioned media was determined by ELISA. *p < 0.05 vs. Con. †p < 0.05 vs. O-PMs. d-e The effects of TCZ (d) and IL-6 (e) on the expression of ICAM-1 expression and the phosphorylation of AKT, p65 and STAT3. *p < 0.05 vs. the untreated cells. †p < 0.05 vs. O-PMs
Fig. 6
Fig. 6
PMs-induced ICAM-1 and IL-6 expression in lung tissues of WT mice. WT and IL-6 KO mice were intratracheal instillation with 200–350 mg/mouse PMs for 7 and 14 days. Mice were euthanized, and plasma and lung tissues were collected at the determined time. a-c The levels of ICAM-1and IL-6 expression in lung tissues of WT and IL-6 KO mice were examined by immunohistochemical staining (a-b) and Western blot (c). The reaction product is indicated by arrows. The boxed regions were enlarged and shown in the right panel. Bar = 50 mu. d-e The levels of sICAM-1 and IL-6 in plasma were measured by ELISA. Data are expressed as mean ± SEM. (n = 6 for each group). *p < 0.05 vs. WT or IL-6 KO at Day 0, respectively. †p < 0.05 vs. WT at Day 7 or Day 14. WT mice (n = 6) were treated NAC (3–5 mg/mouse, 150 mg/kg body weight) before PM intratracheal instillation (200–350 mg/mouse). f The levels of ICAM-1and IL-6 expression in lung tissues were examined by immunohistochemical staining. g The expression of ICAM-1 and IL-6 as well as the phosphorylation of AKT, p65 and STAT3 in lung tissues were examined by Western blot. h-i The levels of sICAM-1 and IL-6 in plasma were measured by ELISA. *p < 0.05 vs WT at Day 0. †p < 0.05 vs Day 7
Fig. 7
Fig. 7
Plasma levels of WBC, CRP, sICAM-1, and IL-6 in COPD patients and healthy subjects. a-b Plasma levels of white blood cell (WBC) and C-reactive protein (CRP) levels. c-d The plasma level of sICAM-1 and IL-6 were assayed by ELISA. Healthy subjects (n = 8) and COPD patients with smoking history (n = 8) were enrolled. *p < 0.05 vs. healthy subjects

References

    1. Lim SS, Vos T, Flaxman AD, Danaei G, Shibuya K, Adair-Rohani H, et al. A comparative risk assessment of burden of disease and injury attributable to 67 risk factors and risk factor clusters in 21 regions, 1990-2010: a systematic analysis for the global burden of disease study 2010. Lancet. 2012;380:2224–2260. doi: 10.1016/S0140-6736(12)61766-8. - DOI - PMC - PubMed
    1. Beelen R, Raaschou-Nielsen O, Stafoggia M, Andersen ZJ, Weinmayr G, Hoffmann B, et al. Effects of long-term exposure to air pollution on natural-cause mortality: an analysis of 22 European cohorts within the multicentre ESCAPE project. Lancet. 2014;383:785–795. doi: 10.1016/S0140-6736(13)62158-3. - DOI - PubMed
    1. Dai L, Zanobetti A, Koutrakis P, Schwartz JD. Associations of fine particulate matter species with mortality in the United States: a multicity time-series analysis. Environ Health Perspect. 2014;122:837–842. doi: 10.1289/ehp.1307568. - DOI - PMC - PubMed
    1. Rosenlund M, Picciotto S, Forastiere F, Stafoggia M, Perucci CA. Traffic-related air pollution in relation to incidence and prognosis of coronary heart disease. Epidemiology. 2008;19:121–128. doi: 10.1097/EDE.0b013e31815c1921. - DOI - PubMed
    1. Ping J. Influence of hazy weather on patient presentation with respiratory diseases in Beijing, China. Asian Pac J Cancer Prev. 2015;16:607–611. doi: 10.7314/APJCP.2015.16.2.607. - DOI - PubMed

Publication types

MeSH terms