. 2018 Jan 12;15(1):13.
doi: 10.1186/s12974-018-1053-4.

MicroRNA-124 regulates the expression of MEKK3 in the inflammatory pathogenesis of Parkinson's disease

Affiliations

MicroRNA-124 regulates the expression of MEKK3 in the inflammatory pathogenesis of Parkinson's disease

Longping Yao et al. J Neuroinflammation. .

Abstract

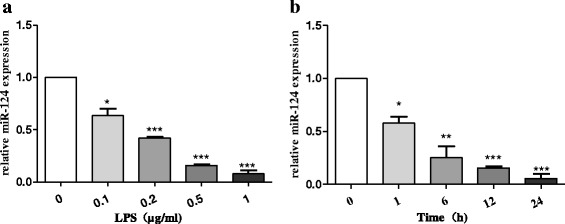
Background: Parkinson's disease (PD) is the most prevalent neurodegenerative disorder that is characterised by selective loss of midbrain dopaminergic (DA) neurons. Chronic inflammation of the central nervous system is mediated by microglial cells and plays a critical role in the pathological progression of PD. Brain-specific microRNA-124 (miR-124) expression is significantly downregulated in lipopolysaccharide (LPS)-treated BV2 cells and in the 1-methyl-4-phenyl-1,2,3,6-tetrahydropyridine (MPTP) model of PD. However, whether abnormal miR-124 expression could regulate the activation of microglia remains poorly understood.

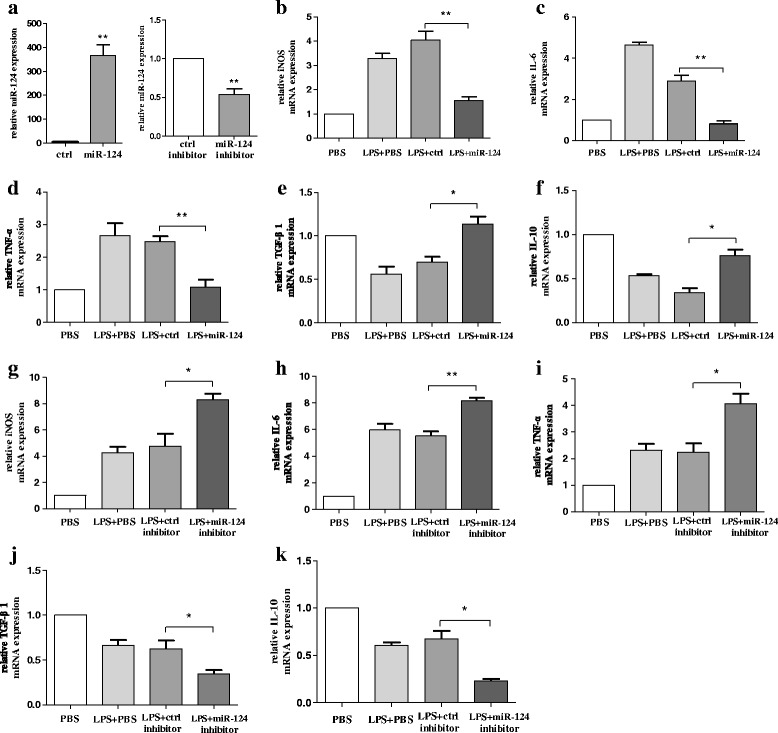
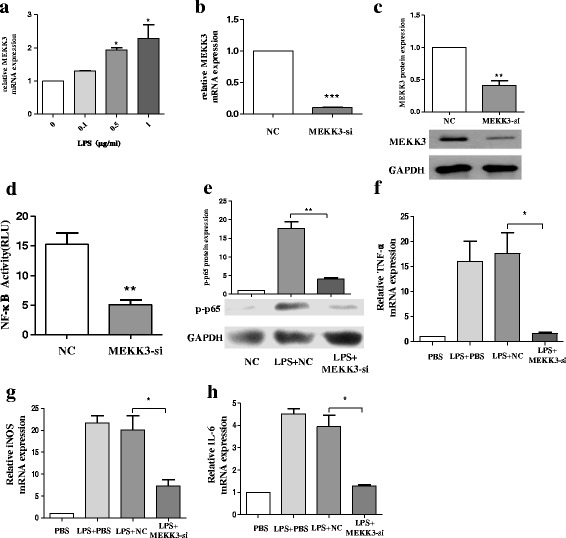
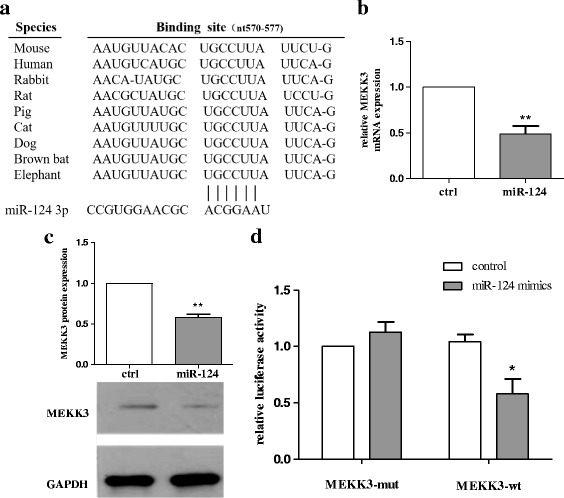
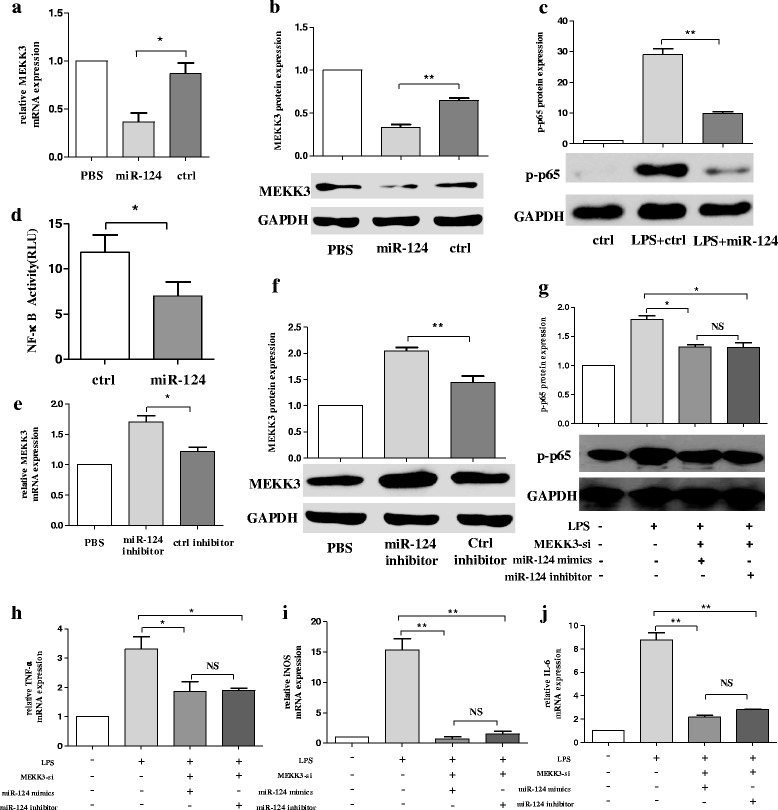
Methods: BV2 cells were activated by exposure to LPS, and the expression levels of miR-124, mitogen-activated protein kinase kinase kinase 3 (MEKK3), and the nuclear factor of kappaB (NF-κB) p-p65 were analysed. Over-expression and knockdown studies of miR-124 were performed to observe the effects on MEKK3/NF-κB signalling pathways, and the induction of pro-inflammatory and neurotoxic factors was assessed. In addition, a luciferase reporter assay was conducted to confirm whether MEKK3 is a direct target of miR-124. Meanwhile, production of miR-124, MEKK3, and p-p65; midbrain DA neuronal death; or activation of microglia were analysed when treated with or without miR-124 in the MPTP-induced model of PD.

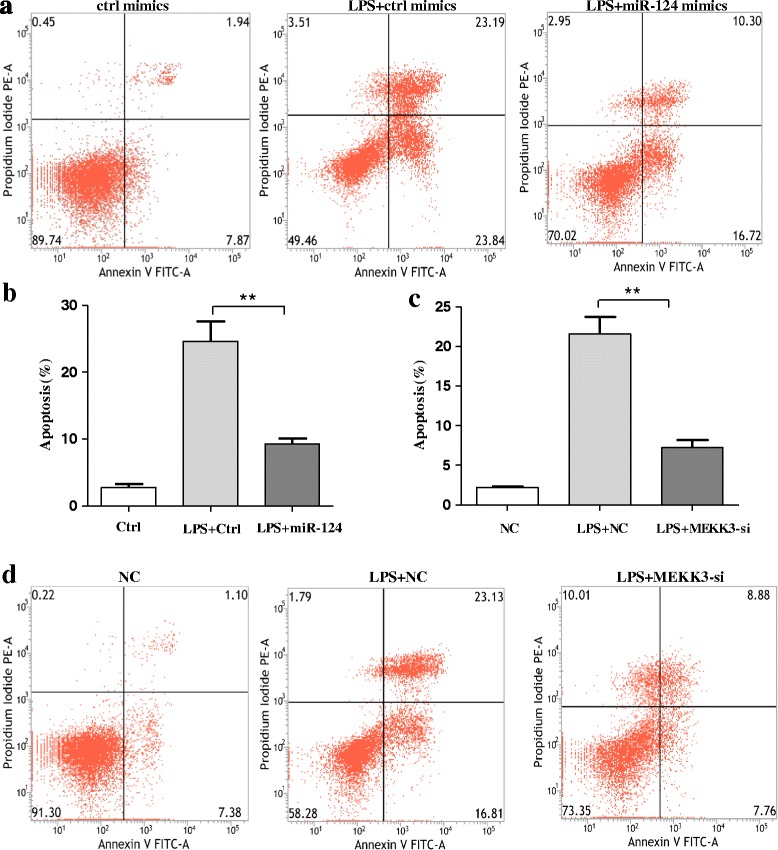
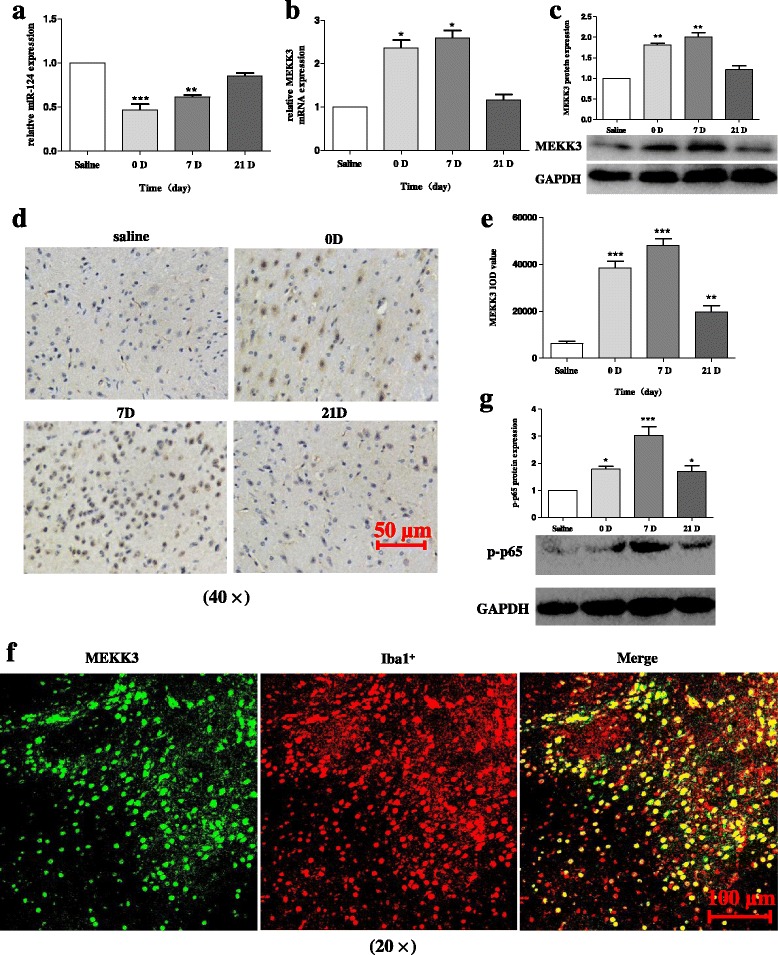
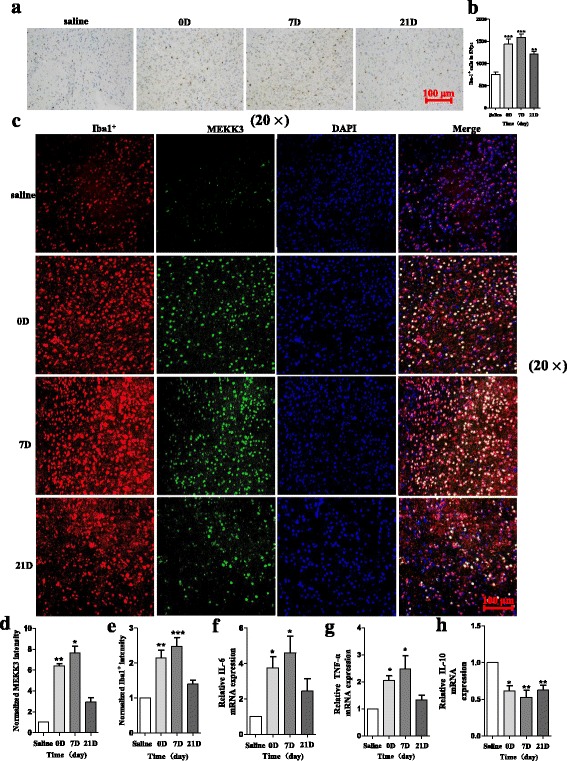
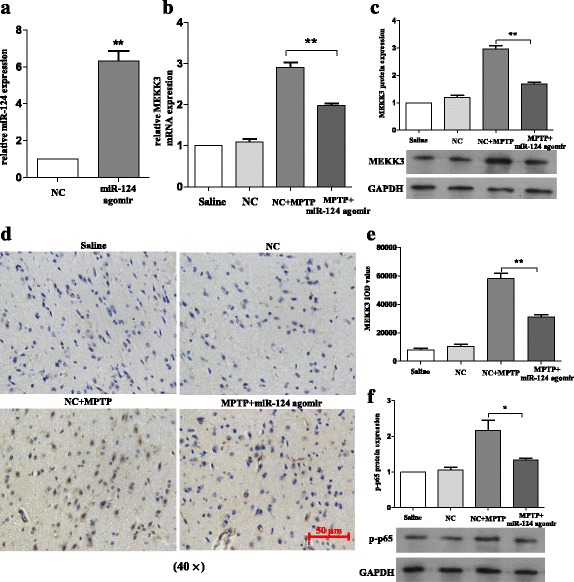
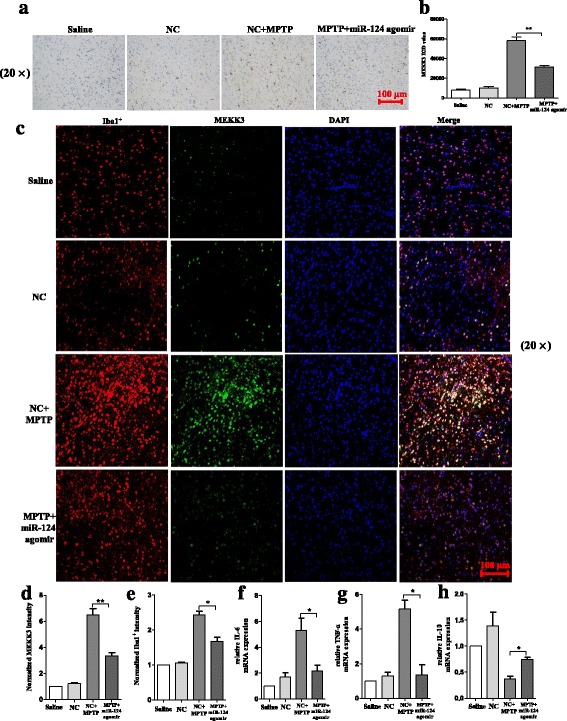
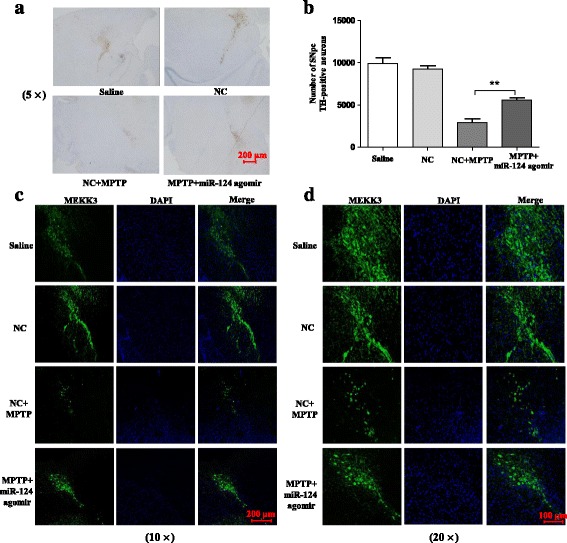
Results: We found that the knockdown of MEKK3 could inhibit the activation of microglia by regulating NF-κB expression. Over-expression of miR-124 could effectively attenuate the LPS-induced expression of pro-inflammatory cytokines and promote the secretion of neuroprotective factors. We also first identified a unique role of miR-124 in mediating the microglial inflammatory response by targeting MEKK3/NF-κB signalling pathways. In the microglial culture supernatant (MCS) transfer model, over-expression of the miR-124 or knockdown of MEKK3 in BV2 cells prevented SH-SY5Y from apoptosis and death. Moreover, MEKK3 and p-p65 were abundantly expressed in the midbrain. Furthermore, their expression levels increased and microglial activation was observed in the MPTP-induced model of PD. In addition, exogenous delivery of miR-124 could suppress MEKK3 and p-p65 expression and attenuate the activation of microglia in the substantia nigra pars compacta of MPTP-treated mice. miR-124 also could prevent MPTP-dependent apoptotic midbrain DA cell death in a MPTP-induced PD model.

Conclusions: Taken together, our data suggest that miR-124 can inhibit neuroinflammation in the development of PD by regulating the MEKK3/NF-κB signalling pathways and implicate miR-124 as a potential therapeutic target for regulating the inflammatory response in PD.

Keywords: MEKK3; MicroRNA-124; Microglia; NF-κB; Parkinson’s disease.


Conflict of interest statement

Ethics approval

All experimental procedures and animal care were approved by the Southern Medical University Ethics Committee and were conducted in accordance with the guidelines of the National Institutes of Health on the care and use of animals.

Consent for publication

Not applicable.

Competing interests

The authors declare that they have no competing interests.

Publisher’s Note

Springer Nature remains neutral with regard to jurisdictional claims in published maps and institutional affiliations.

Figures

Fig. 1
Fig. 1
Brain-specific miR-124 was downregulated in the LPS-stimulated BV2 cells. miR-124 expression level was determined using reverse transcription quantitative real-time PCR (RT-qPCR) and normalised with U6 RNA. a miR-124 expression in BV2 cells treated with different concentrations (0.1, 0.2, 0.5, and 1 μg/mL) of LPS for 24 h. b miR-124 expression in BV2 cells exposed to 1 μg/mL LPS for different durations (0, 1, 6, 12, and 24 h). The data are shown as the mean ± SE from three independent experiments. The fold change is statistically significant. The fold change is significant where *P < 0.05, **P < 0.01, and ***P < 0.001
Fig. 2
Fig. 2
Over-expression of miR-124 could effectively attenuate LPS-induced BV2 microglial activation. a Microglia were transfected with miR-124 mimics or miR-124 inhibitor. After 48 h, cells were harvested, and miR-124 expression was evaluated using RT-qPCR. bf BV2 cells were transfected with miR-124 mimics or miR-124 control for 48 h and then treated with LPS. After 24 h, cells were harvested, and the mRNA levels of the pro-inflammatory cytokines iNOS (b), IL-6 (c), TNF-α (d), TGF-β1 (e), and IL-10 (f) were evaluated using RT-qPCR. gk BV2 cells were transfected with miR-124 inhibitor or control inhibitor for 48 h. The mRNA levels of pro-inflammatory cytokines iNOS (g), IL-6 (h), TNF-α (i), TGF-β1 (j), and IL-10 (k) were determined using RT-qPCR following a 24-h incubation with LPS. The fold change was normalised by GAPDH RNA levels. Experiments performed in triplicate showed consistent results. Data are presented as the mean ± SD. The fold change is statistically significant. *P < 0.05, **P < 0.01
Fig. 3
Fig. 3
Knockdown of MEKK3 suppresses the expression of p-p65 and the secretion of pro-inflammatory cytokines in BV2 cells. a BV2 cells were treated with an increasing concentration of LPS (0.1, 0.5, and 1 μg/mL). After 12 h, cells were harvested for RNA isolation. Then, RT-qPCR analysis detected changes in the transcript level of MEKK3. b, c BV2 cells were transfected with negative control (NC) or MEKK3 siRNA (MEKK3-si). After 48 h, cells were harvested, and the MEKK3 mRNA (b) and protein expression (c) levels were evaluated using RT-qPCR and western blot analysis. d, e BV2 cells were transfected with NC or MEKK3-si for 48 h. Cells were washed with PBS and then stimulated with LPS (1 μg/mL) for 12 h. Cells were harvested. NF-κB activity was analysed by luciferase assay (d). Western blotting confirmed the protein expression of p-p65 (e). fh BV2 cells were transfected with NC or MEKK3-si. After 48 h, cells were washed with PBS and then treated with LPS (1 μg/mL), After 12 h, the cells were harvested. The mRNA levels of pro-inflammatory cytokines TNF-α (f), iNOS (g), and IL-6 (h) were examined by RT-qPCR. GAPDH was used as a loading control for normalising the image density. The data are shown as the mean ± SE from three independent experiments. The fold change is statistically significant where *P < 0.05, **P < 0.01, and ***P < 0.001
Fig. 4
Fig. 4
miR-124 targets MEKK3. a Alignment of the miR-124 binding site to Bim 3′-UTR is shown for different species as predicted using the TargetScan database. b, c BV2 cells were transfected with miR-124 mimics or ctrl mimics. After 48 h, cells were harvested, and the expression levels of MEKK3 mRNA (b) and protein (c) were evaluated using RT-qPCR and western blot analysis. The fold change was normalised by GAPDH levels. d Luciferase activity in HEK293 cells transfected with reporter constructs containing wild-type (WT) or mutated Bim 3′-UTR. The cells were cotransfected with indicated constructs and miR-124 mimics (100 nm) or control, and normalised levels of luciferase activity are shown. The results are presented as the mean ± SE from three independent experiments. The fold change is statistically significant. *P < 0.05, **P < 0.01. NS not significant
Fig. 5
Fig. 5
miR-124 attenuates LPS-induced inflammatory responses by targeting MEKK3/NF-κB signalling pathways in BV2 cells. The BV2 cells were transfected with miR-124 mimics or ctrl mimics. After 48 h, the production mRNA levels of MEKK3 (a) were determined using RT-qPCR, and western blot analysis was used to analyse the protein expression changes of MEKK3 (b) and p-p65 (c). NF-κB activity was analysed using luciferase assay (d). e, f The BV2 cells were transfected with miR-124 inhibitor or ctrl inhibitor, and the cells were harvested at 48 h. The relative expression of MEKK3 mRNA was evaluated using RT-qPCR (e), and the MEKK3 protein expression was studied using western blot analysis (f). gj The BV2 cells were pre-transfected with MEKK3 siRNA for 48 h, and then the cells were transfected with miR-124 mimic or miR-124 inhibitor. After 24 h, cells were harvested, and the expression levels of p-p65 protein were evaluated using western blot analysis (g). RT-qPCR confirmed the expression of pro-inflammatory cytokines of TNF-α (h), iNOS (i), and IL-6 (j). The data were normalised against GAPDH. Data are normalised to saline controls and presented as the mean ± SD of three independent experiments. The fold change is statistically significant. *P < 0.05, **P < 0.01. NS not significant
Fig. 6
Fig. 6
Over-expression of miR-124 or knockdown of MEKK3 could prevent neuronal death and apoptosis following microglial activation in the MCS transfer model. BV2 microglial cells were transfected with miR-124 mimics/control mimics or MEKK3 siRNA/negative control for 48 h. Subsequently, the cells were incubated in the presence of LPS (1 μg/mL) for 12 h. SH-SY5Y cells were cultured normally for 24 h before adding a mixture of BV2-conditioned medium and fresh medium at a ratio of 1:1 (v/v). After 24 h, the SH-SY5Y cells were harvested. In the miR-124 mimic/control mimic group, the neuronal apoptosis level was assessed using flow cytometry analysis (a), and the percentage of apoptotic cells in the total neuronal population was calculated (b). In the MEKK3 siRNA/negative control group, the percentage of apoptotic cells in the total neuronal population was calculated (c), and the neuronal apoptosis level was assessed using flow cytometry analysis (d). Data are normalised to those of saline controls and presented as the mean ± SD of three independent experiments. The fold change is statistically significant. **P < 0.01
Fig. 7
Fig. 7
Increasing expression levels of MEKK3, p-p65, and activated microglia are evidenced in the SNpc of MPTP-treated mice in vivo. The mice received one intraperitoneal injection of MPTP-HCl per day for five consecutive days, whereas the control mice received saline injections. Then, the mice were decapitated, and the midbrains were harvested at different time points after MPTP intoxication as follows: 0 (immediately after the last MPTP injection), 1, 7, and 21 days after the last MPTP injection. a The miR-124 expression level was determined using RT-qPCR and normalised with U6 RNA. The production mRNA level of MEKK3 (b) was determined using RT-qPCR. Western blot analysis evaluated the MEKK3 expression (c) in the total protein samples extracted from the midbrain. The data were normalised against GAPDH. d, e Immunohistochemical analysis was performed to analyse the MEKK3 response (d). Graphical representation of the MEKK3 IOD value after MPTP injection is shown (e). The scale bar represents 50 μm. f A confocal image supported by immunofluorescence confirmed the expression levels of MEKK3 and Iba1+. Green: anti-MEKK3; red: anti-Iba1 (antibody microglia). The scale bar represents 100 μm. g Western blot analysis determined p-p65 protein expression after MPTP injection. Data are normalised to those of saline controls and presented as the mean ± SD of three independent experiments. The fold change is statistically significant. *P < 0.05, **P < 0.01, ***P < 0.001
Fig. 8
Fig. 8
MPTP injection could induce microglial activation and neuroinflammation in the SNpc of MPTP-treated mice. The mice received one intraperitoneal injection of MPTP-HCl per day for five consecutive days, whereas the control mice received saline injections. Then, the mice were decapitated, and the midbrains were obtained at different time points after MPTP intoxication as follows: 0 (immediately after the last MPTP injection), 1, 7, and 21 days after the last MPTP injection. Immunohistochemical analysis was performed to analyse the Iba1 expression (a). The total number of Iba1+ cells was counted after MPTP injection (b). The scale bar represents 100 μm. A representative confocal image showing the expression of MEKK3 and Iba1+ is presented (c), and graphical representations of MEKK3 (d) and Iba1+ (e) intensity after MPTP injection are also shown. Green: anti-MEKK3; red: anti-Iba1; blue: DAPI. The scale bar represents 100 μm. RT-qPCR confirmed the expression levels of IL-6 (f), TNF-α (g), and IL-10 (h) after MPTP injection, and the fold change was normalised by GAPDH levels. Data are normalised to those in saline controls and presented as the mean ± SD of three independent experiments. The fold change is statistically significant. *P < 0.05, **P < 0.01, ***P < 0.001
Fig. 9
Fig. 9
Exogenous delivery of miR-124 could inhibit the expression of MEKK3 and p-p65 in the SNpc of MPTP-treated mice in vivo. The mice were treated with stereotactic intraventricular treatment of miR-124 agomir for five consecutive days. Next, the mice received one intraperitoneal injection of MPTP-HCl per day for 5 days, while the control mice received saline injections. Agomir treatment was performed 2 days prior to the injection of MPTP. Then, the mice were decapitated, and the midbrains were obtained 7 days after the last MPTP injection. a The miR-124 expression was evaluated using RT-qPCR and normalised with U6 RNA. In the agomir-treated mice and their negative control counterparts on day 7 after the last injection of MPTP, RT-qPCR was used to determine the production mRNA levels of MEKK3 (b), and western blot analysis was used to evaluate the MEKK3 (c) expression in total protein samples extracted from the midbrain. The fold change was normalised by GAPDH levels. Immunohistochemical analysis was performed to analyse the MEKK3 response (d), and a graphical representation of MEKK3 IOD value (e) from the midbrain is shown. The scale bar represents 50 μm. f Western blot analysis was used to determine the p-p65 protein expression. Data are normalised to saline controls and presented as the mean ± SD of three independent experiments. The fold change is statistically significant. *P < 0.05, **P < 0.01
Fig. 10
Fig. 10
Exogenous delivery of miR-124 attenuates the activation of microglia in the SNpc of MPTP-treated mice in vivo. The mice were treated with stereotactic intraventricular treatment of miR-124 agomir for five consecutive days. Next, the mice received one intraperitoneal injection of MPTP-HCl per day for 5 days, whereas the control mice received saline injections. The agomir treatment was performed 2 days prior to the MPTP injection. Then, the mice were decapitated, and the midbrain was obtained 7 days after the last MPTP injection. Immunostaining (a) and stereological counts (b) of Iba1+ cells in the SNpc are shown. The scale bar represents 100 μm. A confocal image of MEKK3 and Iba1 is shown (c), and a graphical representation of MEKK3 (d) and Iba1 (e) intensity in the SNpc is presented. Green: anti-MEKK3; red: anti-Iba1; blue: DAPI. The scale bar represents 100 μm. fh Western blot analysis determined the p-p65 protein expression, and RT-qPCR confirmed the expression levels of IL-6 (f), TNF-α (g), and IL-10 (h) from the midbrain. The fold change was normalised by GAPDH levels. Data are normalised to saline controls and presented as the mean ± SD of three independent experiments. The fold change is statistically significant. *P < 0.05, **P < 0.01
Fig. 11
Fig. 11
miR-124 attenuates MPTP-dependent apoptotic midbrain DA cell death in vivo. The mice were treated with stereotactic intraventricular treatment of miR-124 agomir for five consecutive days. Next, the mice received one intraperitoneal injection of MPTP-HCl per day for 5 days, whereas the control mice received saline injections. The agomir treatment was performed 2 days prior to the MPTP injection. Then, the mice were decapitated, and the midbrain was obtained 7 days after the last MPTP injection. Immunostaining (a) and stereological counts (b) of TH-positive neurons in the SNpc are shown. The scale bar represents 200 μm. Low magnification (scale bar, 200 nm) (c) and high magnification (scale bar, 100 nm) (d) are supported by confocal laser scanning microscopy of TH-positive neurons. Data are presented as the mean ± SD of three independent experiments. The fold change is statistically significant. **P < 0.01

References

    1. Satake W, Nakabayashi Y, Mizuta I, Hirota Y, Ito C, Kubo M, Kawaguchi T, Tsunoda T, Watanabe M, Takeda A, et al. Genome-wide association study identifies common variants at four loci as genetic risk factors for Parkinson’s disease. Nat Genet. 2009;41:1303–1307. doi: 10.1038/ng.485. - DOI - PubMed
    1. Ransohoff RM, Perry VH. Microglial physiology: unique stimuli, specialized responses. Annu Rev Immunol. 2009;27:119–145. doi: 10.1146/annurev.immunol.021908.132528. - DOI - PubMed
    1. Hirsch EC, Hunot S. Neuroinflammation in Parkinson’s disease: a target for neuroprotection? Lancet Neurol. 2009;8:382–397. doi: 10.1016/S1474-4422(09)70062-6. - DOI - PubMed
    1. Tang Y, Le W. Differential roles of M1 and M2 microglia in neurodegenerative diseases. Mol Neurobiol. 2016;53:1181–1194. doi: 10.1007/s12035-014-9070-5. - DOI - PubMed
    1. Koprich JB, Reske-Nielsen C, Mithal P, Isacson O. Neuroinflammation mediated by IL-1beta increases susceptibility of dopamine neurons to degeneration in an animal model of Parkinson’s disease. J Neuroinflammation. 2008;5:8. doi: 10.1186/1742-2094-5-8. - DOI - PMC - PubMed

MeSH terms