. 2018 Mar:325:1-13.
doi: 10.1016/j.cellimm.2018.01.002. Epub 2018 Jan 3.

Transcriptomic evidence of immune activation in macroscopically normal-appearing and scarred lung tissues in idiopathic pulmonary fibrosis

Affiliations

Transcriptomic evidence of immune activation in macroscopically normal-appearing and scarred lung tissues in idiopathic pulmonary fibrosis

Irina G Luzina et al. Cell Immunol. 2018 Mar.

Abstract

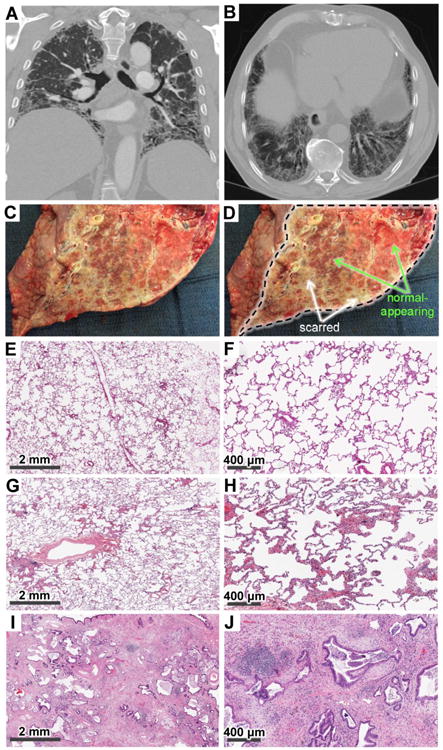
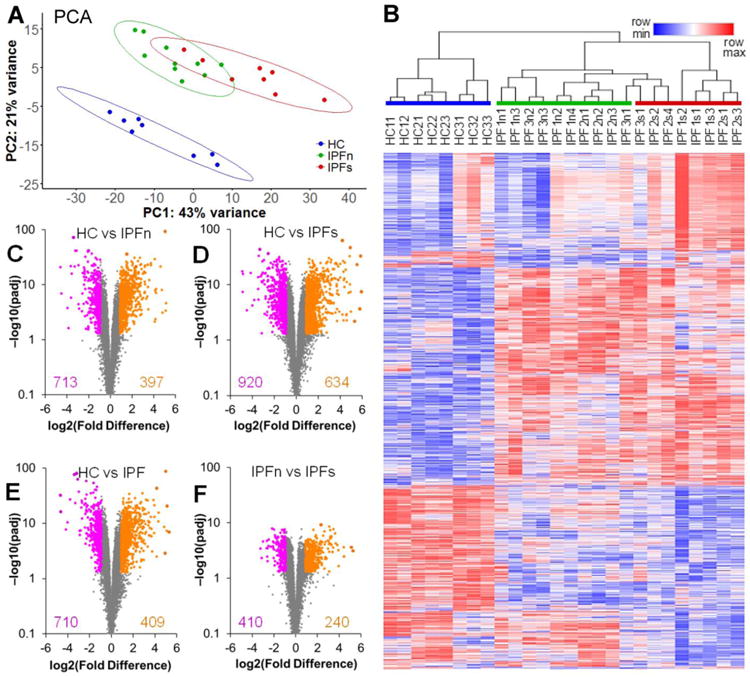
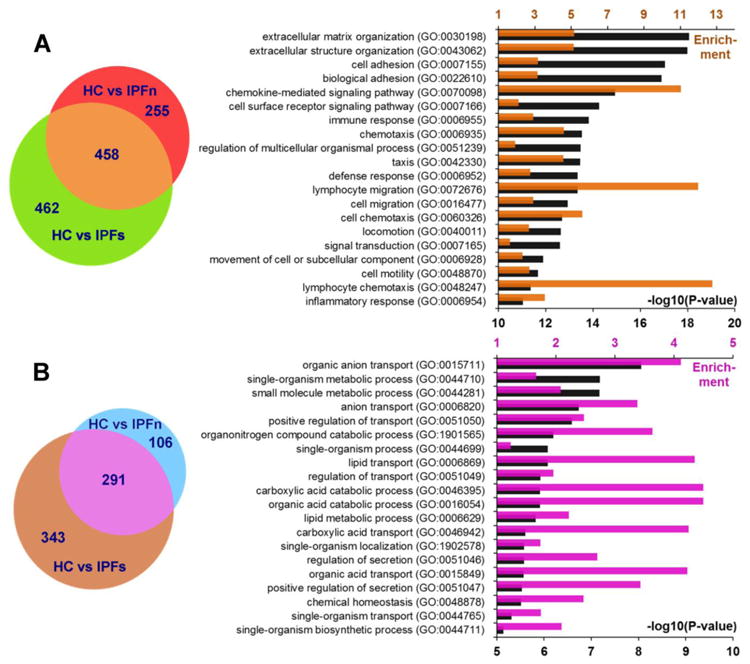
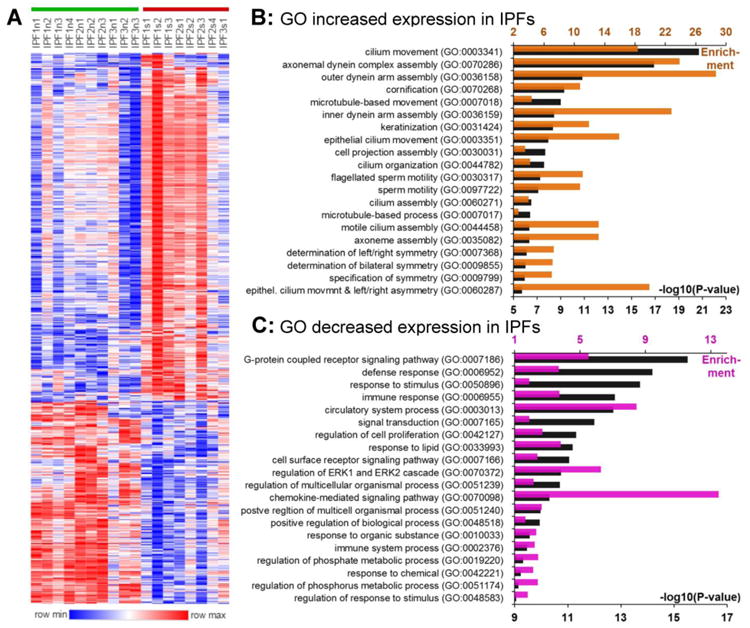
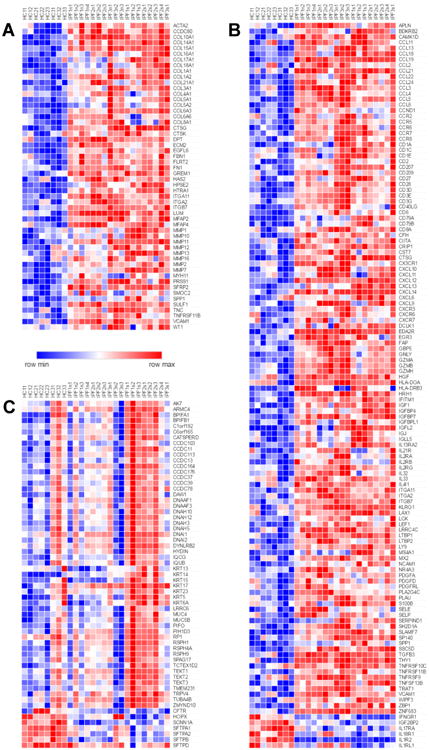
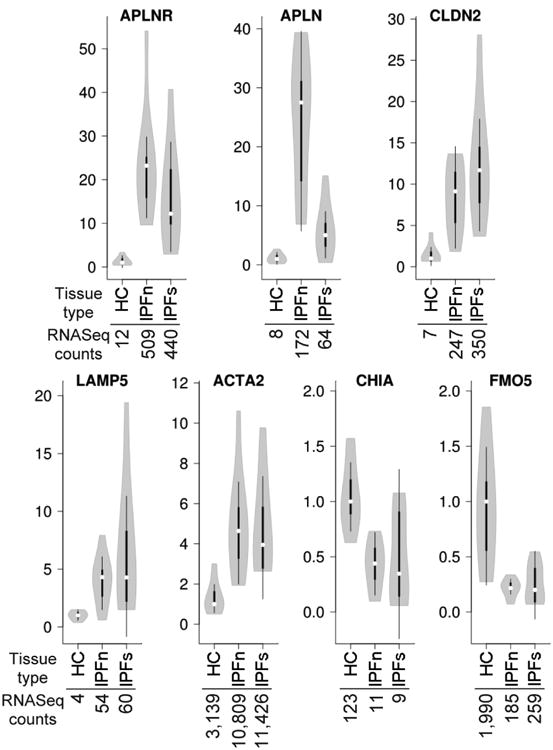
Idiopathic pulmonary fibrosis (IPF) is a fatal lung disease manifested by overtly scarred peripheral and basilar regions and more normal-appearing central lung areas. Lung tissues from macroscopically normal-appearing (IPFn) and scarred (IPFs) areas of explanted IPF lungs were analyzed by RNASeq and compared with healthy control (HC) lung tissues. There were profound transcriptomic changes in IPFn compared with HC tissues, which included elevated expression of numerous immune-, inflammation-, and extracellular matrix-related mRNAs, and these changes were similar to those observed with IPFs compared to HC. Comparing IPFn directly to IPFs, elevated expression of epithelial mucociliary mRNAs was observed in the IPFs tissues. Thus, despite the known geographic tissue heterogeneity in IPF, the entire lung is actively involved in the disease process, and demonstrates pronounced elevated expression of numerous immune-related genes. Differences between normal-appearing and scarred tissues may thus be driven by deranged epithelial homeostasis or possibly non-transcriptomic factors.

Keywords: Fibrosis; Inflammation; Lung; Transcriptome.


Conflict of interest statement

Disclosures: None of the authors has a financial relationship with a commercial entity that has an interest in the subject of the presented manuscript or other conflicts of interest to disclose. The views expressed in this article are those of the authors and do not reflect the official policy of the Department of Army/Navy/Air Force, Department of Defense, or the U.S. Government.

Figures

Figure 1
Figure 1
Representative radiology (A, B), gross pathology (C, D), and histology (E–J) findings in patients with IPF (A–D, G–J) and healthy controls (E, F). A, B. Radiologic images in the IPF patients demonstrate reticulation, honeycombing, traction bronchiectasis, and volume loss in a predominantly peripheral and basilar distribution, consistent with advanced pulmonary fibrosis. C, D. Gross appearance of a sagittally cut lung explant from a patient with IPF (C) and the same image with markings superimposed (D). The cut plane revealing the internal parenchyma of the lung is demarcated by the black dotted line in panel D, whereas selected macroscopically normal-appearing and macroscopically scarred areas are indicated with green and white arrows, respectively. Also note the cobblestone appearance of the pleural surface on the left side of panels C and D outside of the dissection area. E, F. Low- (E) and high-magnification (F) histologic images of normal lung parenchyma from HC lung tissue. G, H. Low- (G) and high-magnification (H) histologic images from macroscopically normal-appearing IPF lung areas (IPFn) demonstrate largely preserved pulmonary microarchitecture, but scattered areas of organizing pneumonia and non-specific interstitial pneumonia are also present. I, J. Low- (I) and high-magnification (J) histologic images from macroscopically scarred IPF lung areas (IPFs) demonstrate dense areas of scarring, collapse of secondary lobules, architectural remodeling, honeycombing (cysts lined with ciliated respiratory epithelium and goblet cells), fibroblastic foci, and lymphocyte aggregates.
Figure 2
Figure 2
Overview of the differential expression of genes between lung tissue samples from patients with IPF and healthy controls. A. Two-dimensional principal component analysis of the RNASeq transcriptome dataset for lung tissue samples in this study reveals a clear separation of the samples from healthy controls (HC) and samples from patients with IPF. The separation of IPF samples from macroscopically normal-appearing (IPFn) and scarred (IPFs) areas is less pronounced, with some overlap present. Data ellipses for sample groups are plotted assuming a t-distribution at the confidence level 0.90 B. Unsupervised clustering of log2-transformed normalized counts (see Supplementary Dataset 1 for numerical values), using Spearman rank correlation with average linkage, of tissue samples based on 2,099 differentially expressed genes (see text for selection criteria). The genes themselves were also clustered using the same procedure. Note the varying extent of overlap between the sample groups (HC, IPFn, and IPFs highlighted with colored bars above the sample labels) and the clusters: the HC samples clustered separately from the IPF samples, whereas some of the IPFs samples clustered together with the IPFn. C-F. Volcano plots [−log10(padj) vs log2(Fold Difference)] of genes in the HC vs IPFn (C), HC vs IPFs (D), HS vs IPF combined (E), and IPFn vs IPFs (F) comparisons. The total numbers of genes meeting the selection criteria for elevated (purple) or reduced (orange) expression are indicated in each panel. See Supplementary Tables 3-6 for numerical values of RNASeq counts for differentially expressed genes in each of these of these comparisons.
Figure 3
Figure 3
Elevated (A) or reduced (B) differential expression of genes in IPFn and IPFs tissues, each compared with HC samples. Among differentially expressed genes, 458 were similarly elevated and 291 similarly decreased in both the IPFn and IPFs groups, thus defining the overlap group, which was further considered in gene ontology enrichment analyses. The bar graphs represent the top 20 pathways with the lowest P-values for elevated and reduced gene expression patterns. Colored bars (upper horizontal axes) indicate pathway enrichment, and black bars (lower horizontal axes) indicate –log10(P-values) for the pathways indicated on the vertical axes. Note that the statistical significance of pathway enrichment was substantially higher for the overlap group with elevated expression in IPF tissues (A). See Supplementary Dataset 6 for numerical values of RNASeq counts for genes that were similarly elevated and similarly reduced in both IPFn and IPFs tissues compared with HC samples.
Figure 4
Figure 4
Differential expression of genes between IPFn and IPFs tissues. The volcano plots for this comparison are shown in Figure 2F and the numerical values of RNASeq counts are included in Supplementary Dataset 5. A. Unsupervised clustering of log2-transformed normalized counts using Spearman rank correlation with the average linkage of 650 differentially expressed genes (410 elevated and 240 reduced in IPFs vs IPFn). B. Gene ontology enrichment in the gene set with elevated expression in IPFs; the top 20 pathways with the lowest P-values are included. C. Gene ontology enrichment in the gene set with reduced expression in IPFs; the top 20 pathways with lowest P-values are included. In panels B and C, the colored bars (upper horizontal axes) indicate pathway enrichment and black bars (lower horizontal axes) indicate – log10(P-values) for the pathways indicated on the vertical axes.
Figure 5
Figure 5
Differential expression of selected genes associated with extracellular matrix (A), inflammation and immunity (B), and cilia, flagella, and pulmonary epithelia (C). These gene lists were suggested by GO analyses and further modified based on the existing literature regarding involvement of related pathways in mechanisms of lung fibrosis. The numerical values of expression levels can be found by searching Supplementary Dataset 1 for the genes of interest.
Figure 6
Figure 6
Confirmation of selected RNASeq findings by RT-qPCR. The HC, IPFn, and IPFs mRNA samples used for the RNASeq analyses described above were reverse-transcribed and the cDNAs amplified with primers for the indicated targets. Data for each target were normalized to 18S rRNA and presented in the form of violin plots as fold differences versus the median value in the HC groups. The numbers below the indicated tissue types represent median normalized RNASeq counts from the LRT analysis described in the text. In all cases, IPFn and IPFs were significantly different from their corresponding HC groups according to a two-tailed Student's t-test and a Mann-Whitney U-test.

References

    1. Bradley B, Branley HM, Egan JJ, Greaves MS, Hansell DM, Harrison NK, Hirani N, Hubbard R, Lake F, Millar AB, Wallace WA, Wells AU, Whyte MK, Wilsher ML B.T.S.S.o.C.C. British Thoracic Society Interstitial Lung Disease Guideline Group, A. Thoracic Society of, S. New Zealand Thoracic, S. Irish Thoracic. Interstitial lung disease guideline: the British Thoracic Society in collaboration with the Thoracic Society of Australia and New Zealand and the Irish Thoracic Society. Thorax. 2008;63(5):v1–58. - PubMed
    1. Raghu G, Collard HR, Egan JJ, Martinez FJ, Behr J, Brown KK, Colby TV, Cordier JF, Flaherty KR, Lasky JA, Lynch DA, Ryu JH, Swigris JJ, Wells AU, Ancochea J, Bouros D, Carvalho C, Costabel U, Ebina M, Hansell DM, Johkoh T, Kim DS, King TE, Jr, Kondoh Y, Myers J, Muller NL, Nicholson AG, Richeldi L, Selman M, Dudden RF, Griss BS, Protzko SL, Schunemann HJ A.E.J.A.C.o.I.P. Fibrosis. An official ATS/ERS/JRS/ALAT statement: idiopathic pulmonary fibrosis: evidence-based guidelines for diagnosis and management. American journal of respiratory and critical care medicine. 2011;183:788–824. - PMC - PubMed
    1. Travis WD, Costabel U, Hansell DM, King TE, Jr, Lynch DA, Nicholson AG, Ryerson CJ, Ryu JH, Selman M, Wells AU, Behr J, Bouros D, Brown KK, Colby TV, Collard HR, Cordeiro CR, Cottin V, Crestani B, Drent M, Dudden RF, Egan J, Flaherty K, Hogaboam C, Inoue Y, Johkoh T, Kim DS, Kitaichi M, Loyd J, Martinez FJ, Myers J, Protzko S, Raghu G, Richeldi L, Sverzellati N, Swigris J, Valeyre D A.E.C.o.I.I. Pneumonias. An official American Thoracic Society/European Respiratory Society statement: Update of the international multidisciplinary classification of the idiopathic interstitial pneumonias. American journal of respiratory and critical care medicine. 2013;188:733–748. - PMC - PubMed
    1. Ahluwalia N, Shea BS, Tager AM. New therapeutic targets in idiopathic pulmonary fibrosis. Aiming to rein in runaway wound-healing responses. American journal of respiratory and critical care medicine. 2014;190:867–878. - PMC - PubMed
    1. Boon K, Bailey NW, Yang J, Steel MP, Groshong S, Kervitsky D, Brown KK, Schwarz MI, Schwartz DA. Molecular phenotypes distinguish patients with relatively stable from progressive idiopathic pulmonary fibrosis (IPF) PLoS One. 2009;4:e5134. - PMC - PubMed

Publication types

MeSH terms