. 2018 May 15:248:52-60.
doi: 10.1016/j.foodchem.2017.12.034. Epub 2017 Dec 11.

16-O-methylcafestol is present in ground roast Arabica coffees: Implications for authenticity testing

Affiliations

16-O-methylcafestol is present in ground roast Arabica coffees: Implications for authenticity testing

Yvonne Gunning et al. Food Chem. .

Abstract

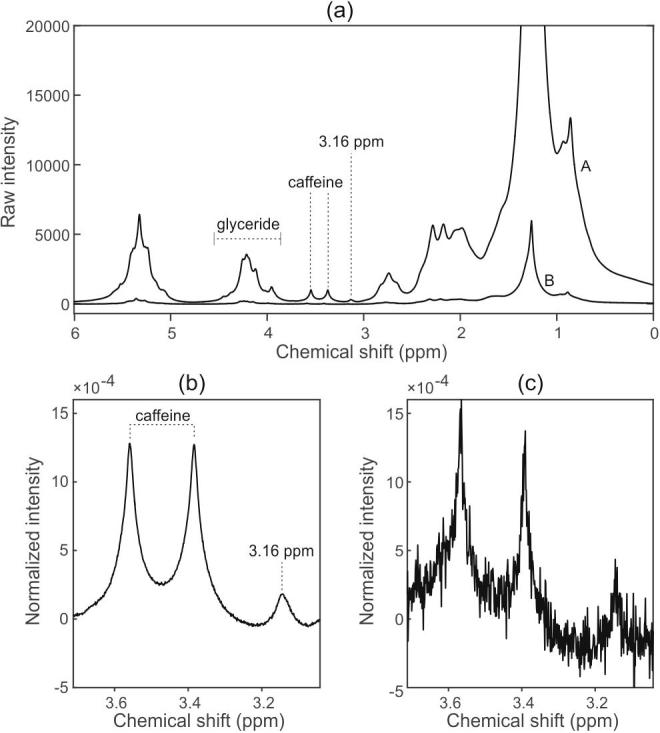
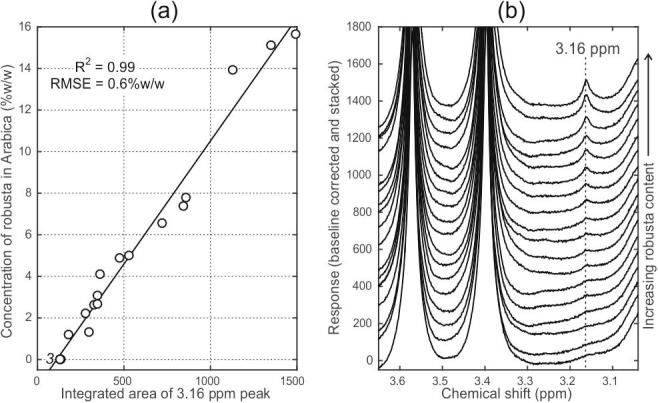
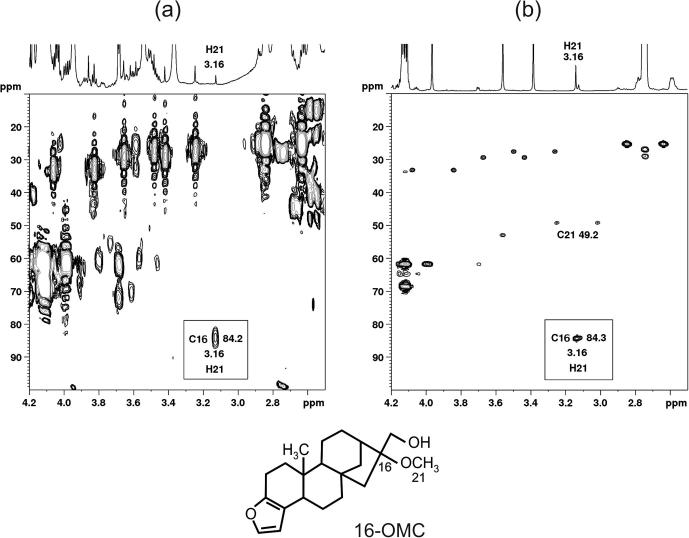
High-field and low-field proton NMR spectroscopy were used to analyse lipophilic extracts from ground roast coffees. Using a sample preparation method that produced concentrated extracts, a small marker peak at 3.16 ppm was observed in 30 Arabica coffees of assured origin. This signal has previously been believed absent from Arabicas, and has been used as a marker for detecting adulteration with robusta. Via 2D 600 MHz NMR and LC-MS, 16-O-methylcafestol and 16-O-methylkahweol were detected for the first time in Arabica roast coffee and shown to be responsible for the marker peak. Using low-field NMR, robusta in Arabica could be detected at levels of the order of 1-2% w/w. A surveillance study of retail purchased "100% Arabica" coffees found that 6 out of 60 samples displayed the 3.16 ppm marker signal to a degree commensurate with adulteration at levels of 3-30% w/w.

Keywords: Adulteration; Arabica; Authentication; Coffee; Low-field; NMR; Robusta; Species; Spectroscopy.


Figures

Fig. 1
Fig. 1
(a) 60 MHz 1H NMR spectra obtained from two lipophilic extracts prepared from a sample of robusta coffee beans. Spectrum A is of an extract prepared using the method involving a concentration step; spectrum B is of an extract prepared using the previously reported direct extraction method. Panels (b) and (c) show expansions around the 3.16 ppm and caffeine peaks (∼3.38, ∼3.58 ppm), for the concentrated and direct methods respectively.
Fig. 2
Fig. 2
(a) Robusta content of a mixture series versus the integrated area of the 3.16 ppm peak in 60 MHz spectra; simple linear regression line is indicated. (b) The 3.16 ppm region from the mixture series spectra shown as a stacked plot for clarity. The three bottom traces are from repeat extractions of 100% Arabica beans.
Fig. 3
Fig. 3
HMBC spectra of (a) an Arabica and (b) a robusta sample, together with the structure of 16-O-methylcafestol. The corresponding 1H spectra are shown above each plot with the 3.16 ppm peak indicated (H21 of esterified 16-OMC and 16-OMK). Note the difference in intensity: in (a) the peak immediately to the left of the 3.16 ppm signal, and slightly stronger, is the 13C satellite of one of the caffeine peaks; in (b) this satellite is not visible on the scale plotted. The cross peak highlighted at 3.16/84.2 ppm in both plots is the 3JHC mediated correlation between H21/C16. No other 1H/13C correlations were detected on the 3.16 ppm trace. The direct 1JCH correlation H21/C21 may also be seen (via the 13C satellites) in (b). The corresponding signals were too weak to be seen in (a) although the correlation was detected in the HSQC spectrum of Arabica.
Fig. 4
Fig. 4
The region around the 3.16 ppm peak in spectra acquired from 30 Arabica coffees of assured origin, by (a) 60 MHz and (b) 600 MHz NMR. In both cases the spectra have been internally normalized to the glyceride peaks to facilitate side-by-side comparison on the same vertical scale.
Fig. 5
Fig. 5
(a) The integrated 3.16 ppm peak areas in 60 MHz spectra from the assured source Arabicas. Samples 1, 13, 14 and 16 originate from atypical coffee-growing locations. Replicate measurements made on repeat extractions from these samples are indicated by joined points. (b) Normal probability plot for the data in (a) (excluding the atypical samples). (c) Empirical and fitted cumulative distribution functions for typical Arabica coffees.
Fig. 6
Fig. 6
(a) The low concentration region in a calibration chart developed to estimate the concentration of adulterant (robusta or other non-Arabica) present in samples that fail to be accepted as authentic Arabicas. The calibration line (black) indicates the median of the regression lines obtained by simple linear regression onto all possible pair-wise combinations of Arabica and non-Arabicas. Percentiles are as indicated (coloured lines). The open and closed markers indicate the actual and predicted concentrations for the mixture series, with the error indicated by vertical lines. (b) The integrated 3.16 ppm peak areas for the 60 surveillance samples. The right-hand vertical axis is an equivalent concentration scale obtained from the calibration line in (a).

References

    1. Aga E., Bekele E., Bryngelsson T. Inter-simple sequence repeat (ISSR) variation in forest coffee trees (Coffea arabica L.) populations from Ethiopia. Genetica. 2005;124(2–3):213–221. - PubMed
    1. Aga E., Bryngelsson T., Bekele E., Salomon B. Genetic diversity of forest arabica coffee (Coffea arabica L.) in Ethiopia as revealed by random amplified polymorphic DNA (RAPD) analysis. Hereditas. 2003;138(1):36–46. - PubMed
    1. Anthony F., Bertrand B., Quiros O., Wilches A., Lashermes P., Berthaud J. Genetic diversity of wild coffee (Coffea arabica L.) using molecular markers. Euphytica. 2001;118(1):53–65.
    1. Belitz H.D., Grosch W., Schieberle P. 4 ed. Spinger; Berlin Heidelberg: 2009. Food chemistry.
    1. Bonnlander B., Wunnecke H., Winterhalter P. Rapid and sensitive detection of robusta traces in blends of raw and roasted coffee. Lebensmittelchemie. 2007;61:79–80.

LinkOut - more resources