

Altered gene expression in tree shrew retina and retinal pigment epithelium produced by short periods of minus-lens wear
- PMID: 29329973
- PMCID: PMC5826887
- DOI: 10.1016/j.exer.2018.01.005
Altered gene expression in tree shrew retina and retinal pigment epithelium produced by short periods of minus-lens wear
Abstract
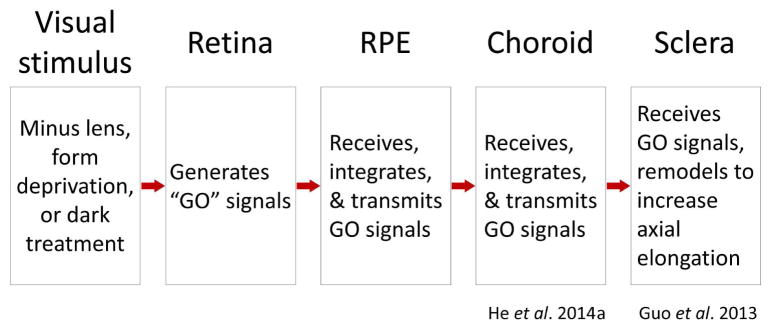
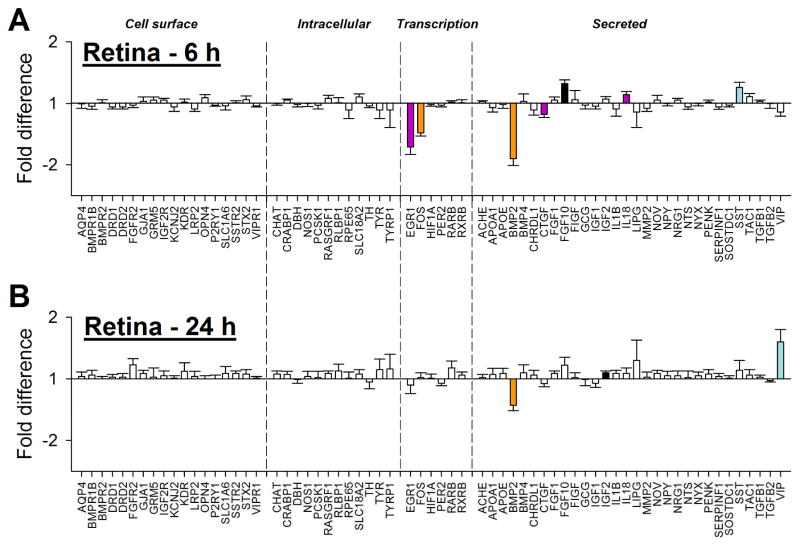
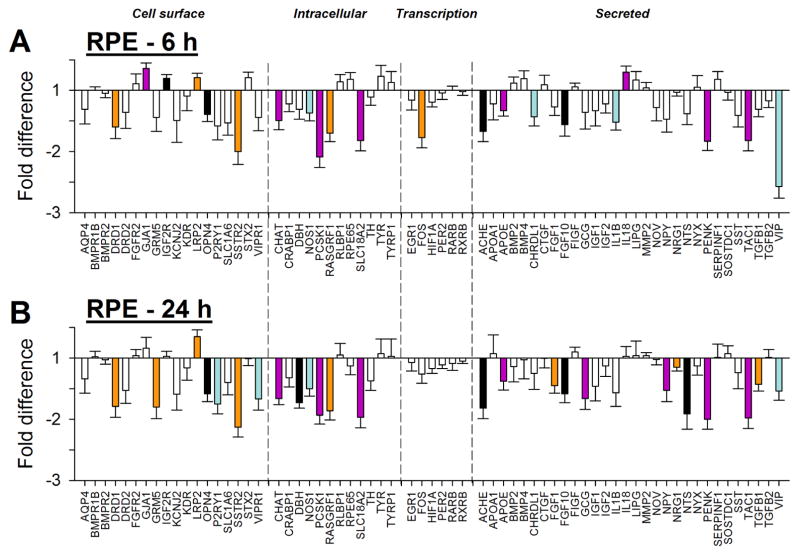
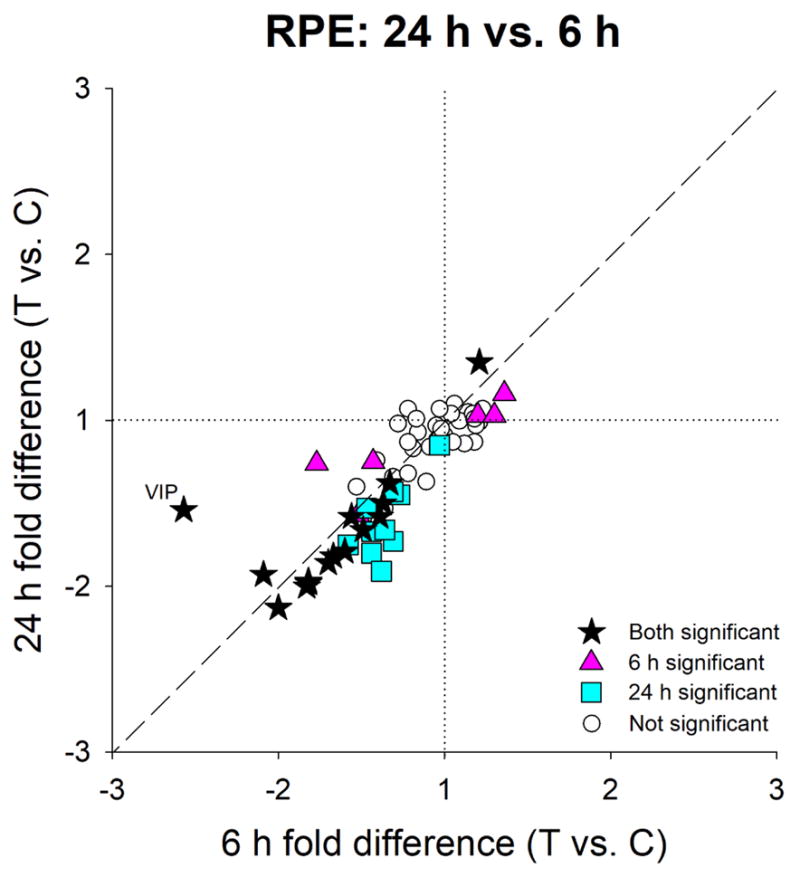
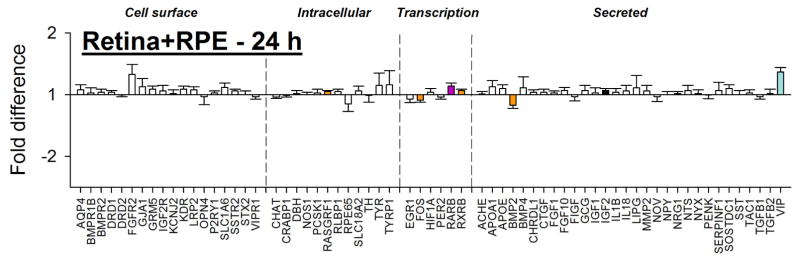
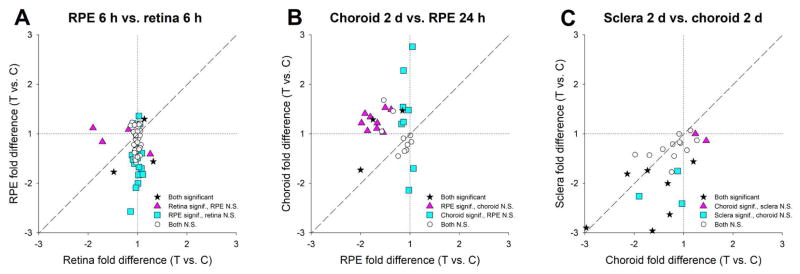
Hyperopic refractive error is detected by retinal neurons, which generate GO signals through a direct emmetropization signaling cascade: retinal pigment epithelium (RPE) into choroid and then into sclera, thereby increasing axial elongation. To examine signaling early in this cascade, we measured gene expression in the retina and RPE after short exposure to hyperopia produced by minus-lens wear. Gene expression in each tissue was compared with gene expression in combined retina + RPE. Starting 24 days after normal eye opening, three groups of juvenile tree shrews (n = 7 each) wore a monocular -5 D lens. The untreated fellow eye served as a control. The "6h" group wore the lens for 6 h; the "24h" group wore the lens for 24 h; each group provided separate retina and RPE tissues. Group "24hC" wore the lens for 24 h and provided combined retina + RPE tissue. Quantitative PCR was used to measure the relative differences (treated eye vs. control eye) in mRNA levels for 66 candidate genes. In the retina after 6 h, mRNA levels for seven genes were significantly regulated: EGR1 and FOS (early intermediate genes) were down-regulated in the treated eyes. Genes with secreted protein products, BMP2 and CTGF, were down-regulated, whilst FGF10, IL18, and SST were up-regulated. After 24 h the pattern changed; only one of the seven genes still showed differential expression; BMP2 was still down-regulated. Two new genes with secreted protein products, IGF2 and VIP, were up-regulated. In the RPE, consistent with its role in receiving, processing, and transmitting GO signaling, differential expression was found for genes whose protein products are at the cell surface, intracellular, in the nucleus, and are secreted. After 6 h, mRNA levels for 17 genes were down-regulated in the treated eyes, whilst four genes (GJA1, IGF2R, LRP2, and IL18) were up-regulated. After 24 h the pattern was similar; mRNA levels for 14 of the same genes were still down-regulated; only LRP2 remained up-regulated. mRNA levels for six genes no longer showed differential expression, whilst nine genes, not differentially expressed at 6 h, now showed differential expression. In the combined retina + RPE after 24 h, mRNA levels for only seven genes were differentially regulated despite the differential expression of many genes in the RPE. Four genes showed the same expression in combined tissue as in retina alone, including up-regulation of VIP despite significant VIP down-regulation in RPE. Thus, hyperopia-induced GO signaling, as measured by differential gene expression, differs in the retina and the RPE. Retinal gene expression changed between 6 h and 24 h of treatment, suggesting evolution of the retinal response. Gene expression in the RPE was similar at both time points, suggesting sustained signaling. The combined retina + RPE does not accurately represent gene expression in either retina or, especially, RPE. When gene expression signatures were compared with those in choroid and sclera, GO signaling, as encoded by differential gene expression, differs in each compartment of the direct emmetropization signaling cascade.
Keywords: Animal models; Axial elongation; Direct emmetropization signaling cascade; Gene expression; Myopia; Refractive error.
Copyright © 2018 Elsevier Ltd. All rights reserved.
Figures

References
-
- Ashby RS, Feldkaemper MP. Gene expression within the amacrine cell layer of chicks after myopic and hyperopic defocus. Invest Ophthalmol Vis Sci. 2010;51:3726–3735. - PubMed
-
- Belecky-Adams T, Adler R. Developmental expression patterns of bone morphogenetic proteins, receptors, and binding proteins in the chick retina. J Comp Neurol. 2001;430:562–572. - PubMed
-
- Bito LZ. The physiology and pathophysiology of intraocular fluids. Exp Eye Res. 1977;25:273–289. - PubMed
Publication types
MeSH terms
Substances
Grants and funding
LinkOut - more resources
Full Text Sources
Other Literature Sources
Miscellaneous
