. 2018 Mar 1;84(6):e02712-17.
doi: 10.1128/AEM.02712-17. Print 2018 Mar 15.

Effect of Plasmid Design and Type of Integration Event on Recombinant Protein Expression in Pichia pastoris

Affiliations

Effect of Plasmid Design and Type of Integration Event on Recombinant Protein Expression in Pichia pastoris

Thomas Vogl et al. Appl Environ Microbiol. .

Abstract

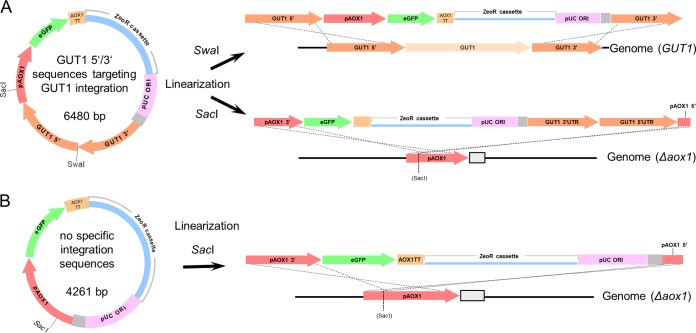
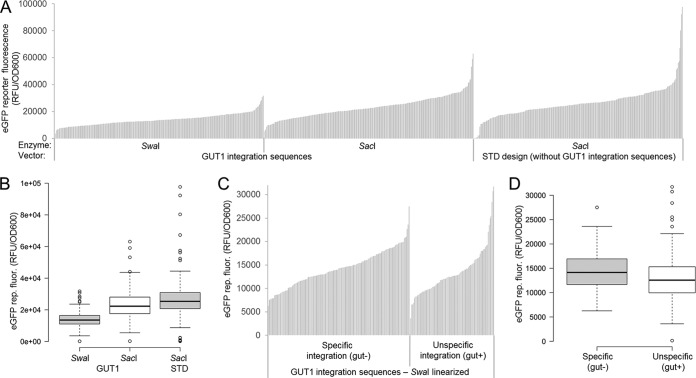
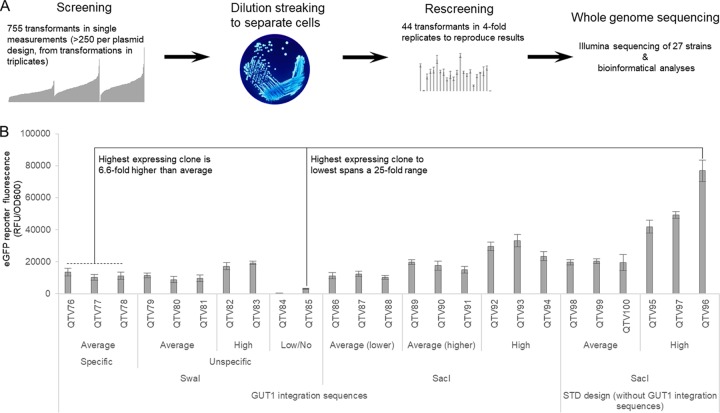
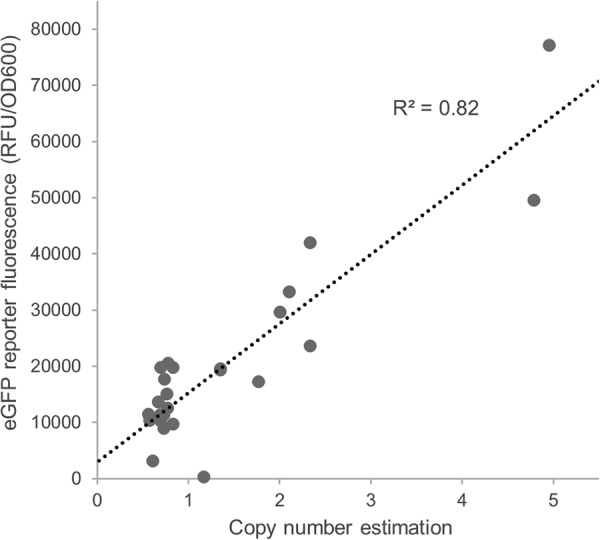
Pichia pastoris (syn. Komagataella phaffii) is one of the most common eukaryotic expression systems for heterologous protein production. Expression cassettes are typically integrated in the genome to obtain stable expression strains. In contrast to Saccharomyces cerevisiae, where short overhangs are sufficient to target highly specific integration, long overhangs are more efficient in P. pastoris and ectopic integration of foreign DNA can occur. Here, we aimed to elucidate the influence of ectopic integration by high-throughput screening of >700 transformants and whole-genome sequencing of 27 transformants. Different vector designs and linearization approaches were used to mimic the most common integration events targeted in P. pastoris Fluorescence of an enhanced green fluorescent protein (eGFP) reporter protein was highly uniform among transformants when the expression cassettes were correctly integrated in the targeted locus. Surprisingly, most nonspecifically integrated transformants showed highly uniform expression that was comparable to specific integration, suggesting that nonspecific integration does not necessarily influence expression. However, a few clones (<10%) harboring ectopically integrated cassettes showed a greater variation spanning a 25-fold range, surpassing specifically integrated reference strains up to 6-fold. High-expression strains showed a correlation between increased gene copy numbers and high reporter protein fluorescence levels. Our results suggest that for comparing expression levels between strains, the integration locus can be neglected as long as a sufficient numbers of transformed strains are compared. For expression optimization of highly expressible proteins, increasing copy number appears to be the dominant positive influence rather than the integration locus, genomic rearrangements, deletions, or single-nucleotide polymorphisms (SNPs).IMPORTANCE Yeasts are commonly used as biotechnological production hosts for proteins and metabolites. In the yeast Saccharomyces cerevisiae, expression cassettes carrying foreign genes integrate highly specifically at the targeted sites in the genome. In contrast, cassettes often integrate at random genomic positions in nonconventional yeasts, such as Pichia pastoris (syn. Komagataella phaffii). Hence, cells from the same transformation event often behave differently, with significant clonal variation necessitating the screening of large numbers of strains. The importance of this study is that we systematically investigated the influence of integration events in more than 700 strains. Our findings provide novel insight into clonal variation in P. pastoris and, thus, how to avoid pitfalls and obtain reliable results. The underlying mechanisms may also play a role in other yeasts and hence could be generally relevant for recombinant yeast protein production strains.

Keywords: Pichia pastoris; genome analysis; integration; protein expression.


Figures

FIG 1
FIG 1
Setup of the study using integration events targeted by different plasmid designs and linearization. (A) A reporter plasmid bearing sequences homologous to the GUT1 locus (GUT1 5′ and 3′) is linearized with SwaI or SacI. Linearization with SwaI results in overhangs suitable for an omega/ends-out-type recombination event (38) via double crossover at the GUT1 locus in the genome. Correct integration will result in a replacement of the GUT1 gene with the heterologous expression cassette (i.e., Δgut1). Linearization of the same vector with SacI targets a recombination event via the ends-in (38) at the AOX1 promoter in the genome. (B) A SacI integration event was also performed with a control vector lacking GUT1 integration sequences. The reporter plasmid bears an enhanced GFP (eGFP) gene under the control of the AOX1 promoter (pAOX1) and the AOX1 transcription terminator (AOX1TT). The zeocin resistance (ZeoR) cassette consists of an ILV5 promoter for expression in P. pastoris, an EM72 promoter for expression in E. coli, the Sh ble gene, and a terminator (details not shown). The gray sequence between pUC ORI and GUT1 3′UTR/PAOX1 is a remnant present in typical pPpT4-derived vectors (11). Panels A and B are not drawn on the same scale (although elements within panels A or B are at correct relative scale).
FIG 2
FIG 2
Screening of 755 P. pastoris transformants indicates that plasmid design, vector linearization, and the type of integration event (specific/nonspecific) mostly influences the expression range of outliers but not the population distribution. (A) Vectors providing GUT1 integration sequences and a standard vector design were linearized with SwaI and/or SacI targeting the integration events depicted in Fig. 1. Cells were pregrown on glucose for 60 h and subsequently induced with methanol for 48 h. eGFP reporter fluorescence normalized to cell growth (OD600) is shown. Results of landscapes typical for work with P. pastoris (40–43) are shown. Each bar represents a transformant (n = 252, 252, and 251 sample points). (B) The data from panel A are shown as a boxplot (59). Center lines show the medians, and box limits indicate the 25th and 75th percentiles as determined by R software. Whiskers extend 1.5 times the interquartile range from the 25th and 75th percentiles, and outliers are represented by dots. n = 252, 252, and 251 sample points. (C) Expression landscapes of the vector providing GUT1 integration sequences linearized with SwaI sorted by specific/nonspecific integration. Hence, the first third of the data from panel A is shown in a rearranged fashion. Transformants were replica plated in glycerol-containing medium after growth on glucose for 60 h to test for specific/nonspecific integration. Note that the GUT1-SacI and STD-SacI integrating vectors cannot be tested for correct integration in this way. (D) The same data from panel C are shown as a boxplot (59). Center lines show the medians, and box limits indicate the 25th and 75th percentiles as determined by R software. Whiskers extend 1.5 times the interquartile range from the 25th and 75th percentiles, and outliers are represented by dots; the width of the boxes is proportional to the square root of the sample size. n = 158 and 94 sample points.
FIG 3
FIG 3
Strains selected for whole-genome sequencing span a 25-fold expression range. (A) Workflow from screening to whole-genome sequencing (WGS). Forty-four transformants from the screening pool of 755 transformants were used for dilution streaking and rescreened in biological 4-fold replicates. Twenty-seven strains eventually were used for WGS. The image of the dilution streaking is taken from the Public Health Image Library (identifier 7925), CDC/James Gathany. (B) eGFP fluorescence measurements of the strains selected for WGS span a 25-fold expression range, and the highest-expressing strain surpasses average clones by more than 6-fold. Cells were pregrown on glucose for 60 h and subsequently induced with methanol for 48 h. eGFP reporter fluorescence normalized to cell growth (OD600) is shown. Mean values and standard deviations of biological 4-fold replicates are shown. Here, 25 strains transformed with eGFP plasmids are shown, and the parental strain (mutS) and the mutS strain transformed without DNA were sequenced. Identifiers refer to internal strain collection numbers assigned at QUT.
FIG 4
FIG 4
Copy numbers correlate with measured eGFP reporter protein fluorescence. Copy numbers (summarized in Table 1; raw data and calculation are shown in Data Set S7), and eGFP reporter protein fluorescence measurements (normalized by OD600, as obtained from the rescreening and shown in Fig. 3) were correlated. The raw data of the unrounded copy numbers are shown (Data Set S7).

References

    1. Ahmad M, Hirz M, Pichler H, Schwab H. 2014. Protein expression in Pichia pastoris: recent achievements and perspectives for heterologous protein production. Appl Microbiol Biotechnol 98:5301–5317. doi:10.1007/s00253-014-5732-5. - DOI - PMC - PubMed
    1. Gasser B, Prielhofer R, Marx H, Maurer M, Nocon J, Steiger M, Puxbaum V, Sauer M, Mattanovich D. 2013. Pichia pastoris: protein production host and model organism for biomedical research. Fut Microbiol 8:191–208. doi:10.2217/fmb.12.133. - DOI - PubMed
    1. Vogl T, Hartner FS, Glieder A. 2013. New opportunities by synthetic biology for biopharmaceutical production in Pichia pastoris. Curr Opin Biotechnol 24:1094–1101. doi:10.1016/j.copbio.2013.02.024. - DOI - PMC - PubMed
    1. Bill RM. 2014. Playing catch-up with Escherichia coli: using yeast to increase success rates in recombinant protein production experiments. Front Microbiol 5:85. doi:10.3389/fmicb.2014.00085. - DOI - PMC - PubMed
    1. Jahic M, Veide A, Charoenrat T, Teeri T, Enfors S-O. 2006. Process technology for production and recovery of heterologous proteins with Pichia pastoris. Biotechnol Prog 22:1465–1473. doi:10.1021/bp060171t. - DOI - PubMed

Publication types