. 2018 Mar;16(3):517-527.
doi: 10.1158/1541-7786.MCR-17-0197. Epub 2018 Jan 12.

Centriole Overduplication is the Predominant Mechanism Leading to Centrosome Amplification in Melanoma

Affiliations

Centriole Overduplication is the Predominant Mechanism Leading to Centrosome Amplification in Melanoma

Ryan A Denu et al. Mol Cancer Res. 2018 Mar.

Abstract

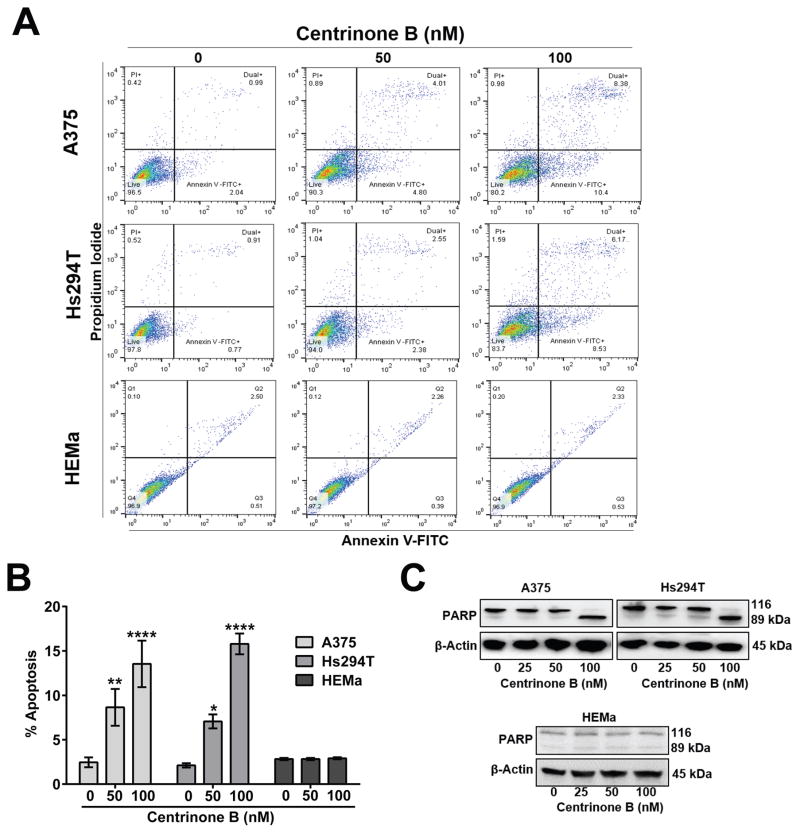
Centrosome amplification (CA) is common in cancer and can arise by centriole overduplication or by cell doubling events, including the failure of cell division and cell-cell fusion. To assess the relative contributions of these two mechanisms, the number of centrosomes with mature/mother centrioles was examined by immunofluorescence in a tissue microarray of human melanomas and benign nevi (n = 79 and 17, respectively). The centrosomal protein 170 (CEP170) was used to identify centrosomes with mature centrioles; this is expected to be present in most centrosomes with cell doubling, but on fewer centrosomes with overduplication. Using this method, it was determined that the majority of CA in melanoma can be attributed to centriole overduplication rather than cell doubling events. As Polo-like kinase 4 (PLK4) is the master regulator of centriole duplication, the hypothesis that PLK4 overexpression contributes to centriole overduplication was evaluated. PLK4 is significantly overexpressed in melanoma compared with benign nevi and in a panel of human melanoma cell lines (A375, Hs294T, G361, WM35, WM115, 451Lu, and SK-MEL-28) compared with normal human melanocytes. Interestingly, although PLK4 expression did not correlate with CA in most cases, treatment of melanoma cells with a selective small-molecule PLK4 inhibitor (centrinone B) significantly decreased cell proliferation. The antiproliferative effects of centrinone B were also accompanied by induction of apoptosis.Implications: This study demonstrates that centriole overduplication is the predominant mechanism leading to centrosome amplification in melanoma and that PLK4 should be further evaluated as a potential therapeutic target for melanoma treatment. Mol Cancer Res; 16(3); 517-27. ©2018 AACR.


Conflict of interest statement

Competing Interests: The authors declare that they have no competing interests.

Figures

Figure 1
Figure 1. Centrosome amplification is prevalent in melanoma
(A) Micrographs demonstrating centrosome amplification in melanoma but not in benign melanocytes from a melanoma TMA (US Biomax TMA# ME1004c). Blue = DNA/DAPI, red = pericentrin, scale bar = 5 μm. (B) Dot plot demonstrating the number of pericentrin foci observed in each individual cell in every sample in the TMA. Melanoma samples are demonstrated with black circles and benign samples are demonstrated with gray triangles. Each dot represents one cell. (C) The data from panel B are combined to demonstrate aggregate differences in CA between melanoma and benign samples. (D) Dot plot quantifying the percent of cells displaying centrosome amplification, defined as having more than 2 pericentrin foci, in melanoma samples (n=79) versus benign samples (n=17). (E) Dot plot demonstrating differences in centrosome amplification based on primary melanoma tumors of stage I–IV (n=59) versus metastatic tissue (n=20) versus benign tissue (n=17). Bars represent means ±SD. Statistical significance is indicated as *p<0.05. T tests were used in C and D, and an ANOVA was used in E.
Figure 2
Figure 2. Centrosome amplification arises predominantly from centriole overduplication
(A) Normally cells have one centrosome during G1 with one mother centriole expressing CEP170, two centrosomes after duplication in early S phase, and CEP170 is recruited to one centriole in each centrosome late in G2. If centriole overduplication was predominant, then one would expect many centrosomes with only one staining for CEP170. Conversely, if doubling events predominated, then one would expect many centrosomes that all stain for CEP170. (B) Micrographs demonstrating centrosomes lacking CEP170 (low overlap, more consistent with centriole overduplication hypothesis) versus centrosomes expressing CEP170 (high overlap, more consistent with cell doubling hypothesis). Blue = DNA/DAPI, green = CEP170, red = pericentrin, scale bar = 5 μm. (C) Dot plot quantifying the percent of centrosomes staining for CEP170 in melanoma samples (n=79) versus benign samples (n=17). (D) Dot plot demonstrating differences in the percent of centrosomes staining for CEP170 based on primary melanoma tumors of stage I–IV (n=59) versus metastatic tissue (n=20) versus benign tissue (n=17). Bars represent means ±SD. Statistical significance is indicated as *p<0.05. A T test was used in C.
Figure 3
Figure 3. PLK4 is required for centriole overduplication but its overexpression does not drive most instances of centrosome amplification in human melanoma
(A) Representative micrograph of a melanoma immunostained using PLK4, pericentrin, and γ-tubulin antibodies Scale bar = 10 μm. (B) Quantification of PLK4 expression that overlapped with pericentrin. Bars represent means ± SD with statistical significance *p<0.05. (C) Correlation of PLK4 expression with centrosomes (average pericentrin foci per cell in each sample). (D) Correlation of PLK4 expression with centrosome amplification, defined as the percent of cells with greater than 2 centrosomes (Pearson R for melanomas = 0.26, P value = 0.04). (E) Correlation of PLK4 expression with the average percent of centrosomes expressing CEP170 in each sample (Pearson R for melanomas = −0.22, P value = 0.07). The dotted rectangle indicates cases where we anticepated that PLK4 overexpression caused CA by centriole overduplication.
Figure 4
Figure 4. PLK4 is overexpressed in human melanoma cell lines, and its inhibition with small molecule inhibitor centrinone B significantly reduces cell viability in human melanoma cells
(A) Western blot, and (B) qRT-PCR analysis for PLK4 expression in normal adult human epidermal melanocytes (HEMa) and seven human melanoma cell lines (A375, Hs294T, G361, WM35, WM115, 451Lu, and SK-MEL-28). (C) Centrioles were assessed before and after centrinone B treatment by immunofluorescence. Representative images of A375 and Hs294T melanoma cells with or without centrinone B treatment (100 nM for 48 hours). Centrin labels individual centrioles while pericentrin labels the entire centrosome or PCM. Scale = 5 μm. (D) Quantification of centrioles in each cell line before and after treatment with centrinone B. (E) Correlation of centrioles with PLK4 protein expression in the melanoma cell lines. PLK4 expression was normalized to actin. Pearson R = 0.47, P value = 0.24. (F) Correlation of centrioles with PLK4 mRNA expression in the melanoma cell lines. Pearson R = 0.05, P value = 0.90. (G) Quantification of the percent of centrioles with <4 centrioles before and after treatment with centrinone B. (H) The anti-proliferative potential of PLK4 inhibitor centrinone B (treated for 48 hours) was assessed using CytoTox-Glo assay in A375, Hs294T, G361, and SK-MEL-28 melanoma cell lines as well as in normal human melanocytes. All the data are representative of at least three independent experiments. Quantitative results are presented as means ± SEM. Statistical significance are indicated as *p<0.05, **p<0.1, ***p<0.001.
Figure 5
Figure 5. PLK4 inhibition with centrinone B causes apoptosis in human melanoma cells
(A) Melanoma cells were grown to 70% confluency, then treated for 48 hours with 50, 100 nM of centrinone B. The number of apoptotic cells was assessed by flow cytometric analysis of annexinV/propidium iodide (PI) staining. Representative two-dimensional dot plots of annexinV-FITC and PI fluorescence are shown here. (B) Total Annexin V-positive and Annexin V-positive plus propidium iodide-positive (Q2+Q3 quadrants/apoptotic) cells are plotted. Data represent means ± SEM of three replicates. Statistical significance is indicated as *p<0.05, **p<0.1, ***p<0.001, ****p<0.0001. (C) Western blot analysis of PARP cleavage in 25, 50, 100 nM centrinone B-treated A375, Hs294T, and HEMa cells. β-actin was used as a loading control.

References

    1. Chan JY. A clinical overview of centrosome amplification in human cancers. Int J Biol Sci. 2011;7:1122–44. - PMC - PubMed
    1. Nigg EA. Origins and consequences of centrosome aberrations in human cancers. Int J Cancer. 2006;119:2717–23. - PubMed
    1. Pihan GA, Purohit A, Wallace J, Knecht H, Woda B, Quesenberry P, et al. Centrosome defects and genetic instability in malignant tumors. Cancer Res. 1998;58:3974–85. - PubMed
    1. Denu RA, Zasadil LM, Kanugh C, Laffin J, Weaver BA, Burkard ME. Centrosome amplification induces high grade features and is prognostic of worse outcomes in breast cancer. BMC Cancer. 2016;16:47. - PMC - PubMed
    1. Lingle WL, Salisbury JL. Altered centrosome structure is associated with abnormal mitoses in human breast tumors. Am J Pathol. 1999;155:1941–51. - PMC - PubMed

Publication types

Substances